|
May 22, 1998
Wecoma
Cruise W9805A Report
6-22 May 1998
FOCI Cruise No: 2WE98
Operating Area:
Eastern Bering Sea shelf and basin
Participating Organizations
NOAA - Alaska Fisheries Science Center (AFSC)
NOAA - Pacific Marine Environmental Laboratory (PMEL)
University of Alaska-Fairbanks (UAF)
University of Texas (UT)
Personnel
| Chief Scientist |
|
| Dr. Edward D. (Ned) Cokelet |
PMEL |
| Participating Scientists |
|
| Eugene Burger |
PMEL |
| Dr. Susan Henrichs |
UAF |
| Dave Kachel |
PMEL |
| Taekeun Rho |
UAF |
| Stacy Smith |
UAF |
| Lynn Tinnin |
UT |
| Dr. Terry Whitledge |
UT |
| Destry Wion |
AFSC |
Cruise Objectives
This FOCI (Fisheries Oceanography Coordinated Investigations) cruise
was part of the NOAA Coastal Ocean Program Southeast Bering Sea Carrying
Capacity (SEBSCC) project. FOCI is a basic research effort by NOAA scientists
to understand the physical and biological processes that determine recruitment
variability of commercially valuable fin fish and shellfish stocks in Alaskan
waters. SEBSCC is a collaborative effort by NOAA and academic scientists
to understand the effects of abiotic and biotic variability on the SE Bering
Sea ecosystem.
The purpose of this cruise was to investigate spring-bloom physical,
chemical and biological oceanographic processes in the southeastern Bering
Sea, a major center for primary production that supports the upper trophic
levels in the region. The renewal and dispersal of nutrients by physical
processes and regeneration by organic decomposition is balanced by physical
stratification and phytoplankton uptake as the seasons progress from winter
to summer. A secondary purpose was to measure the Bering Slope Current
which runs northwestward in deep water along the continental slope.
Specific objectives were as follows:
1.Assess nutrient inputs and utilization by physical and biological
processes in middle shelf, shelf break, and offshore SEBSCC study areas.
An emphasis was placed on nutrient samples (nitrate, nitrite, ammonium,
phosphate and silicate) from hydrographic and productivity casts in transects
and time series measurements at mooring sites. Additional nutrient samples
were also analyzed for experimental samples collected by other investigators.
(TW)
2.Measure rates of total, "new" and regenerated phytoplankton
production using 13-C and 15-N tracer techniques and "diagram analysis"
of nitrate depletion to determine the proportion of total surface water
column production that is "new" and available for export from
the euphotic zone via settling to deeper waters and/or incorporation by
growth into primary, secondary and tertiary consumers. (Dr. John Goering
& TR)
3.Measure nutrient, chlorophyll, and zooplankton concentrations for
use as biophysical indices of the status and health of the southeastern
Bering Sea ecosystem. The variables will be measured at the SEBSCC monitoring
sites: shelf break, Outer Shelf Domain, Southeast Middle Shelf Domain,
Northwest Middle Shelf Domain and Pribilof Islands. (Dr. Jeff Napp & DW)
4.Measure the composition of lipids and carbon and nitrogen stable isotopes
in zooplankton, suspended particulate matter and surface sediment samples.
The composition of these materials will be compared to that of sinking
organic matter (being collected via automated sediment traps deployed earlier).
This will provide information on the source of sinking organic matter to
the pelagic food web. (SH & SS)
5.Measure the currents (via ADCP) and water properties (via CTD) on a few
transects across the Bering Slope Current and continental shelf and deduce
the geostrophic circulation. (EDC)
Summary of Operations
Physical oceanographic measurements were made on conductivity-temperature-depth
(CTD) casts and via acoustic Doppler current profiler (ADCP) transects.
Water samples were collected with bottles attached to the CTD profiler
rosette. Bongo and CalVET net tows provided zooplankton samples.
Water samples from 85 hydrographic stations were collected at approximately
824 depth horizons sampled by the CTD/rosette profiling system for a total
of about 4120 analyses. The biogenic nutrients (phosphate, silicate, nitrate,
nitrite and ammonium) were analyzed on board ship in near real time to
provide a basis for further sampling and definition of biological patterns.
An additional 150 frozen water samples from the earlier 1998 Miller
Freeman mooring-deployment cruise were also analyzed to provide an
estimate of the late winter nutrient conditions of the study area. Replicate
samples were collected on the present cruise in collaboration with a NOAA
investigator for intercalibration.
At productivity study sites the rates of photosynthesis and nitrogen
uptake( NO3-, NH4+ and Urea) were measured in the euphotic zone at 100%,
50%, 30%, 12%, 5% and 1% surface light penetration depths. The photosynthetic
and nitrogen uptake rate measurements were estimated by addition of H13CO3-,
15NO3-, 15NH4+ and 15N-Urea to euphotic zone water collected at the chosen
light depths. Euphotic zone light levels were determined either with a
Secchi disc or with an underwater PAR sensor. After addition of 13C and
15N enriched compounds, the uptake samples were incubated on deck for about
4 hours in a surface-sea-water-cooled tank exposed to 100%,50%, 30%, 12%,
5%, and 1% surface light intensities as simulated by placing neutral density
metal screens in the incubation bottles. Three phytoplankton samples were
collected for the analysis of the natural abundance of 13C and 15N at each
productivity station and at other stations. We also measured the pH of
seawater at each productivity depth for calculating total CO2. These studies
as summarized in Table 1 will provide the information needed to estimate
photosynthetic carbon uptake and the proportion of new productivity (NO3-
uptake) and regenerated productivity (NH4+ and Urea uptake) during the
Bering Sea phytoplankton bloom.
Table 1. Summary of productivity studies on cruise W9805A.
| Obs. |
Station |
13C |
15NO3 |
15NH4 |
15N-Urea |
Natural 13C and 15N |
pH |
| 1 |
4 |
|
|
|
|
o |
|
| 2 |
5 |
|
|
|
|
o |
|
| 3 |
9 |
|
|
|
|
o |
|
| 4 |
16 |
|
|
|
|
o |
|
| 5 |
11 |
|
|
|
|
o |
|
| 6 |
18 |
o |
o |
o |
o |
o |
o |
| 7 |
25 |
o |
o |
o |
|
o |
o |
| 8 |
27 |
o |
o |
o |
o |
o |
o |
| 9 |
32 |
o |
o |
o |
o |
o |
o |
| 10 |
33 |
o |
o |
|
|
o |
o |
| 11 |
35 |
|
|
|
|
o |
|
| 12 |
39 |
o |
o |
o |
o |
o |
o |
| 13 |
40 |
o |
o |
o |
|
o |
o |
| 14 |
57 |
|
|
|
|
o |
|
| 15 |
59 |
|
|
|
|
o |
|
| 16 |
66 |
o |
o |
o |
o |
o |
o |
| 17 |
67 |
o |
o |
o |
|
o |
o |
| 18 |
75 |
o |
o |
o |
o |
o |
o |
| 19 |
76 |
o |
o |
|
|
o |
o |
| 20 |
82 |
o |
o |
o |
o |
o |
o |
| 21 |
84 |
o |
o |
|
|
o |
o |
At each station primary production was measured at 6 light levels - 100,
50, 30, 12, 5, and 1% of the surface value.
Bongo net tows were conducted at each of the 5 "X" stations
centered at the mooring sites M2, M3, and M4. Zooplankton collected by
one side (1 X 333 µm and 1 X 150 µm net hauls) of the bongo
net tows were sorted to species and the sorted samples frozen for later
analysis of lipids and stable isotopic composition. Soutar-type box cores
were attempted at the first 3 out of 5 "X" stations. Because
of wind and wave activity and consequent ship's motion, coring was not
successful at the three M3 sites; however, short (averaging about 10 cm)
cores were recovered at the other sites attempted. The sediments consisted
of a few cm-thick bioturbated layer overlaying hard relict sand, so longer
cores were not possible. The 0-1 and 1-2 cm sections of each core were
frozen for later analysis.
Tables 2 and 3 show the total numbers of gear types employed and samples
taken as summarized from the Discrete Sample Data Base (DSDB).
Summary of Cruise
The ship's departure on 6 May was delayed 10 hours while we awaited
the arrival of spare parts for the portable Seacat CTD which was to be
used as a pressure sensor on bongo net tows. Although the spare parts cured
the initial problems, the seacat failed to work on station, and bongo tow
depths had to be estimated from wire out and wire angle.
Throughout the cruise, CTD and water bottle casts were to the shallower
of 1500 m or within 10 m of bottom. Nutrient samples were gathered on nearly
every cast spread over the depth range. Bongo tows for zooplankton and
fish larvae were taken to near bottom on the shelf. CalVET tows for eggs
were taken to 60 m.
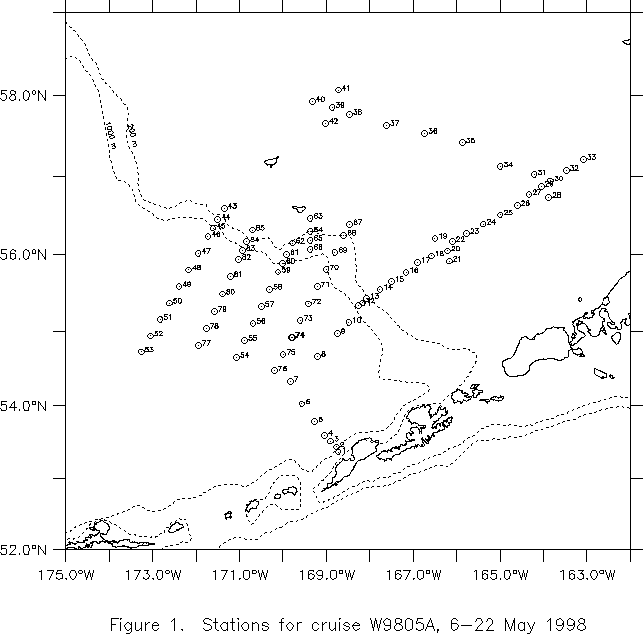
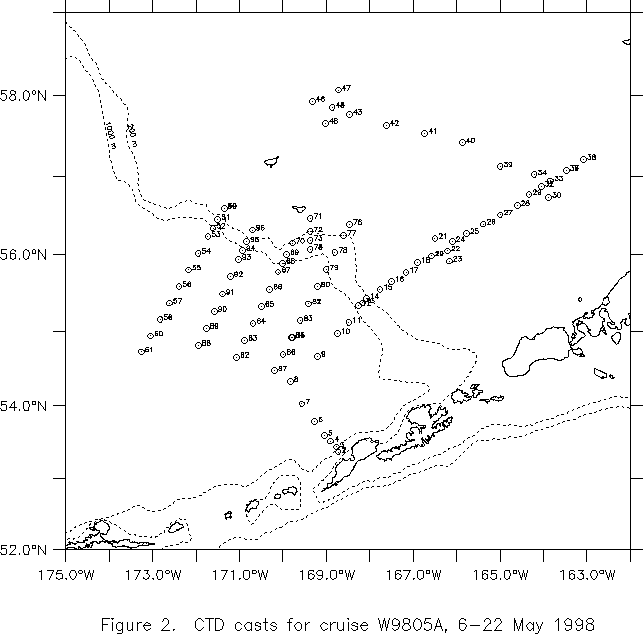
The first scientific sampling began along a line of CTD stations crossing
the Aleutian north-slope current west of Dutch Harbor (Figs. 1 and 2).
Following this the ship proceeded NE across the basin and continental slope
onto the shelf with CTD and water bottle casts at each station. The track
then turned NW along the 70-m-isobath transect from Moorings 2 to 4 (stns.
30-39, Fig. 1). X-shaped sections were occupied at Moorings 3 (stns. 18-22),
2 (stns. 27-31) and 4 (stns. 38-42) to provide information on horizontal
gradients.
Preliminary results indicate that the spring bloom had not yet occurred
on the continental shelf. Nutrient concentrations were high and fluorescence
was low. Stormy weather before and during the cruise had deepened the mixed
layer to the extent that Mooring 2 was in the inner shelf domain with a
surface-to-bottom mixed layer.
From the Mooring-4 cross (stns. 38-42) we steamed SW into the basin
to occupy 4 transects across a decaying anticyclonic eddy deduced from
sea surface height anomalies measured by satellite.
Three major storms with winds in excess of 40 kt, gusting above 55 kt,
and over 24 foot seas cost the cruise 4 1/2 days of ship time as we hove
to, and scientific operations ceased because it was too dangerous to personnel
to launch and recover the CTD. Despite losing 1/4 of the ship time to bad
weather, the cruise occupied 85 stations with 96 CTD casts, 7 box cores
and 45 net hauls. The ship returned to Dutch Harbor on 22 May in good weather.
Specifics of Operations
Table 4 gives a list of the operations as logged in the Discrete Sample
Data Base (DSDB).
Acknowledgments
The scientific party thank the crew of the UNOLS Oregon State University
research vessel Wecoma for their efforts in making this a successful
cruise.
Tables
- Table 1. Summary of productivity studies on cruise
W9805A.
- Table 2. Number of occasions each gear type employed.
- Table 3. Number of each sample type taken.
- Table 4.Cruise W9805A (FOCI 2WE98) summary from
Discrete Sample Data Base.
Figures
Figure 1. Station locations for W9805A.
Figure 2. CTD cast locations for W9805A.
|