Projected Onset of Freeze on the Chukchi Sea Continental Shelf in 2019
The purpose of this experiment is to a) develop an informed basis for advising a hypothetical maritime interest operating in the region; and b) to identify conditions that cause sudden large departures (increase in risk). It also provides a result that can be evaluated against other methodologies.
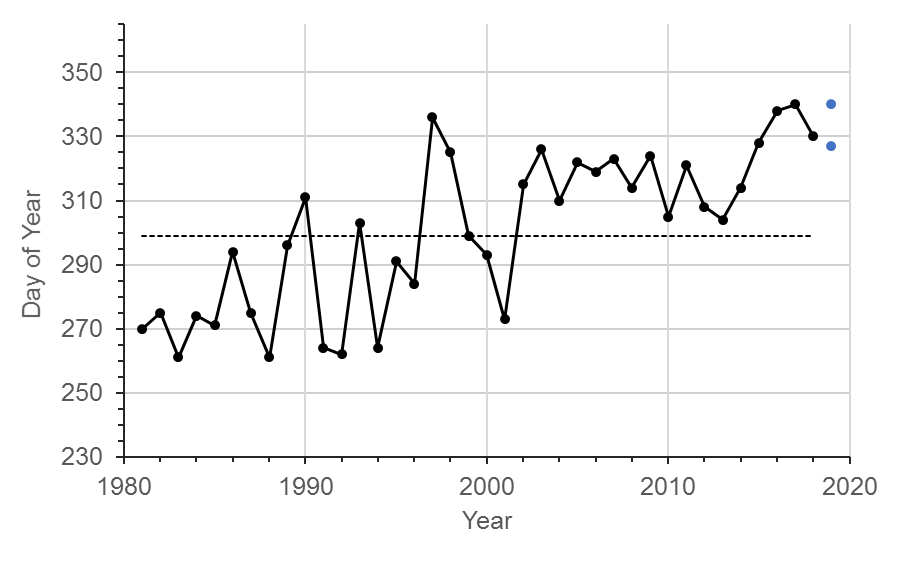
Projection: Freeze onset on the Chukchi Sea continental shelf northwest of Icy Cape is estimated to begin between 23 November and 6 December 2019 (Fig. 1). This is 28-41 days later than the long-term mean (1981-2016). The onset metric is defined by sea-ice concentration reaching 30% as determined by passive microwave observation in the reference area shown in Fig. 2 (top).
Data considered: 2016, 2017, 2018 and 2019 in-situ observations from autonomous ocean profiling floats, aircraft and satellite-derived visible imagery, and SST radiometry. Persistence is evaluated using historical ice concentration data from passive microwave satellites, provided by the National Snow and Ice Data Center (NSIDC).
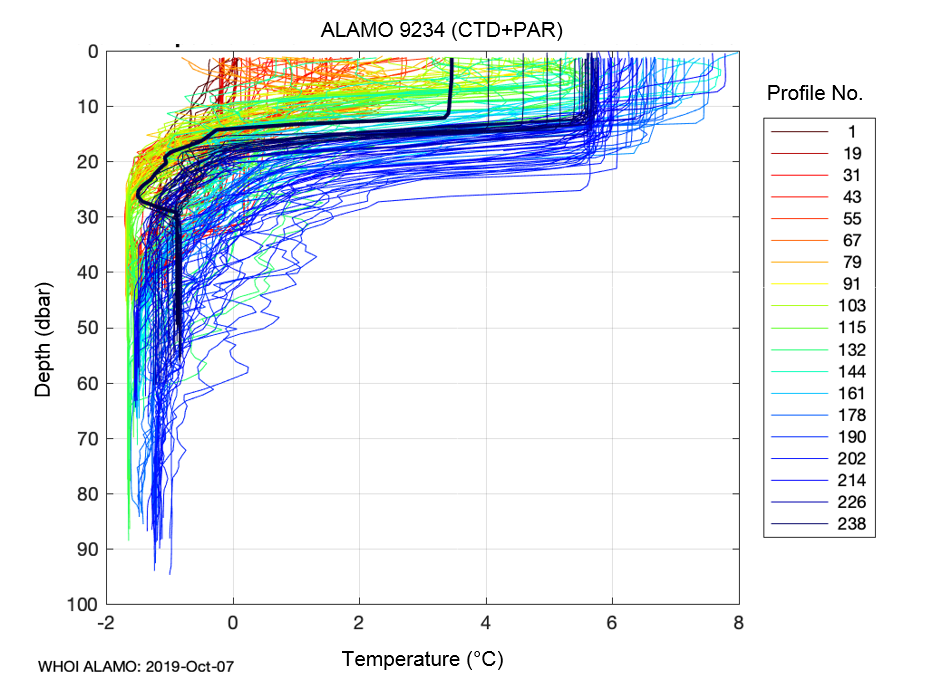
Rationale: Data from autonomous floats indicate upper water column (5-15 m) temperatures in the Chukchi Sea in 2019 were as warm as 2018 between Cape Lisburne and Icy Cape, and considerably warmer than 2016 and 2017. However, in 2019 the water column was more stratified than 2018, and bottom-layer temperatures were cooler. Moreover, float observations show that a relatively thick, cold (-0.8 to -1.6 °C) layer of remnant winter water persisted into autumn near the shelf break to the westward of Barrow Canyon. Thus, it is likely that the water column on the northern shelf will cool faster through mixing than in 2018, offsetting the presence of a very warm, but thinner, surface mixed layer (Fig 2 bottom).
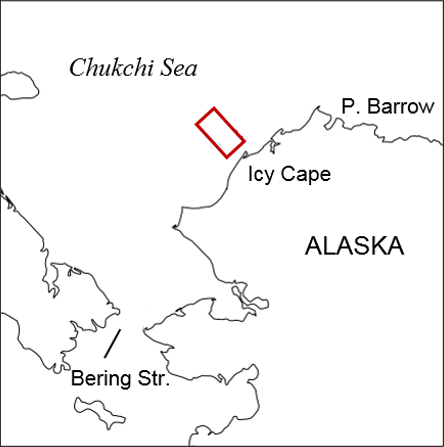
Fig. 2. (Left) Map showing the reference area northwest of Icy Cape (red box) adopted for this projection. (Bottom) Temperature plot from ALAMO float 9234, initially deployed in May 2019. These data show that cold saltier water (generally -1°C or colder, ~32-32.25 PSU) persisted on the Chukchi continental shelf through the summer, under a relatively thin surface mixed layer. Plots of additional variables from this and other floats are available at https://www.pmel.noaa.gov/arctic-heat/.
Review of historical data show that freeze-up has been uniformly later than the long-term mean since 2002, and year-to-year variability has been less. This is due in part to the consistent minima in Arctic sea-ice extent leading to a decline in 2nd year ice advection into the reference area in October and November. The greater distance to the summer sea-ice edge in 2019, along with above freezing water temperatures seen in all of the float data from Canada Basin down to ~100 m suggests that ice advection will be less of a factor than it was in 2018. At freeze-up in 2019, it is likely sea-ice in the reference area will consist entirely of thin, newly formed types (e.g., sheets of young ice and pancake), especially near the coast.