Seafloor Instruments for monitoring submarine volcanoes
One of the goals of the NeMO Program is to have monitoring instruments in place at Axial Volcano. The instruments described below are used to measure vertical and horizontal movements of the seafloor. Why would we want to do that? Well, we're studying how submarine volcanoes work, and we know from volcanoes on land that the surfaces of volcanoes actually deform in response to movements of magma (molten rock) underground. For example, if magma is accumulating beneath a volcano, the ground may gradually swell or inflate. Or if a large volume of magma is removed, the ground may suddenly subside or deflate. So by making precise measurements of ground movements on the surface, we can interpret what is going on underground inside a volcano. Measuring ground deformation is one of the main methods scientists use to monitor volcanoes on land, but the techniques that work best on land (GPS, lasers, optical leveling) are impossible to use in the deep ocean. So we had to come up with new instruments to measure ground movements on the seafloor. As explained below, Bottom Pressure Recorders can measure vertical ground movements and Acoustic Extensometers can measure horizontal ground movements of the seafloor.
Bottom Pressure Recorders
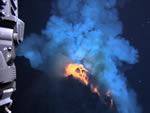
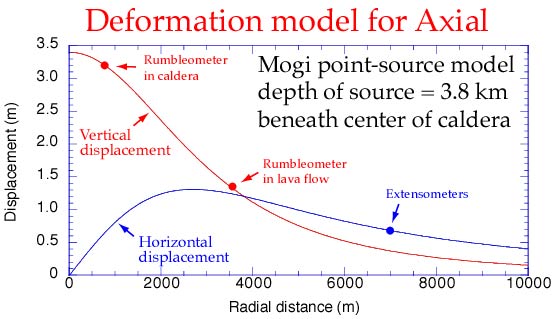
Bottom Pressure Recorders (BPRs) precisely measure the pressure from the overlying ocean at a specific site. Since the pressure is a function of the height of the water column above them these instruments can measure vertical movements of the seafloor, after the predictable variations from ocean tides are removed. Thus, if the seafloor moves up or down, then the instrument measures that there is less or more pressure, respectively. BPRs are usually deployed for a year or two at a time and make a measurement every 15 seconds. As part of the early stages of the NeMO Project, there were BPRs in each of the "rumbleometer" instruments (developed by Chris Fox) that were in place at Axial volcano when the 1998 eruption occurred. The 1998 eruption caused a large volume of magma that had been stored in a reservoir beneath Axial's summit caldera to be removed and intruded into the south rift zone. The removal of this large volume of magma caused the whole summit of Axial seamount to subside, like a balloon that had some of the air taken out of it. The BPR that was at the center of Axial caldera at the time of the 1998 eruption measured 3.2 meters (10.5 feet!) of subsidence. Another BPR was in the rumbleometer that was stuck in the 1998 lava flow until it was extracted in the summer of 1999. This second BPR showed a subsidence of 1.4 meters (4.6 feet) at the eruption site, which is 3.5 km (~2 miles) from the caldera center. These two measurements can be combined with the Acoustic Extensometer measurements (described below) to model the depth of the magma reservoir beneath Axial caldera that caused these ground movements and how much volume was removed during the 1998 eruption.
For more
information:
A prototype instrument combining tiltmeters and bottom pressure recorders was tested on the MARS cabled observatory in Monterey Bay from 2010-2011. Data from that instrument were displayed HERE. Instruments like these will be deployed on the Ocean Observatories Initiative's cabled observatory at Axial Seamount.
Go to the NeMO Explorer web site for Virtual views of the rumbleometer stuck in the lava flow and an animation of what happened to the rumbleometer during the eruption. Also see the NeMO Net web site to see BPR data transmitted back to shore in near real time from the seafloor at Axial volcano
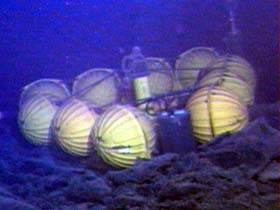
Photo of the rumbleometer stuck in the 1998 lava flow
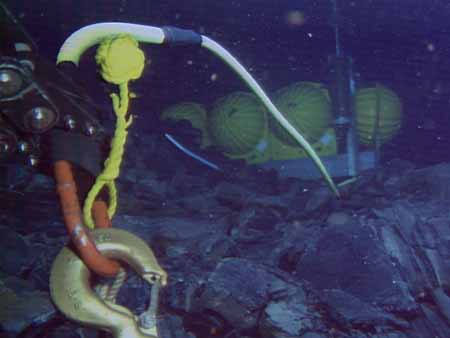
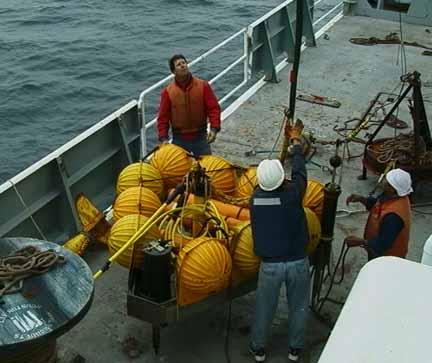
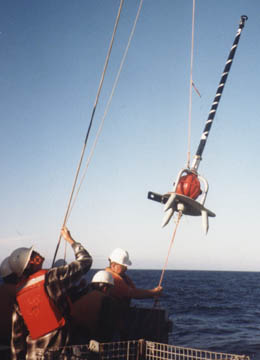
Photo of ROPOS rigging
the stuck rumbleometer to be pulled out of the lava flow
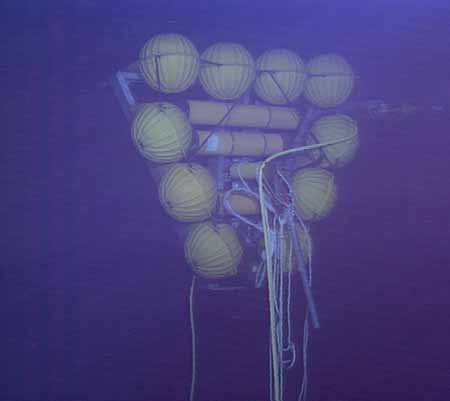
Photo of the previously stuck rumbleometer now released from the seafloor
Photo of the rumbleometer back on deck after it was rescued
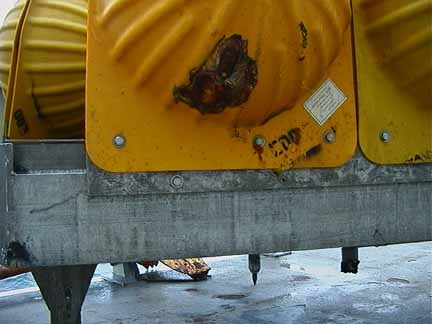
Photo of one of the "hard hats" on the rumbleometer slightly melted
by the lava
Plot of the BPR data from the two rumbleometers
showing subsidence of Axial caldera at the onset of the 1998 eruption
Plot showing a model for vertical and
horizontal movements for Axial
Acoustic Extensometers
[pronounced "x-ten-som-i-ters"]
"Extensometers" are instruments that measure extension - the increase (or decrease) in horizontal distance between two fixed points. To measure distance underwater we use sound. The speed that sound travels in seawater can be precisely calculated if you know the temperature, pressure, and salinity. The extensometers measure distance by carefully recording the travel time of acoustic pulses between pairs of instruments (and the water temperature). If we know the time and the speed, then we can calculate the distance. The travel times are clocked to the nearest 500 nanoseconds (that's 500 billionths of a second!) and the distance of each range measurement can be calculated to less than half a millimeter (0.015 inches)! Of course there are other errors involved so ultimately the distance measurements are good to about 1 cm. The instruments are designed to be deployed in a segmented array, somewhat like a picket fence, with about 100 m between adjacent instruments. The total distance spanned is dependent on the total number of instruments, but is intended to be between 0.5 and 1.5 kilometers (about 1/2 mile). The instruments make one set of distance measurements each day. The extensometers are specifically designed to detect seafloor spreading events across the axis of a mid-ocean ridge, and establish relationships with other oceanographic or geophysical phenomena, such as earthquake swarms, hydrothermal venting, and biological responses. Seafloor extension across the ridge may occur due to faulting or magma intrusion or both.
There are now two versions of the Extensometer instruments, 1) Prototype Extensometers, which were built first, and 2) Benchmark Extensometers, which are new upgraded versions with more capabilities. The Prototype Extensometers were designed and built with funding from NOAA/NURP and can only record for 1-2 years and then have to be physically recovered to get the data back. The Benchmark instruments, funded by NSF/RIDGE, are redesigned to be able to stay down for 5 years or more, and are deployed in separate bases that will remain permanently on the seafloor to facilitate long-term measurements. Data can be retrieved by an ROV (via an infrared data port) without disturbing the instruments. After 5 years the instruments could be taken out of the bases, have their batteries replaced, and then put back in the same bases to continue the measurements.
1) Prototype Extensometers
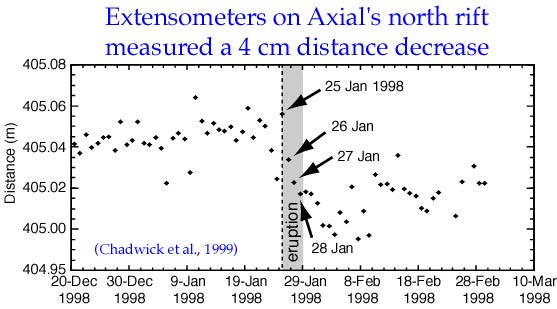
The Prototype Extensometers were in place at Axial volcano at the time of the January 1998 eruption. They were located along the north rift zone (7 km from the center of Axial caldera) and they measured a 4 cm distance decrease, related to the deflation of the volcano summit when the eruption occured and magma was intruded into the south rift zone. When combined with the subsidence measured by 2 BPR instruments deployed in the caldera (see above), the extensometer data can be used to model the depth to the magma reservoir beneath Axial's caldera (3.8 km).
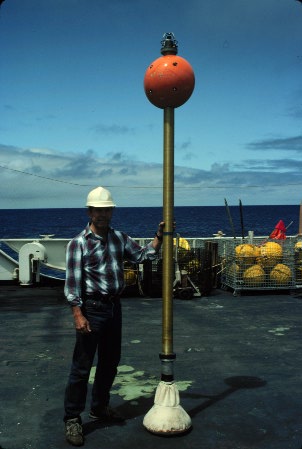
Photo of a Prototype Extensometer instrument on deck ready for deployment
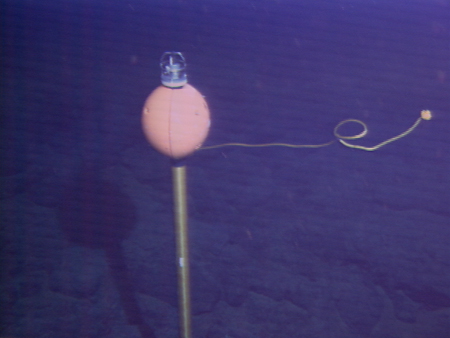
Photo of a prototype instrument deployed
on the seafloor at Axial volcano
Map of Axial summit showing the location of the BPRs ("rumbleometers")
and Extensometers at Axial
Data showing the distance change measured
at the time of the 1998 eruption
Plot showing a model for vertical and
horizontal movements for Axial
2) Benchmark Extensometers
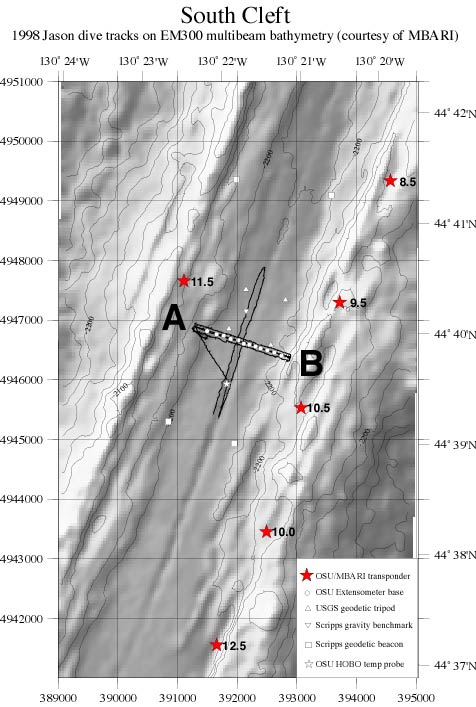
The Benchmark Extensometers look different, but operate in basically same way as the Prototype instruments. An array of Benchmark Extensometer instruments was deployed in July 2000 at the NSF/RIDGE sponsored seafloor observatory on the Cleft segment, on the Juan de Fuca Ridge. Data was recovered from them in July 2001 and showed that no seafloor spreading events had occurred during the first year. The instruments are still at Cleft recording data.
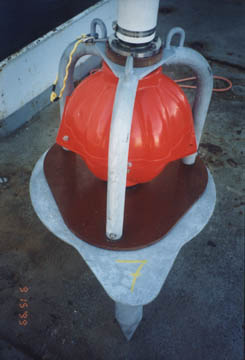
Photo of a Benchmark Extensometer instrument ready for deployment
Photo of a close-up of the instrument
installed in the benchmark base
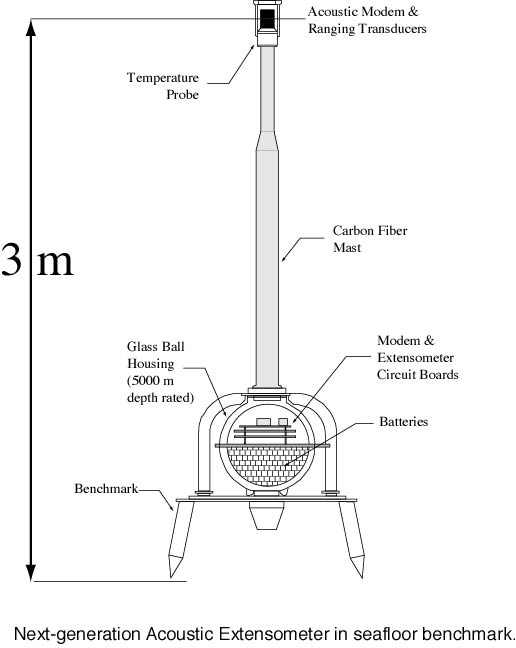
Schematic diagram of a Benchmark Extensometer
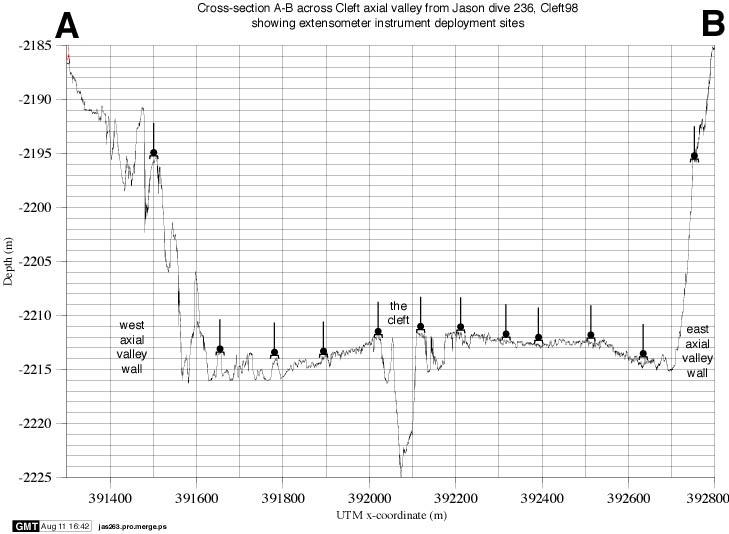
Diagram of how the instruments are
deployed across the Cleft segment
Bathymetric map of the extensometer
deployment site at the Cleft segment