The Warmest January/February in the Arctic
Muyin Wang
JISAO/University of Washington
PMEL/NOAA
The first two months of 2016 set new records in the Arctic, with the warmest January and February on record, and the lowest sea ice cover in February. The area-averaged temperature anomaly (between 66°N and 90°N) has reached a record of 5.8°C (10.4°F) for January and 4.56°C (8.2°F) for February (Figure 1)—the warmest period in the Arctic for these two consecutive months since 1948, based on the National Centers for Environmental Prediction (NCEP) and National Center for Atmospheric Research (NCAR) reanalysis products (NNR-v1). According to the National Snow and Ice Data Center (NSIDC), the Arctic sea ice extent for February 2016 averaged 14.2 million square kilometers, the lowest February extent in the satellite record (the 1981-2010 long-term average is 15.4 million km2). This new record is 0.2 million km2 lower than the previous record low for the month, recorded in 2005.
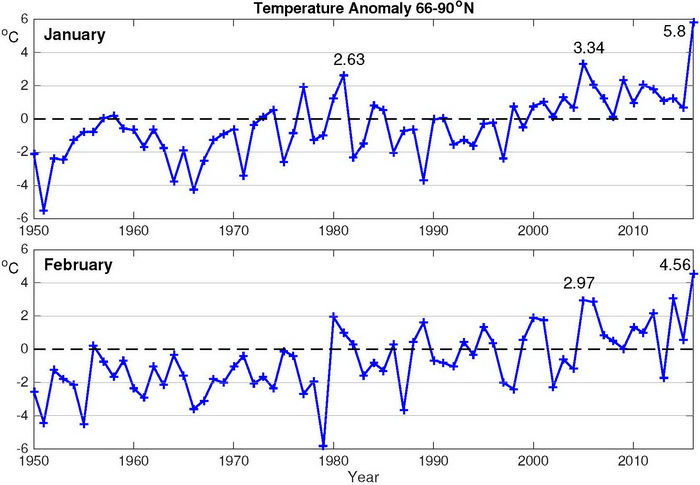
Once we put this past January and February into historical perspective, we can see that this unusual warmth is unprecedented in both months. The domain-averaged Arctic surface air temperature has experienced large interannual variability, and since the year 2000, it has stayed on the positive side for the month of January: an unprecedented 17 consecutive years. The standard deviation for the 1981-2010 January temperature anomaly is 1.6°C, so this new positive temperature anomaly represents 3.6 times the normal variability. February continues this warm trend, with a 4.56°C temperature anomaly averaged over the Arctic domain, which is 3 times the standard deviation of 1.52°C for the month. One explanation of this unusual Arctic warmth is the response of the Arctic to the global warming background. In both January and February, the global mean surface air temperature also set two new records, at 0.7 and 0.8°C, respectively.
This unprecedented warmth is mainly due to the large positive temperature anomalies in the Arctic Ocean and over the North American continents, as shown in Figure 2. It is generally agreed that Arctic sea ice cover has been on a declining trend, with more (and thinner) first-year ice dominating the coverage of the central Arctic Ocean. As we know, the Arctic Ocean is covered by sea ice each winter for several months. This layer of sea ice plays a role as a "blanket" to the Arctic Ocean, which limits the ocean heat release back to the atmosphere. Yet there are leads between the sea ice that allow ocean heat release back to the atmosphere. Additionally, compared to thicker sea ice, thinner sea ice allows more heat from the ocean to penetrate the ice layer. This large January and February air temperature anomaly offers more evidence that the Arctic sea ice is most likely thinner than before, on top of the circulation changes.
The unusual warmth covers almost the entire Arctic Ocean, with two big anomaly centers: one is located at the Canada Basin, and the other is located to the north of Franz Josef Land between the Kara and Laptev seas, extending to the North Barents Sea and east of Svalbard. Both centers have more than a 10°C temperature anomaly. Nearly the entire North American continent reaches a 4°C positive temperature anomaly, with the warm January of Alaska surpassing other regions, reaching a temperature anomaly of 8-10°C for the January mean over most of the region. This warm air also covers much of the Bering Sea, resulting in ice-free conditions throughout most of the southern Bering shelf.
At the end of the January 2016, the 28°F daily high temperature in Fairbanks deviated sharply from the normal daily high of -20°F (Professor John Walsh, personal communication). These high temperatures were also accompanied by unusually dry weather. Snow cover observed on the ground at this time had fallen in November 2015. Although local residents welcome the unusual warmth, without a true winter storm to date, what this might mean to our climate system—not only over the Arctic, but globally—is a source of concern for climate scientists.
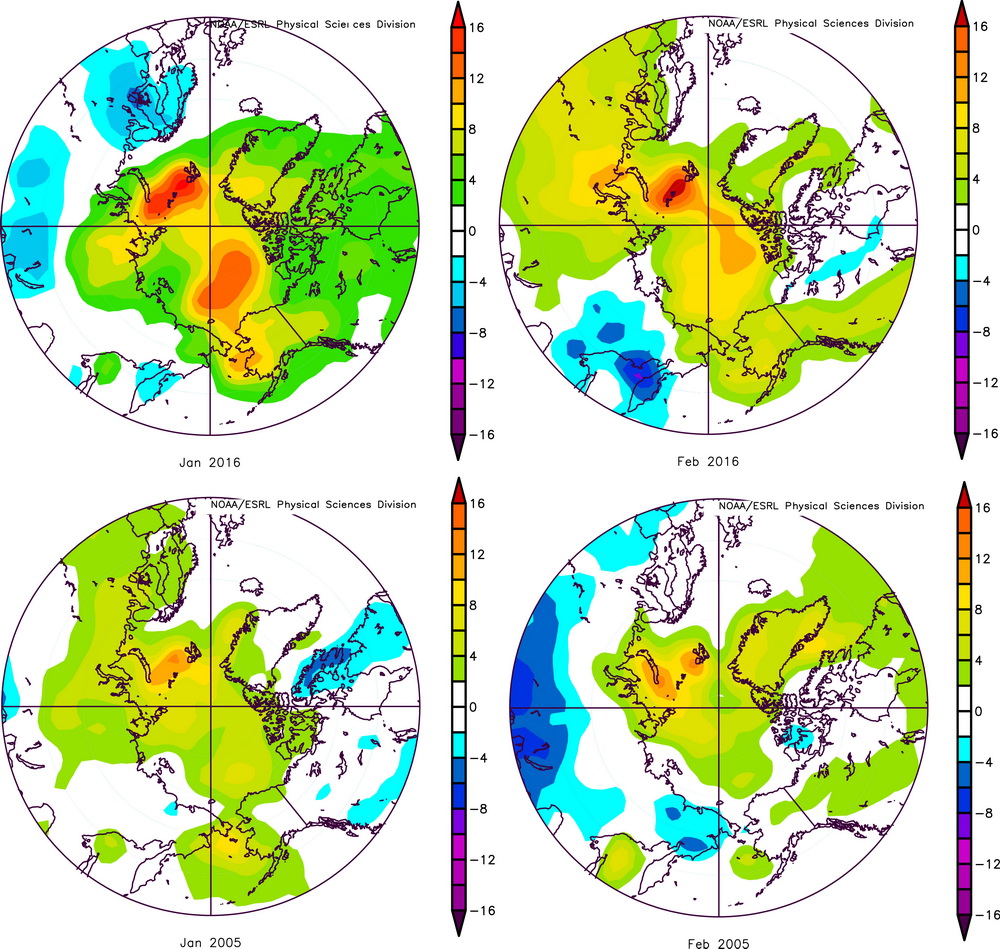
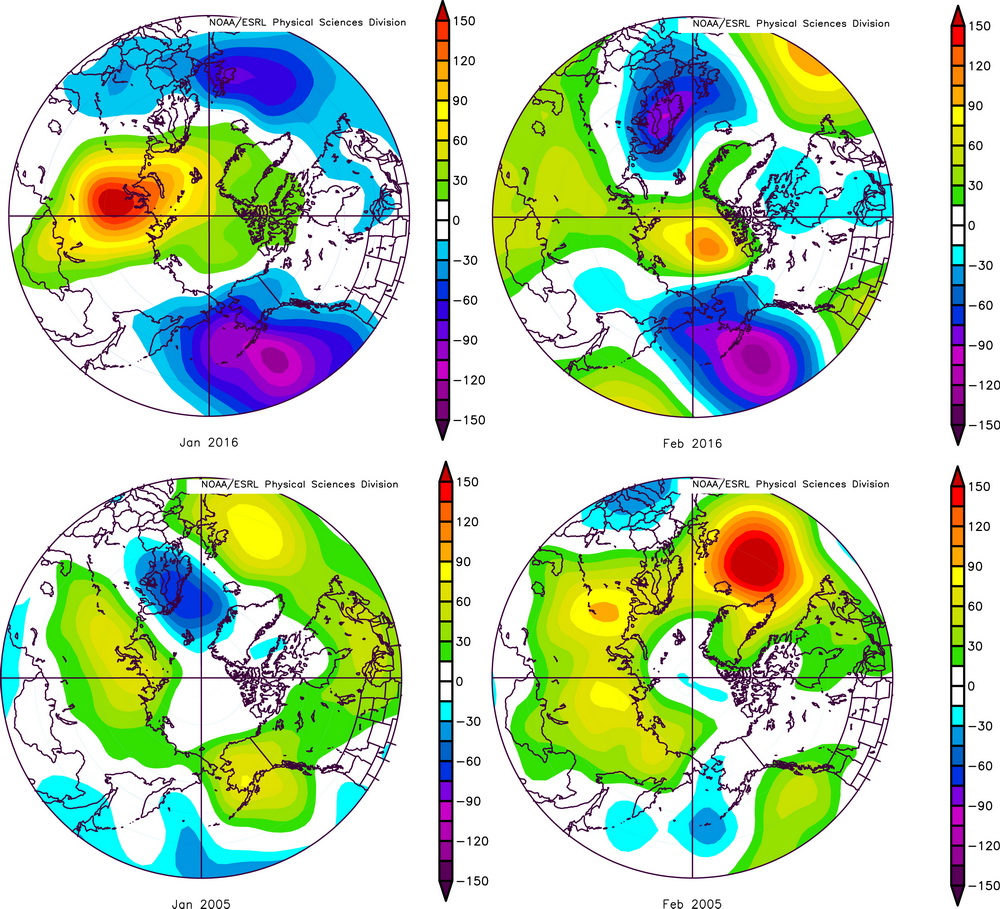
Over the past 67 years (1950-2016), the second largest temperature anomaly observed for both January and February was in 2005. Coincidentally, the previous low February sea ice cover record was set in 2005. The bottom panels in Figure 2 show the spatial pattern of the January/February 2005 temperature anomaly based on NNR. The general magnitude of the January anomaly is much smaller in 2005 (bottom left panel) than in 2016 (top left panel). Most of North America experienced normal conditions, with no obvious positive or negative anomalies. The positive temperature anomalies occurred mainly over the ocean, in the central Arctic as well as the Bering Sea for January 2005. One common feature between 2005 and 2016 cases is the positive temperature anomaly center, located to the north of Franz Josef Land and east of Svalbard. In 2016 the magnitude of this January anomaly is at about 16°C, but in 2005 it was about 10°C. The magnitude of the temperature anomaly in February 2016 was smaller than that of January 2016, but the area of the positive anomalies was extended broadly. This is quite different from the 2005 case. In 2005, the positive temperature anomalies were moved around from northern Russia to the east of Greenland and Baffin Bay. The atmospheric circulation patterns are quite different (Figure 3), especially over the Pacific sector, between these two years. The January flow pattern near the surface at 925 hPa is dominated by two low centers: the Aleutian Low and the Icelandic Low. In January 2016, the Aleutian Low center was extremely strong, and the low center shifted to the east into the Gulf of Alaska (Figure 3, top left). The Icelandic Low was stronger than normal, resulting in a negative anomaly center in that region. What really stands out is the anomalously high geopotential height center in the middle of Eurasia continents. In January 2005 (Figure 3, bottom), the Aleutian Low was much weaker and centered more southward. The high geopotential height anomaly center over Eurasia has some similarity between the two years, but 2016 had a large magnitude and extended into the center of the Arctic Ocean. February 2016 continues this anomalous pattern with little variation (Figure 3, top right). Currently, the anomalous high center has moved into the center of the Arctic Ocean with reduced magnitude. The Icelandic Low anomalous center moved northeastward, allowing warm temperatures from lower latitudes directly into the Barents Sea. This was not the case in 2005, when the anomalous geopotential height pattern showed positive anomalies over much of the Arctic domain, and rather different patterns between January and February. This illustrates that different flow patterns contributed to the unusual warmth in the Arctic in these two years.
Ever since very low sea ice cover was observed in September 2007, bringing to the foreground an awareness of Arctic changes, we have witnessed a number of surprising events, one after the other. This year's record high temperature and low sea ice cover invite a number of questions, such as: What can we expect next? How long will this warm temperature record last? How soon will we see another record being set?