|
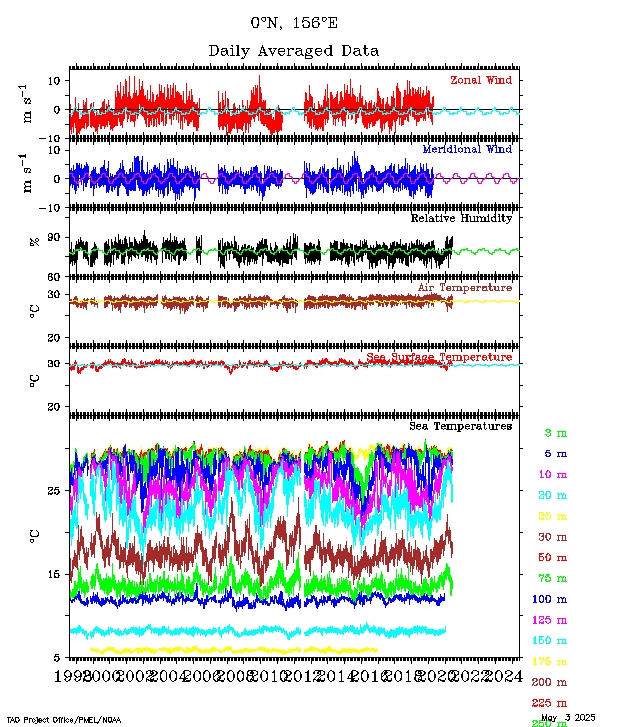
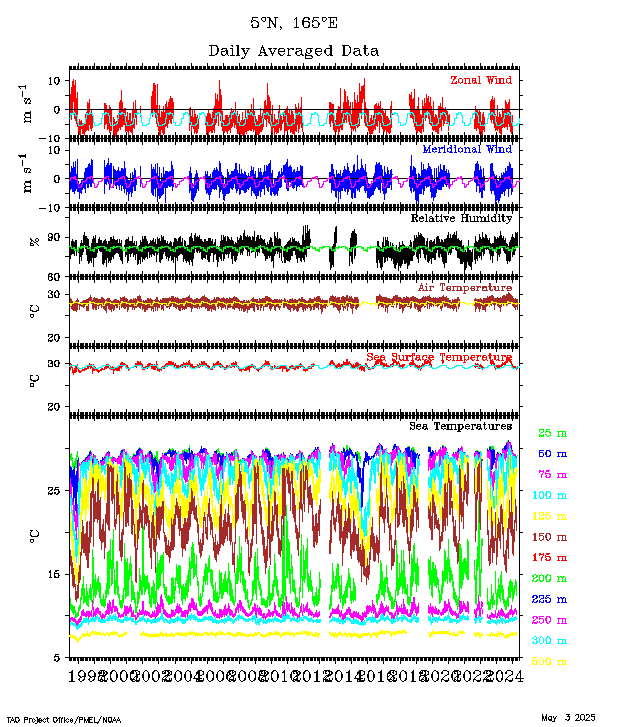
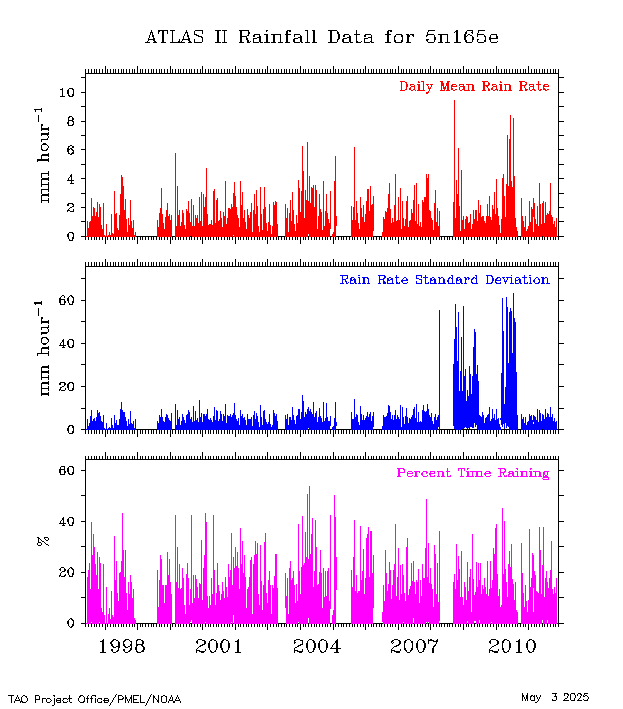
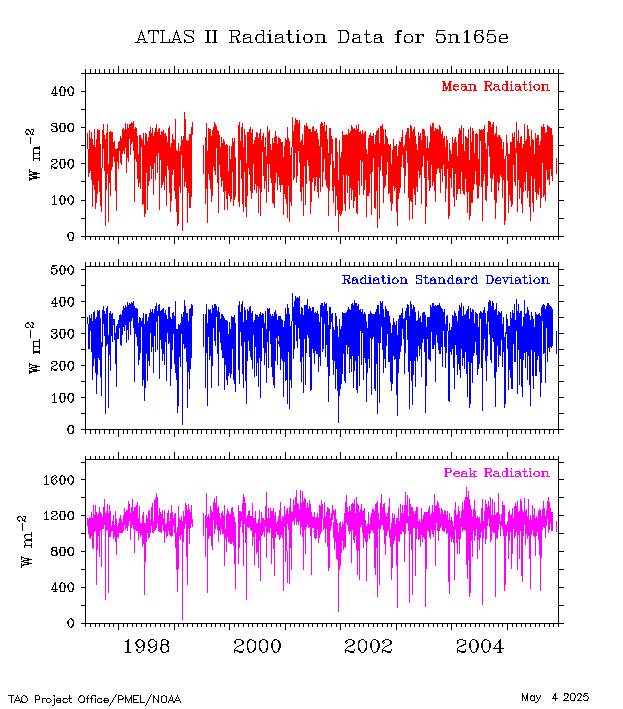
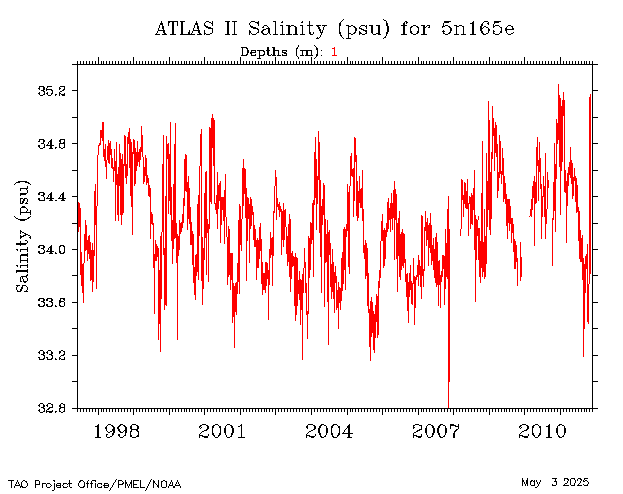
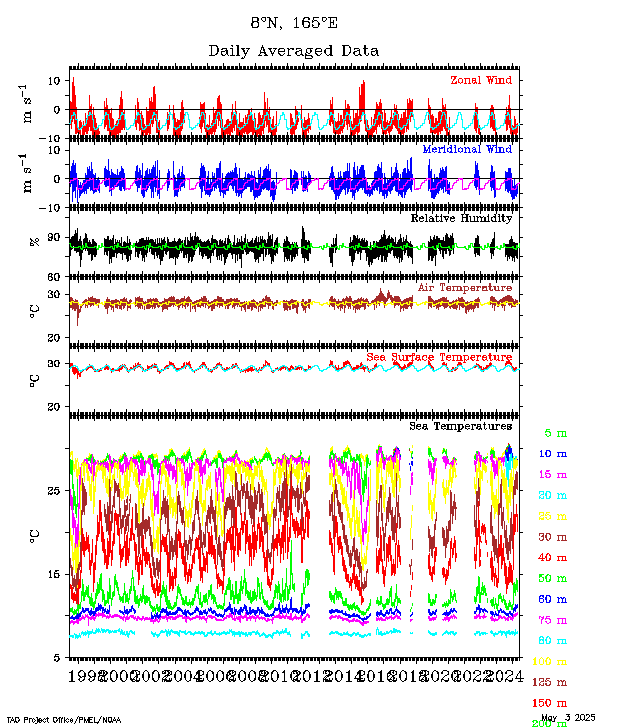
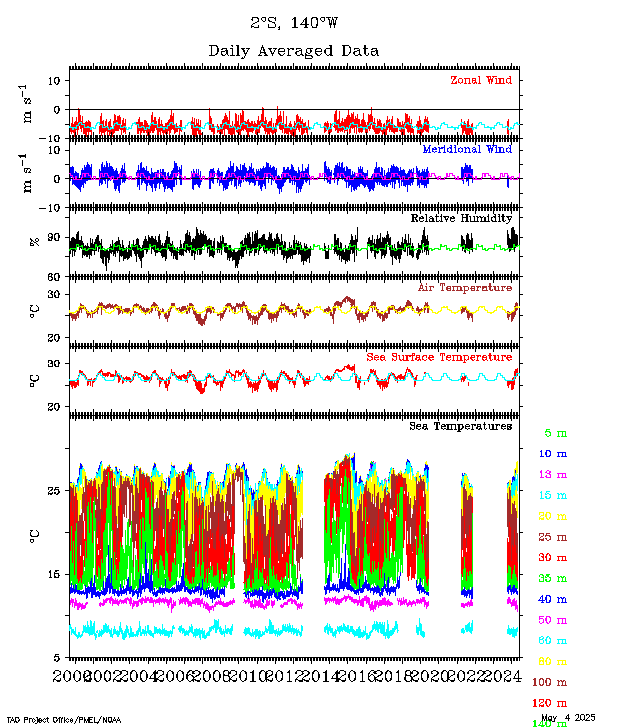
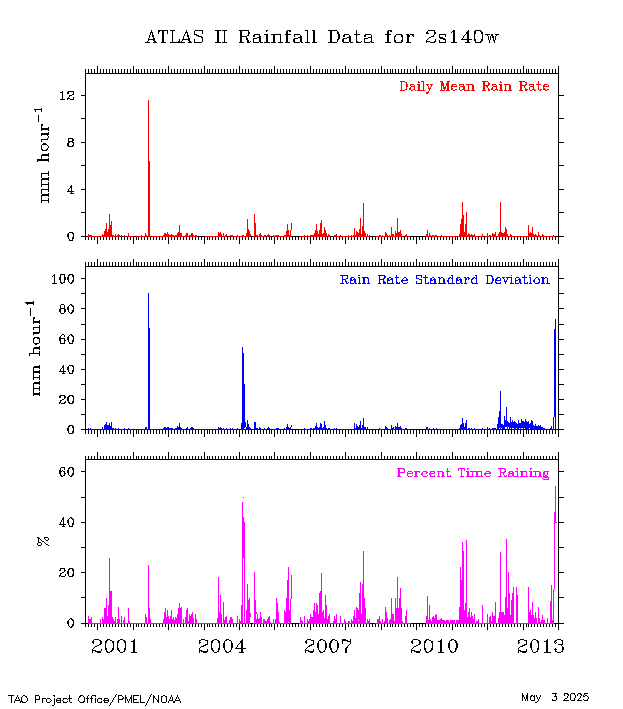
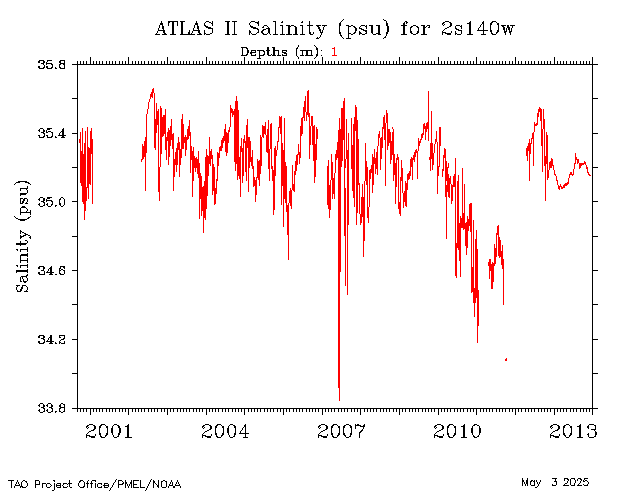
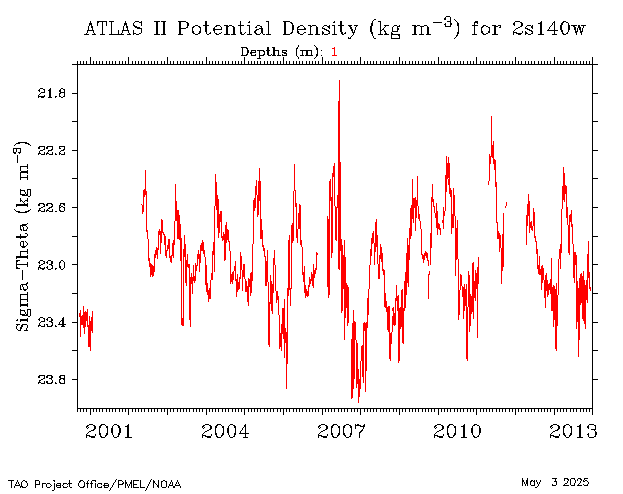
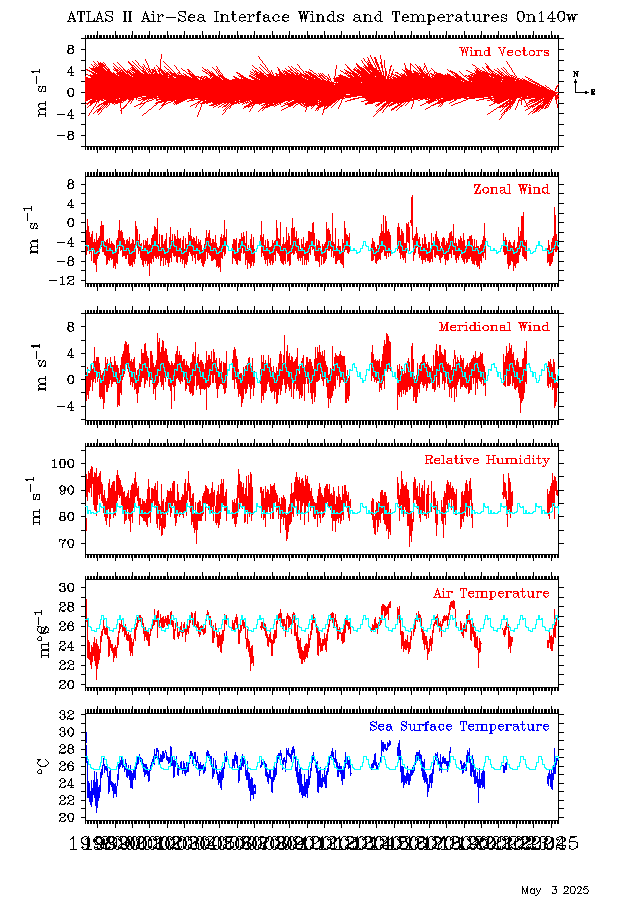
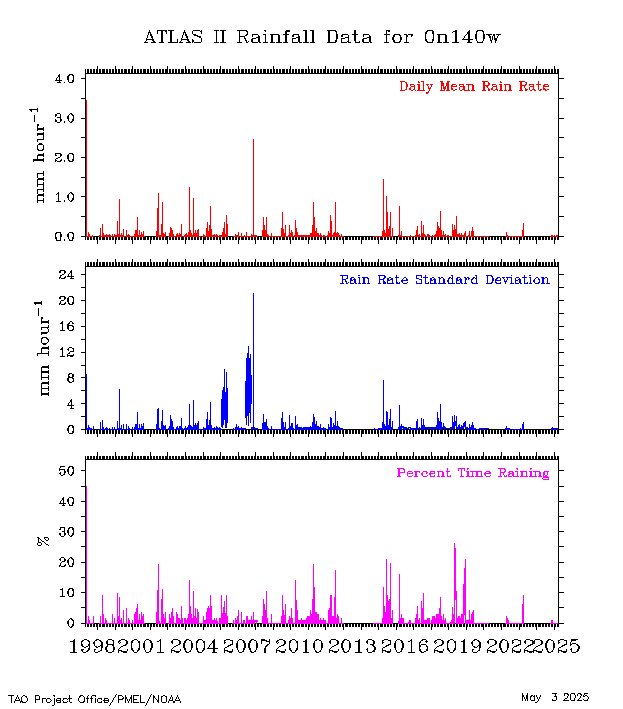
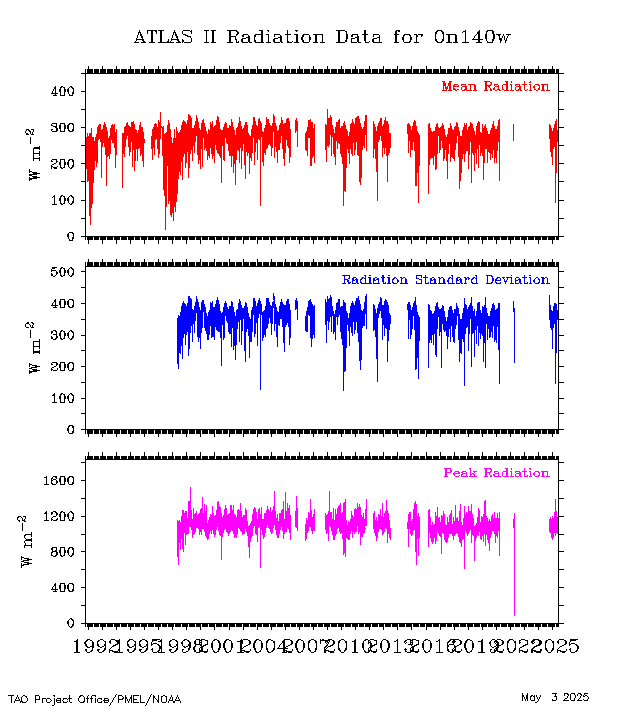
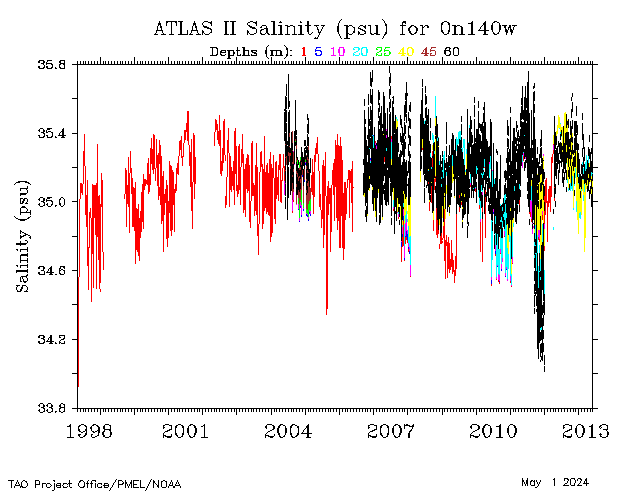
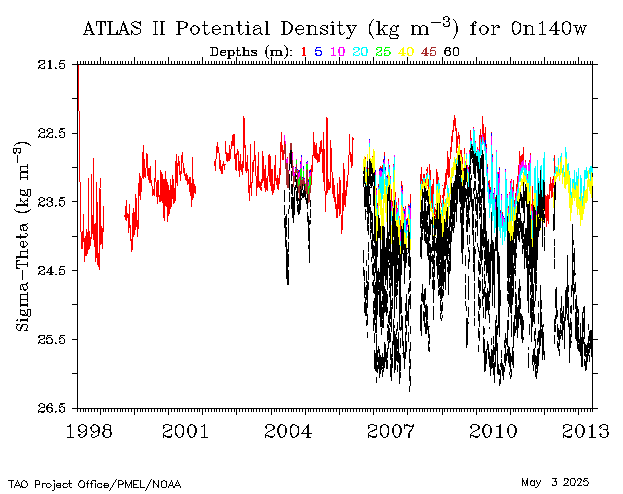
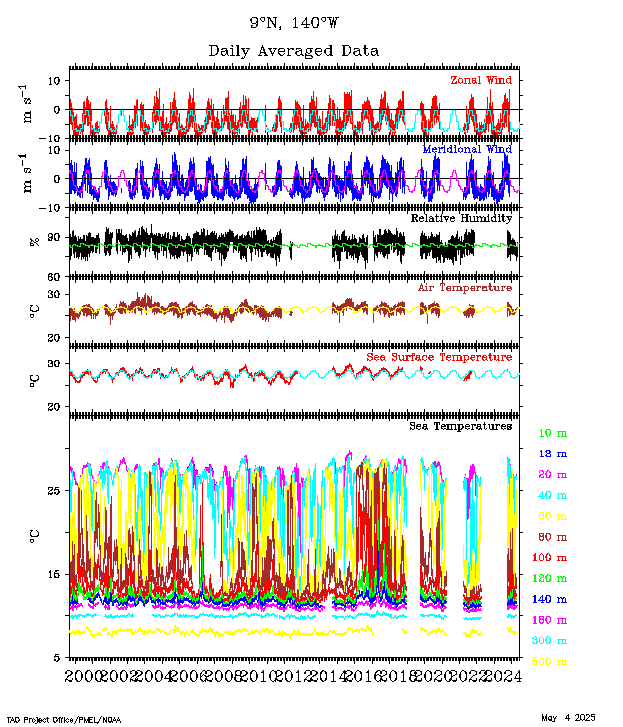
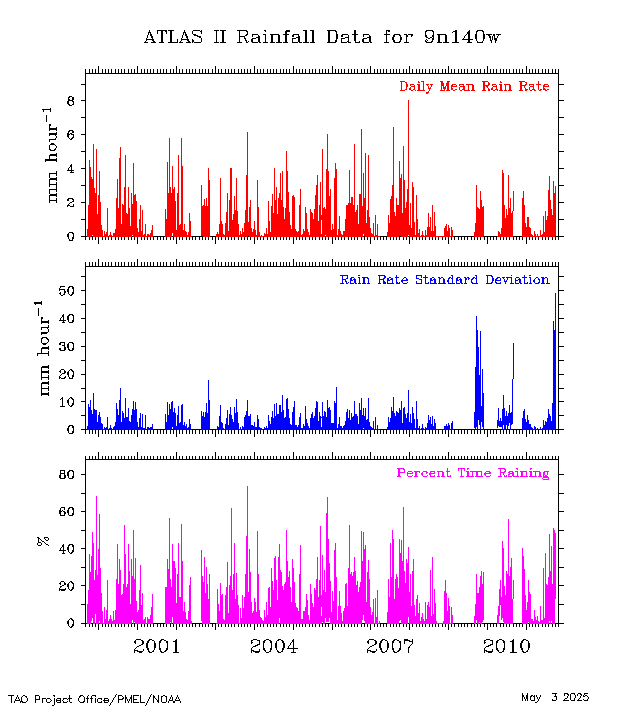
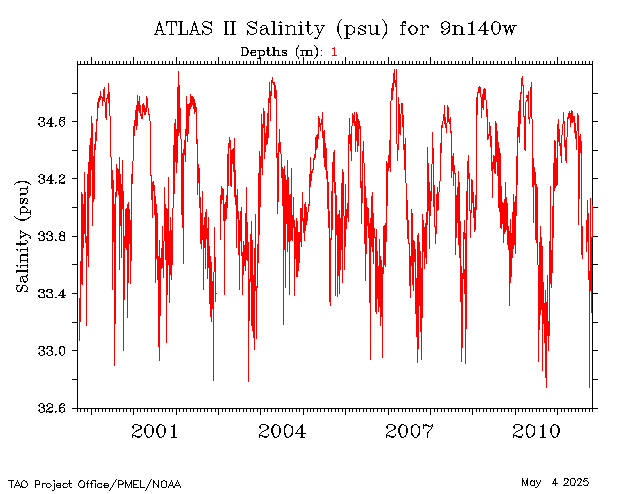
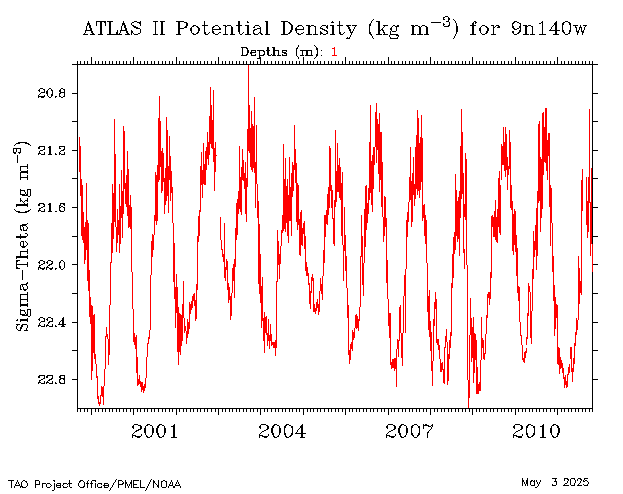
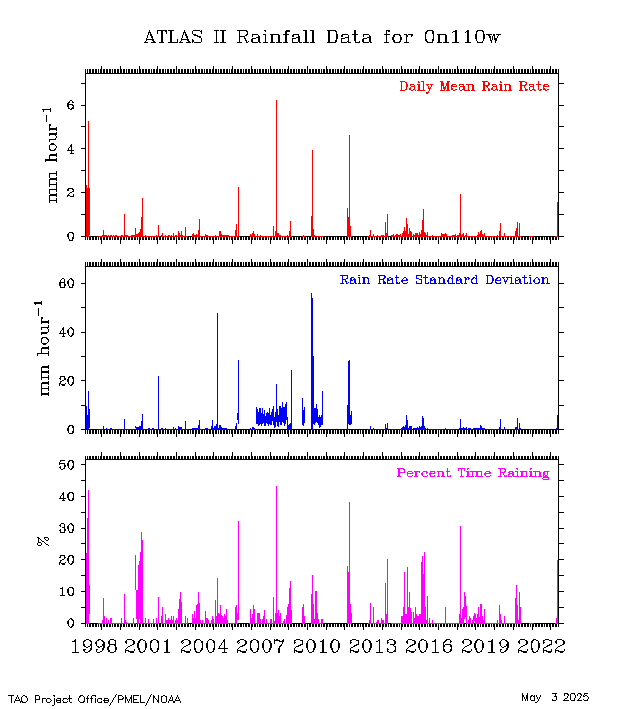
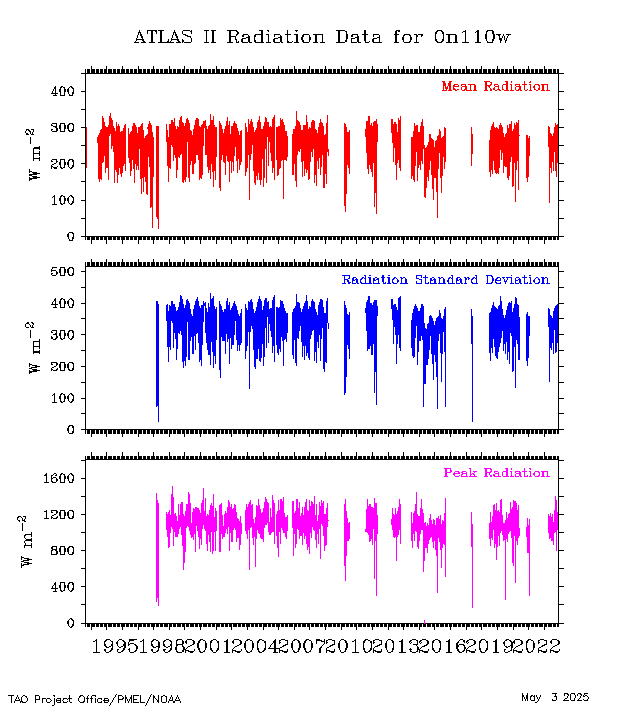
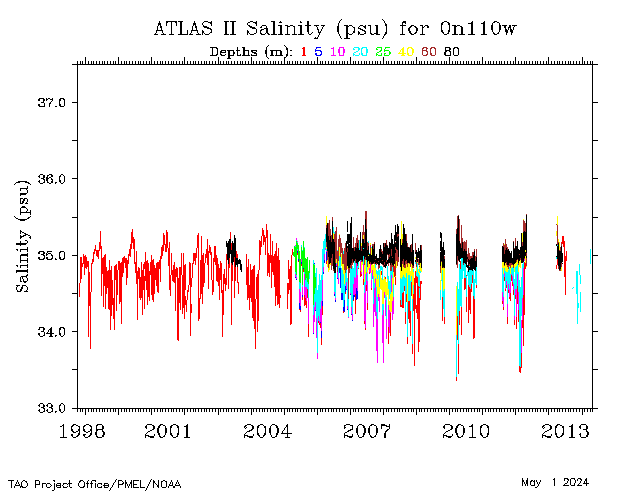
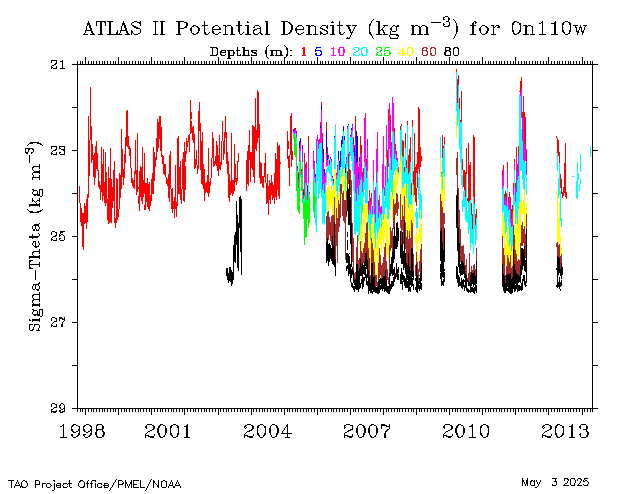
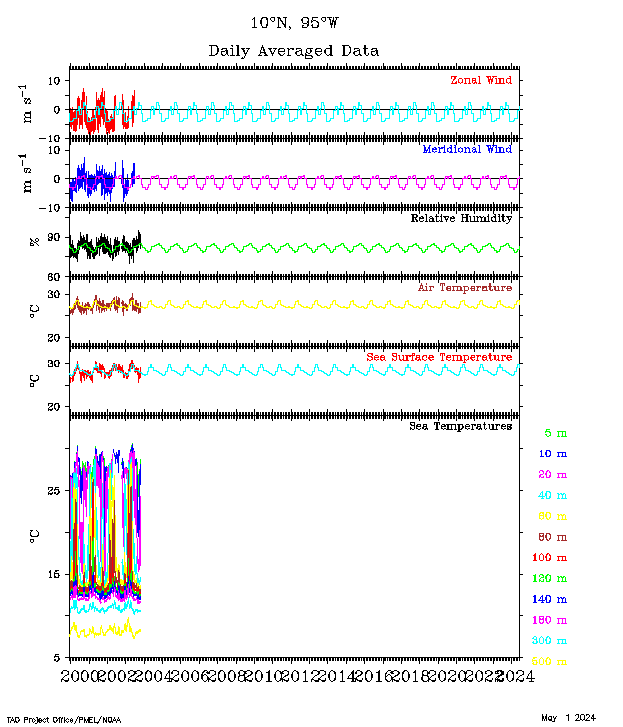
These data are received daily via satellite from ATLAS buoys.
Daily averages are plotted below, and can be downloaded from the
TAO/TRITON Data Delivery Page.
|
|
Back to
TAO Enhanced Sensor Display
|
|
Buoy Plot |
Sensor Plot |
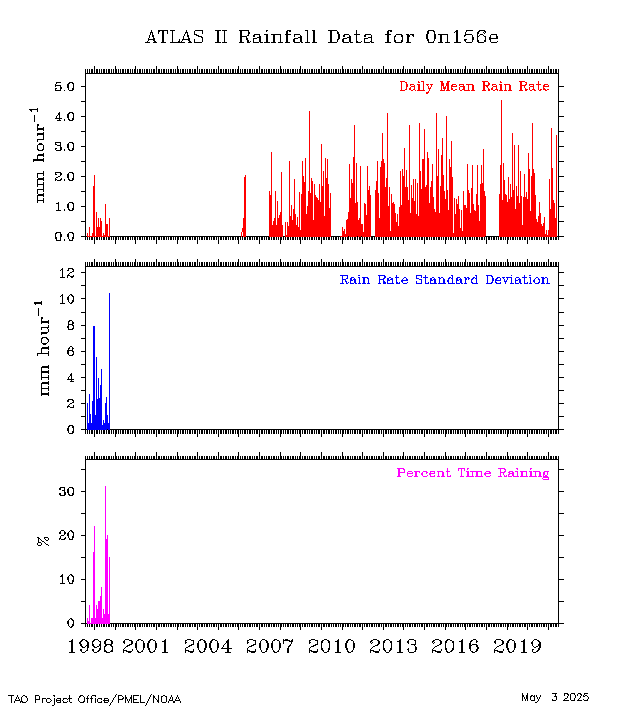
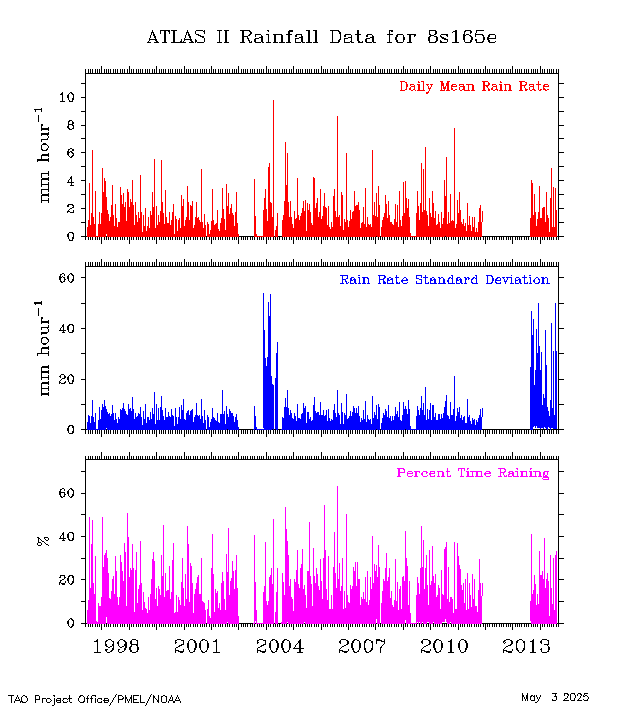
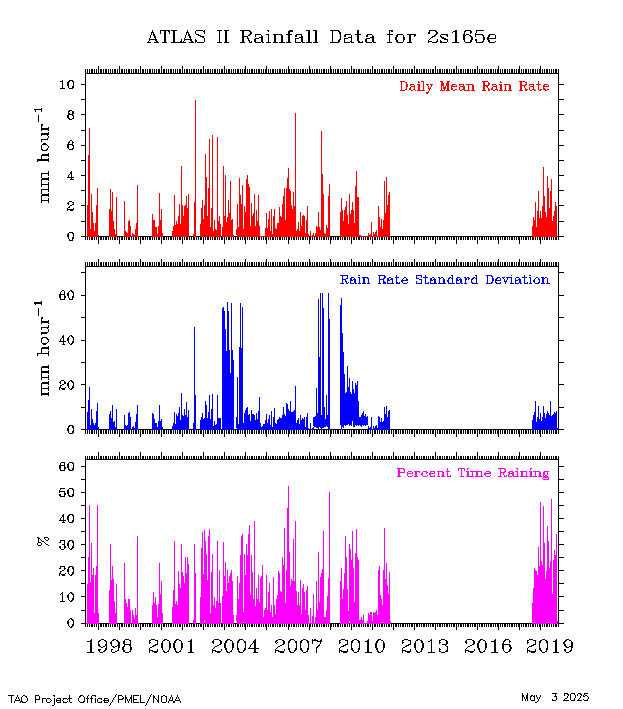
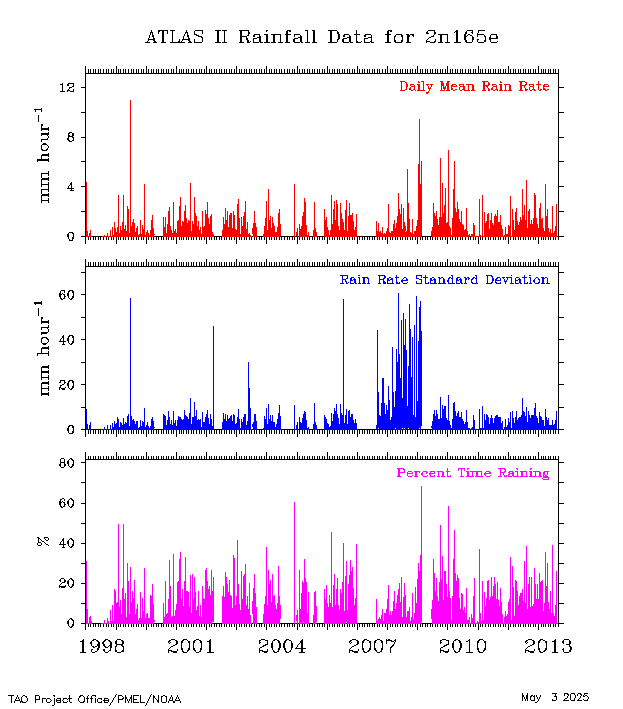
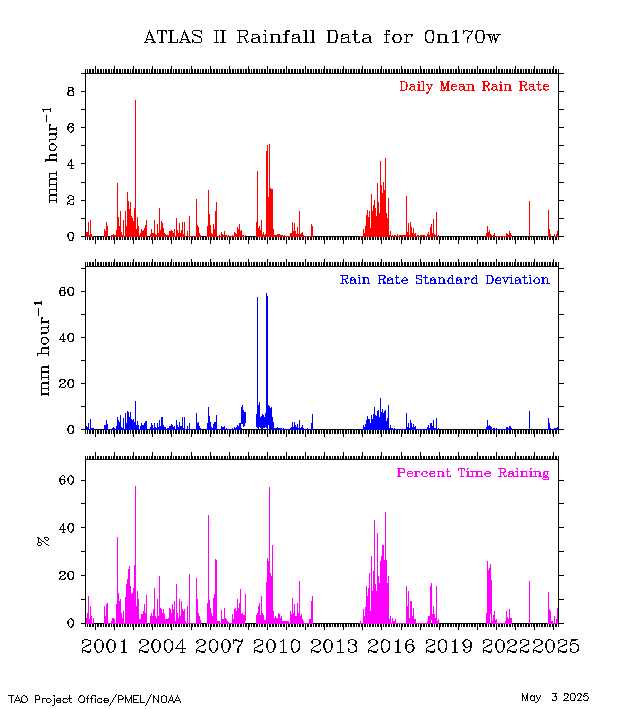
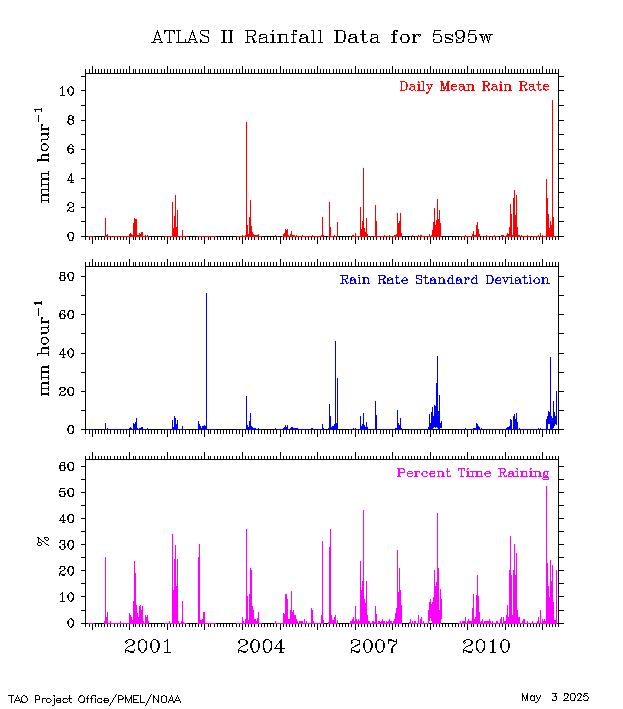
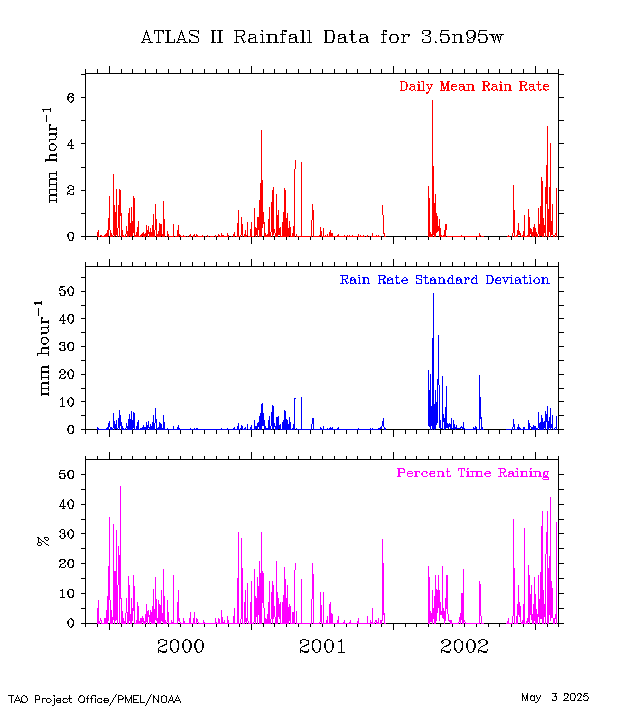
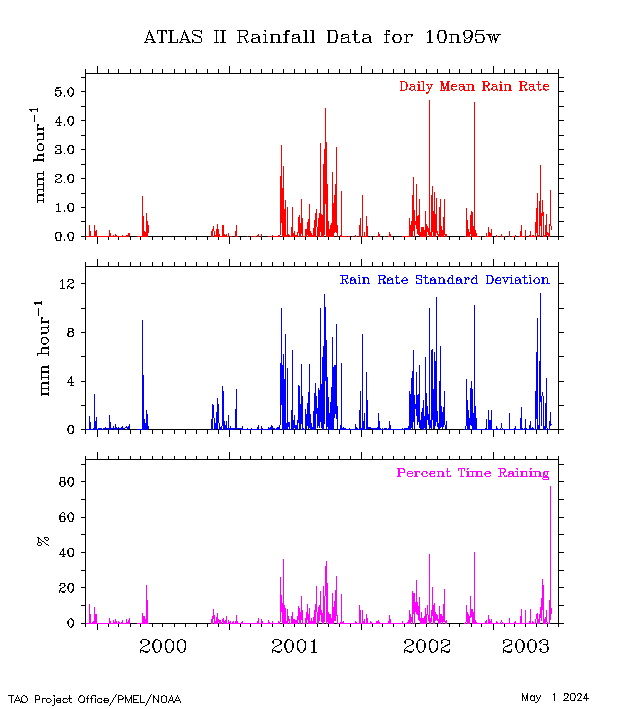
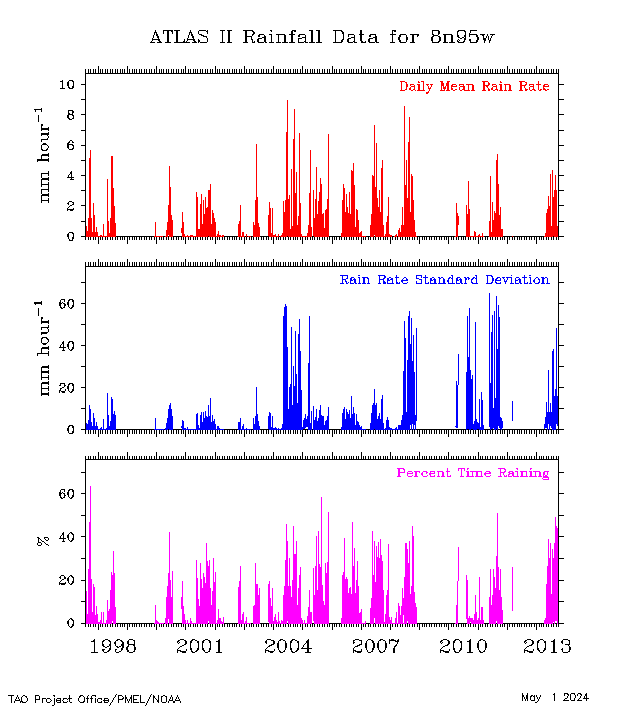
Rainfall |
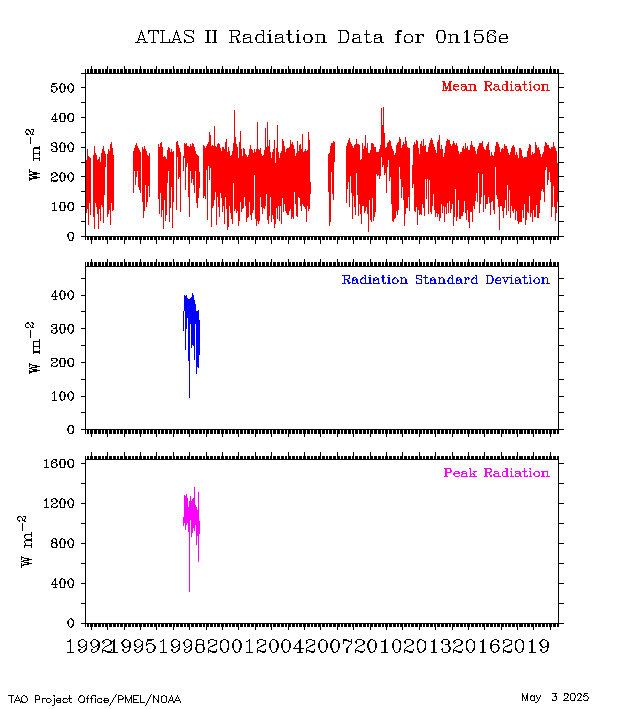
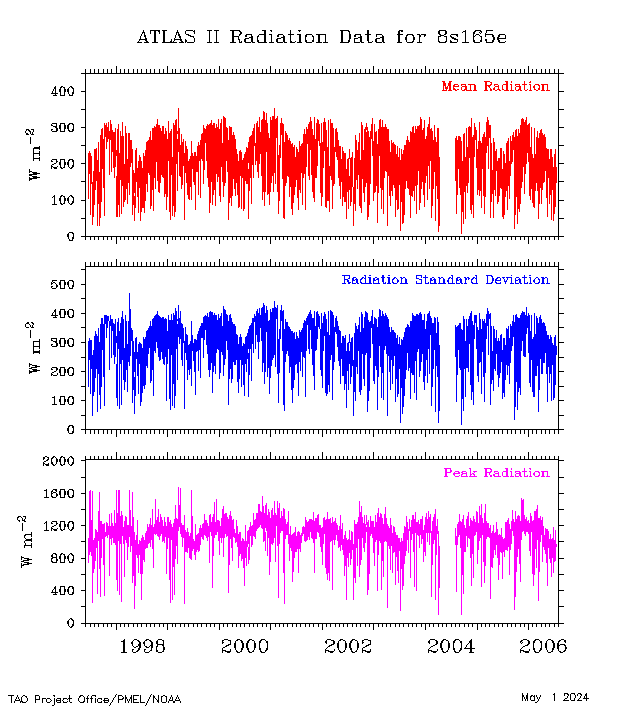
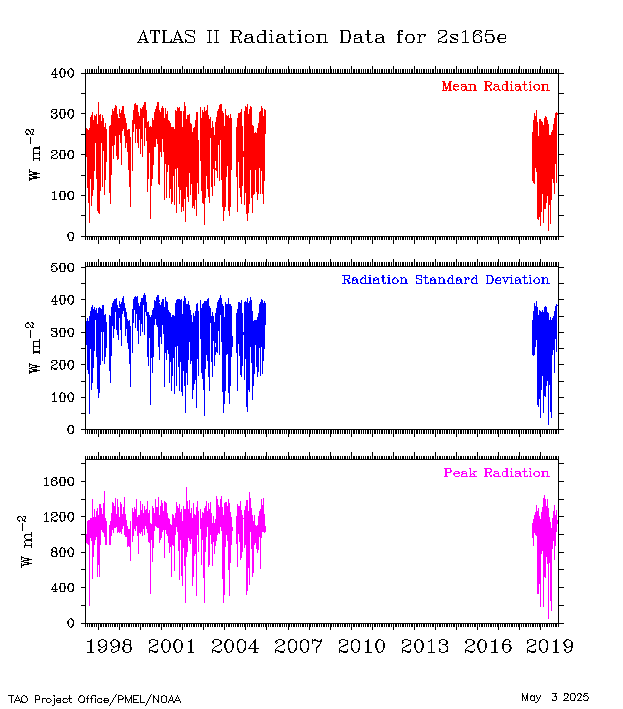
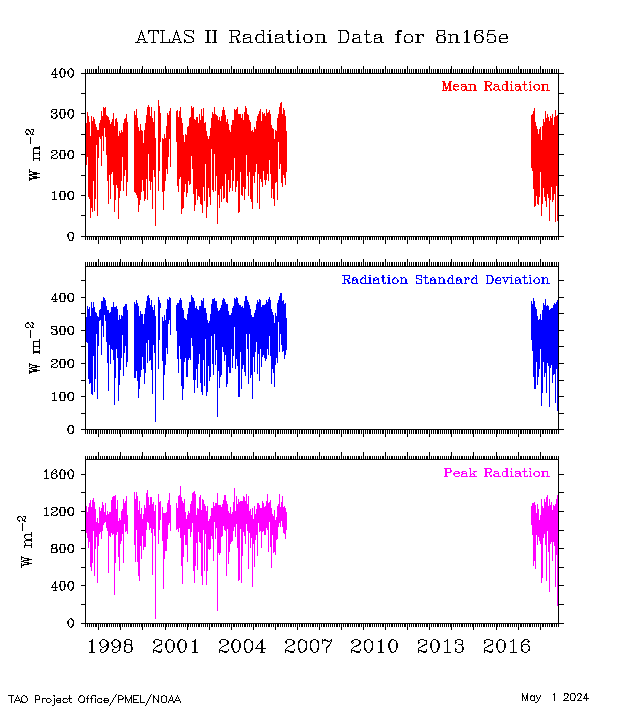
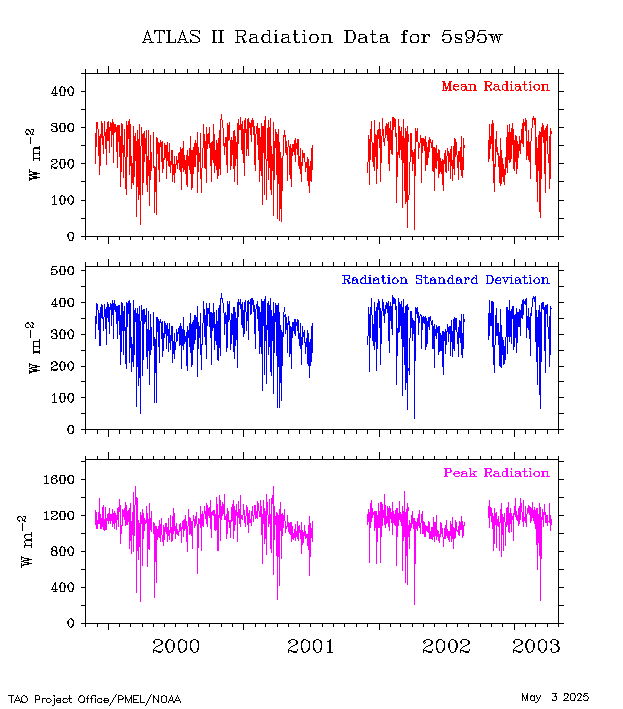
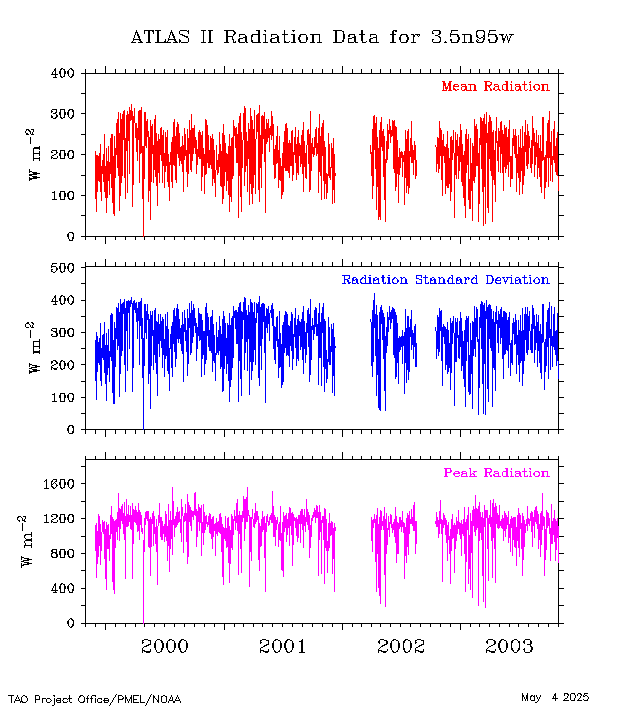
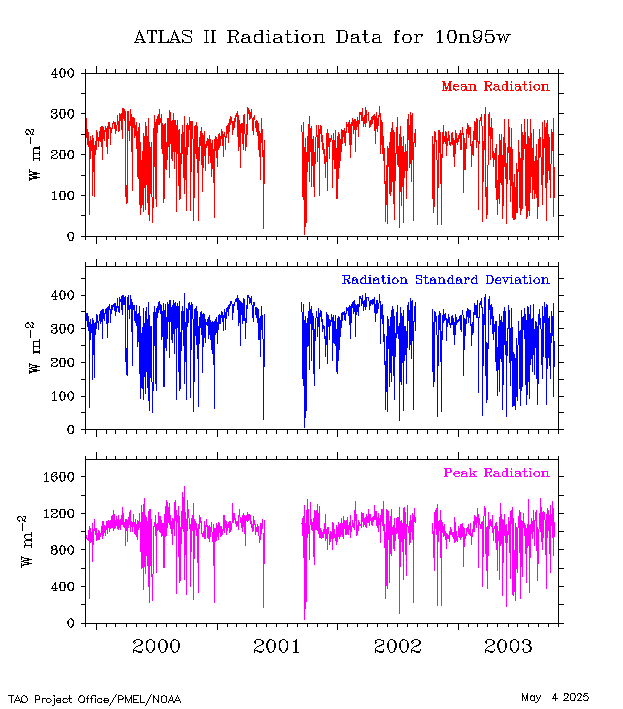
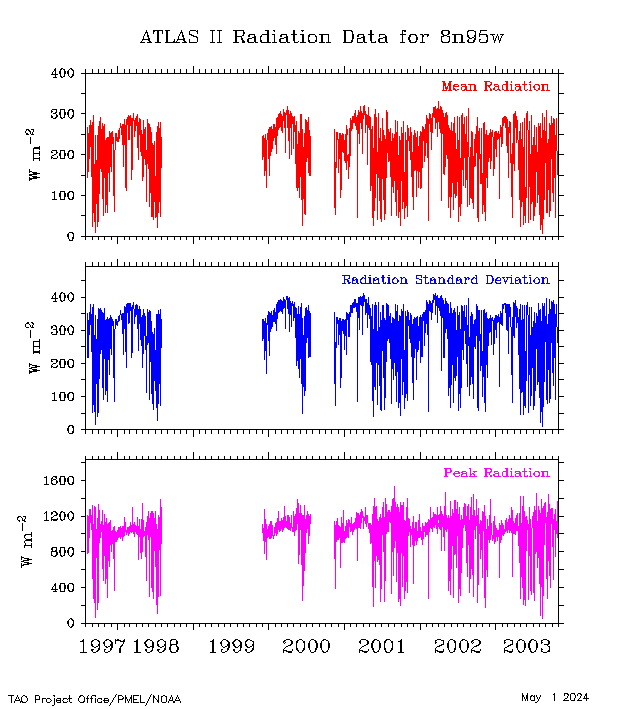
Shortwave
Radiation |
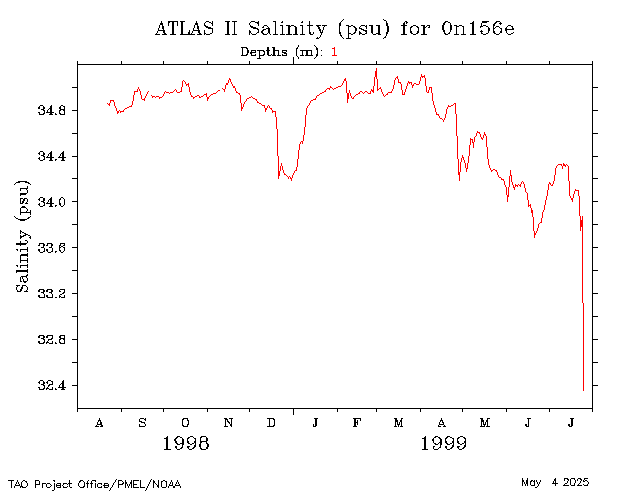
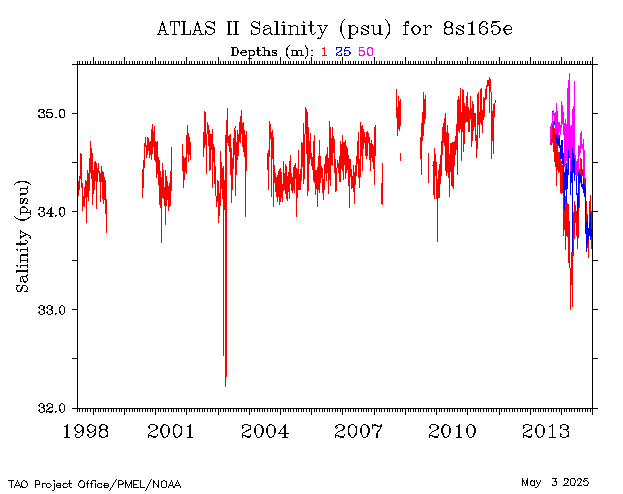
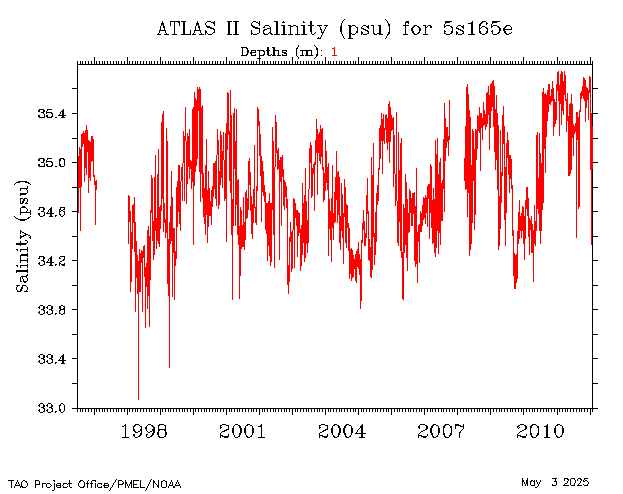
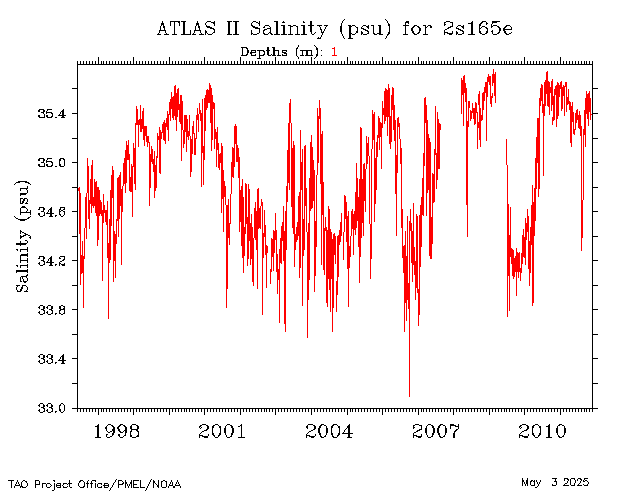
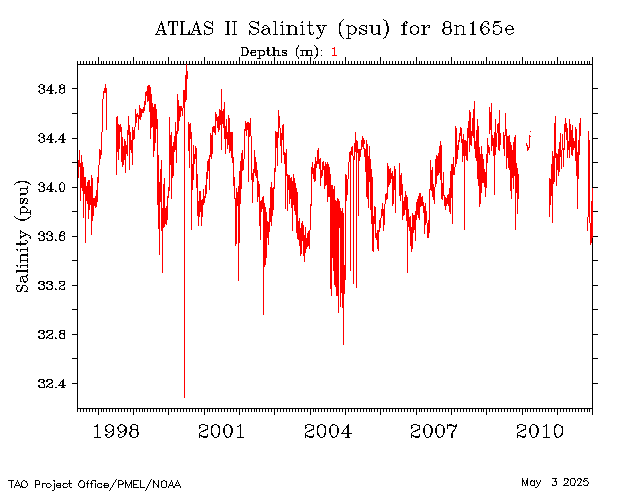
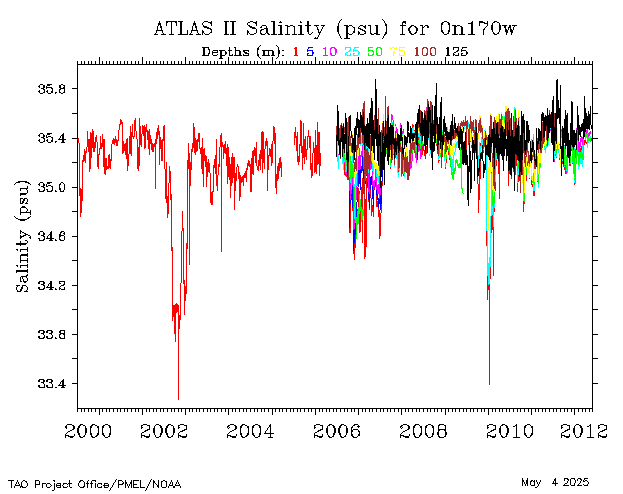
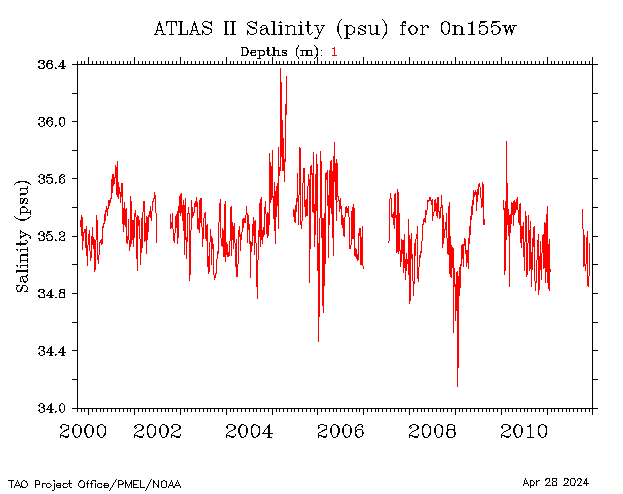
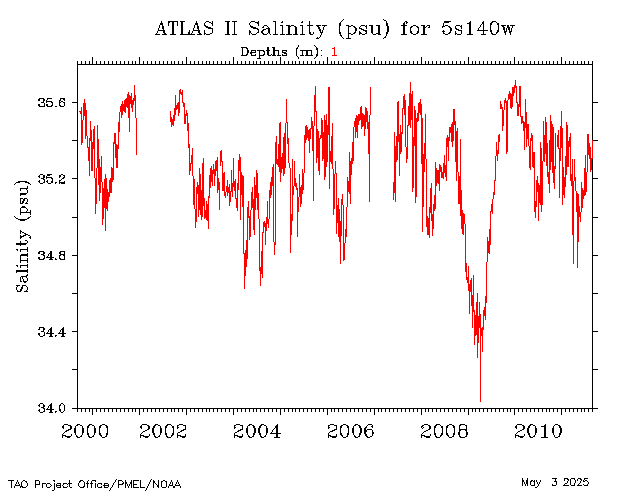
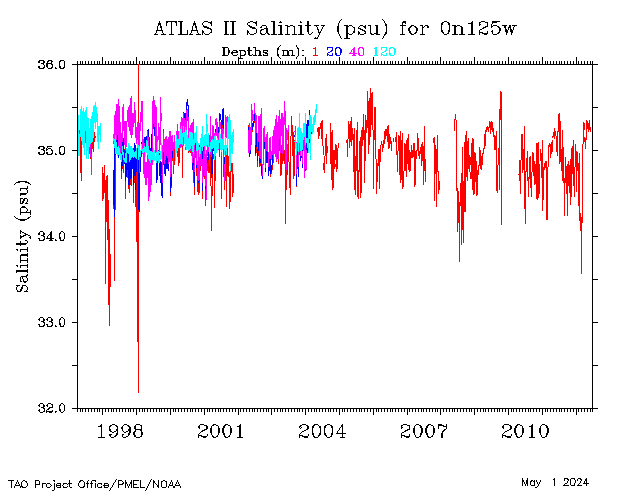
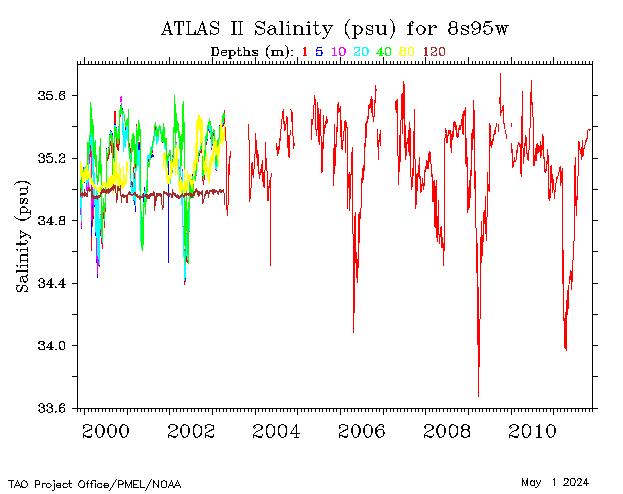
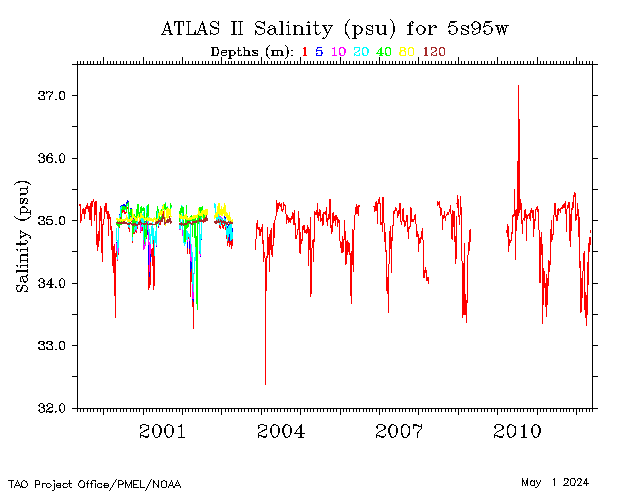
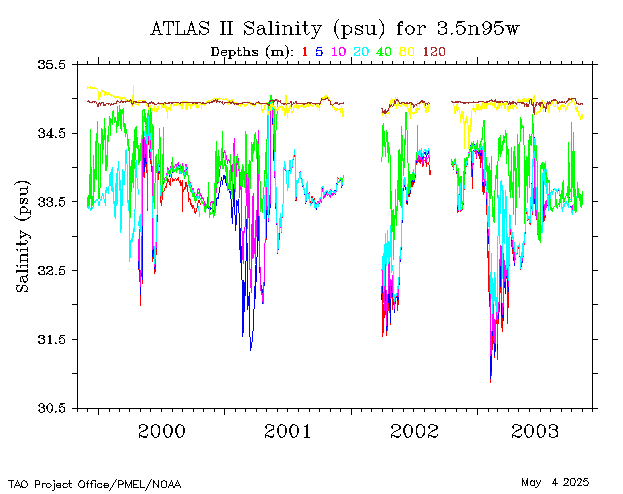
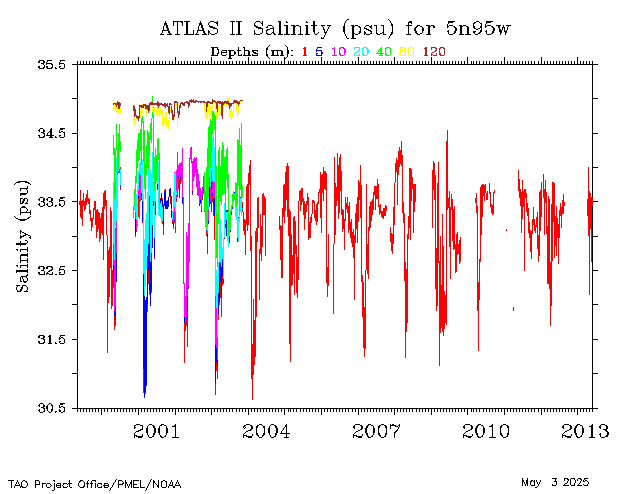
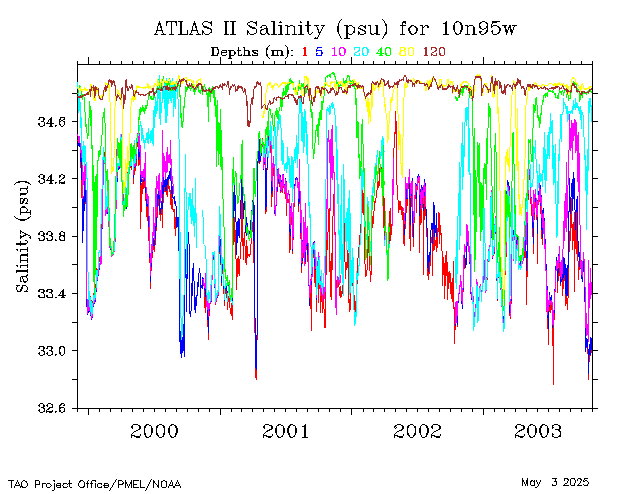
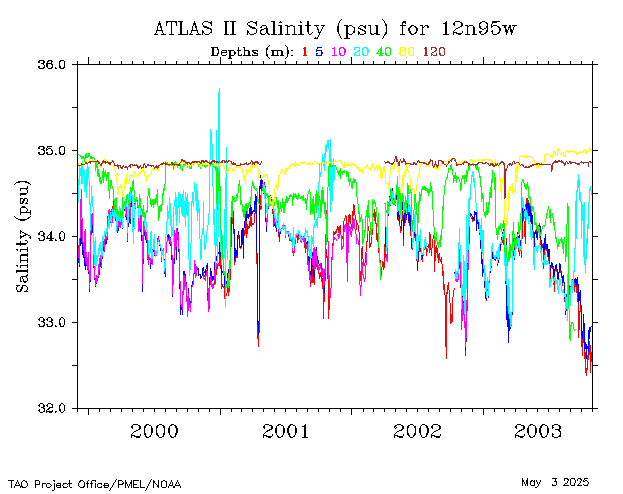
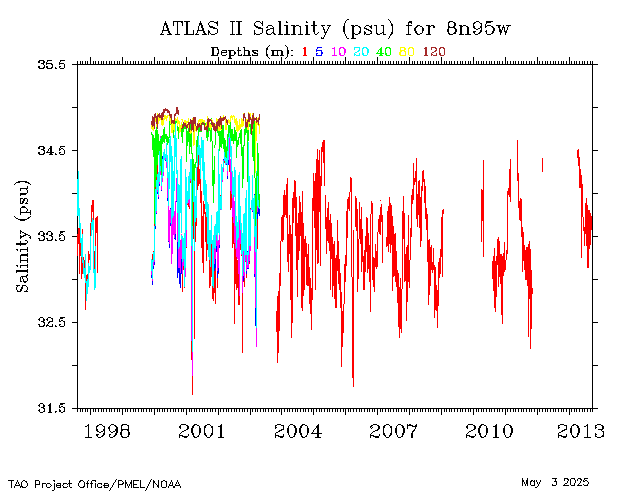
Salinity |
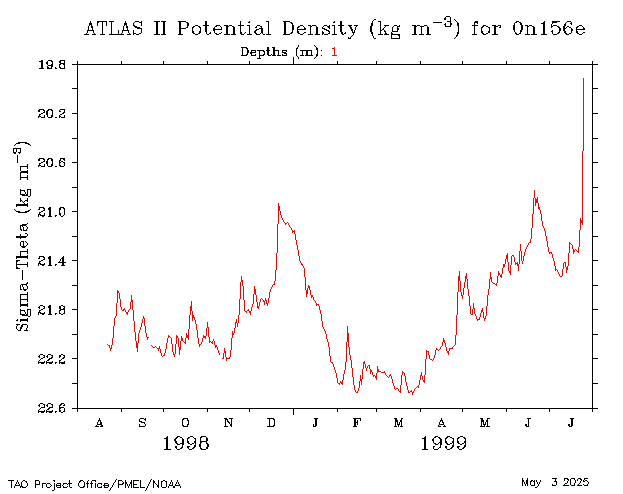
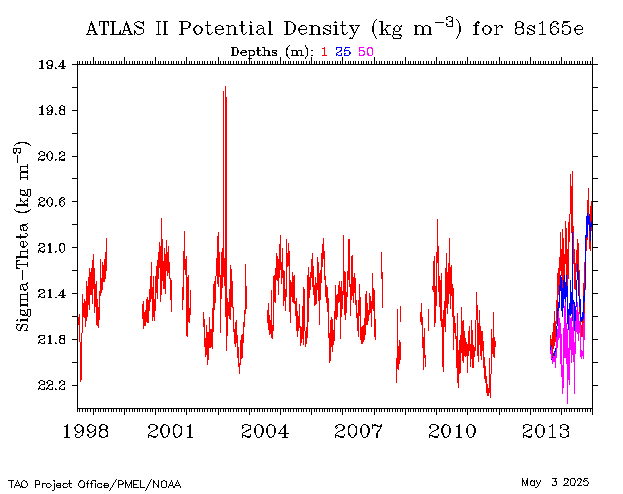
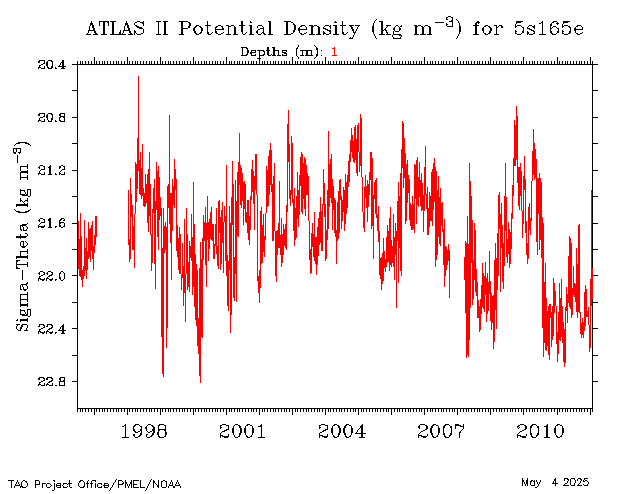
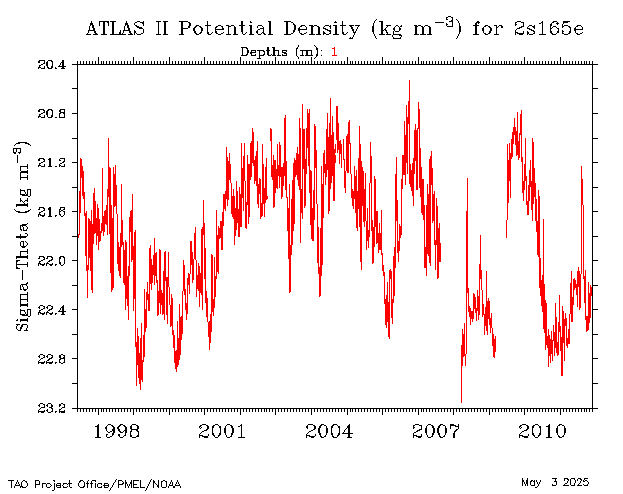
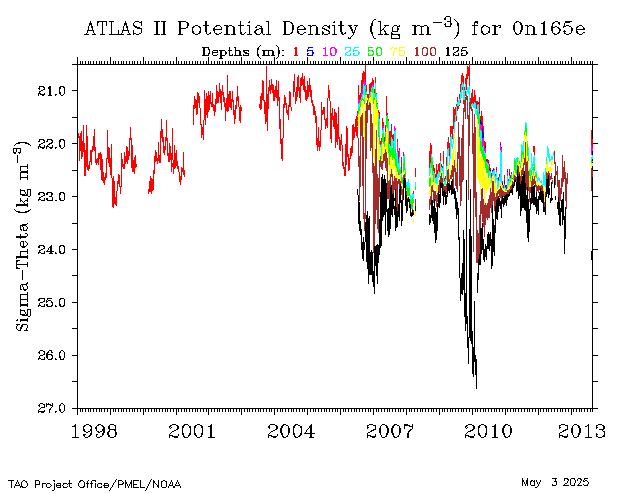
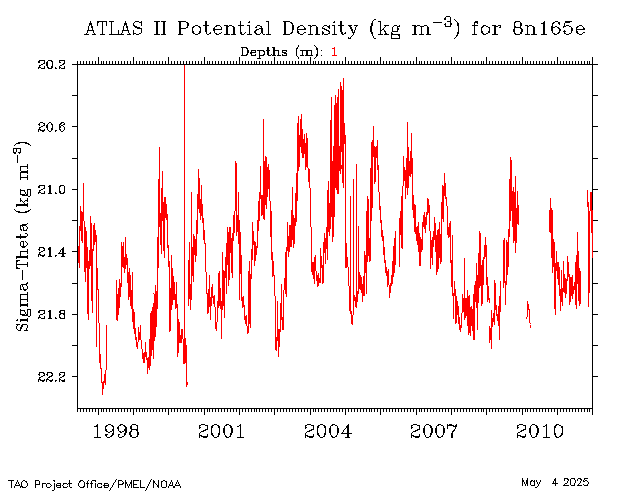
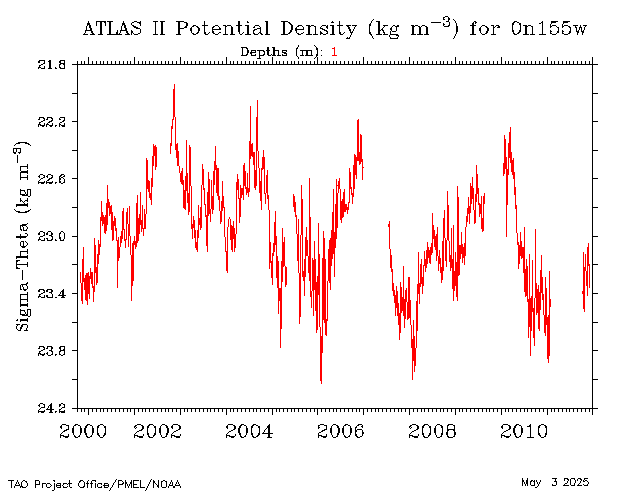
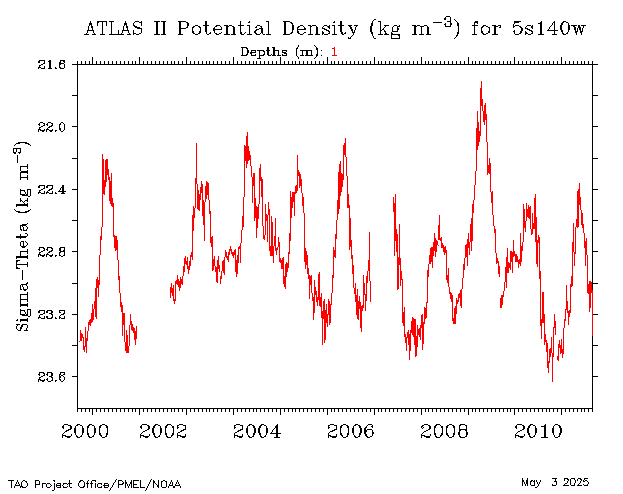
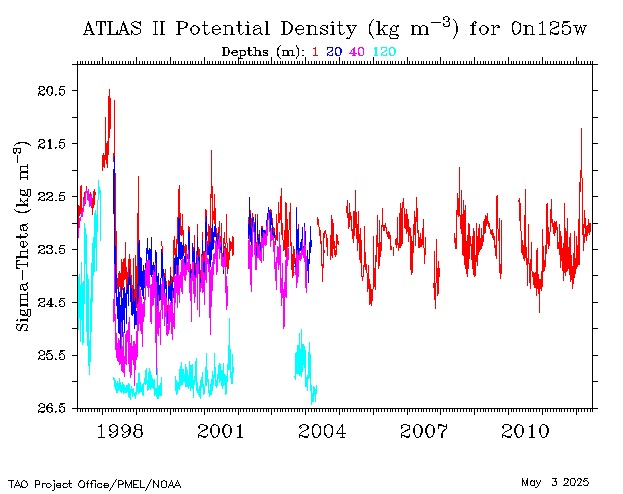
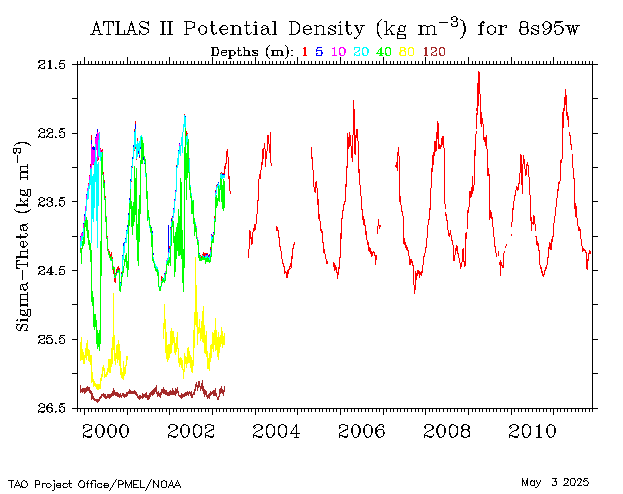
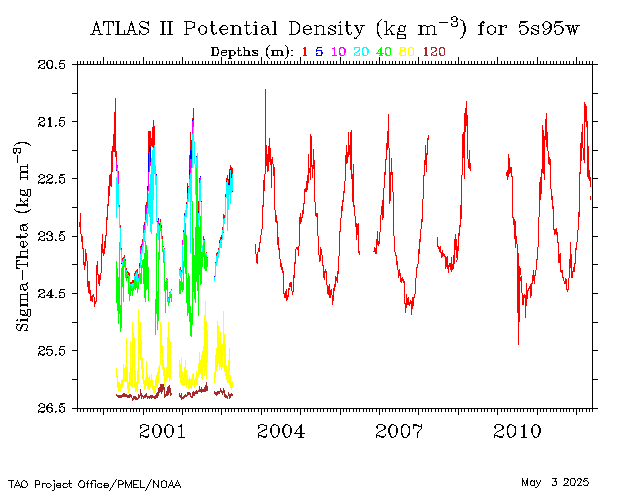
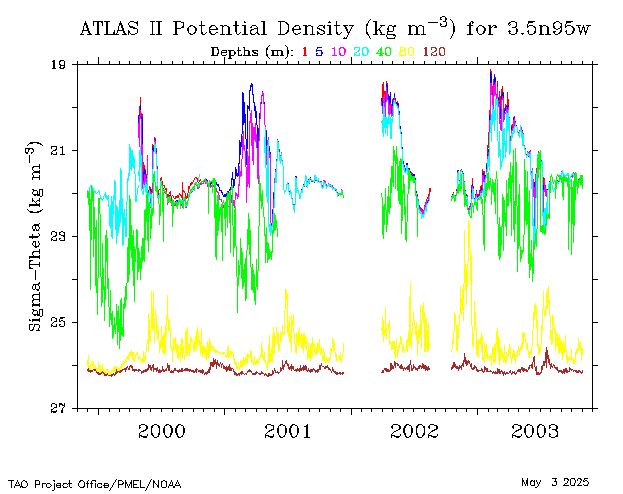
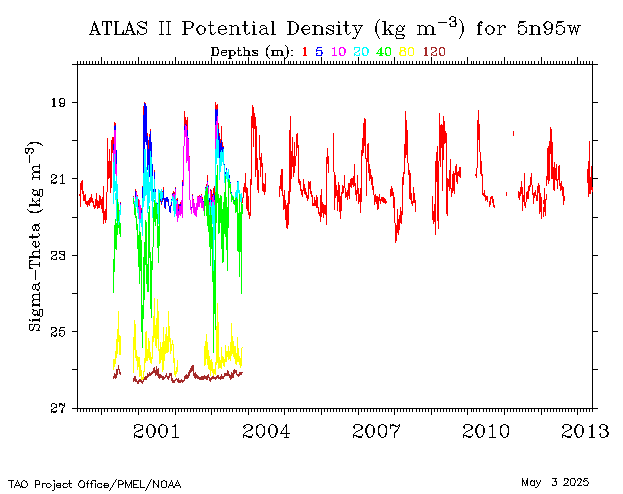
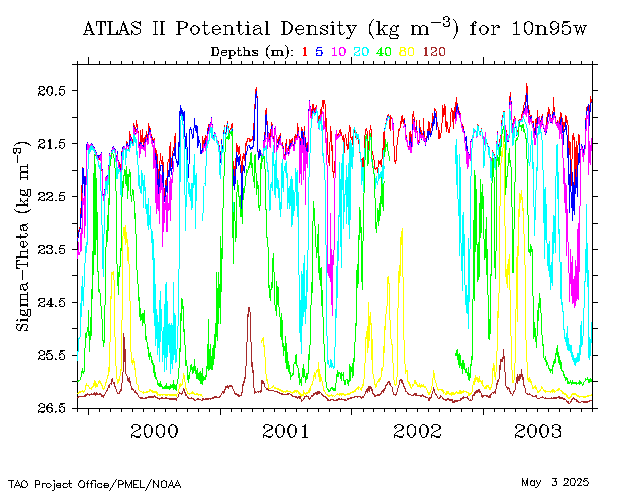
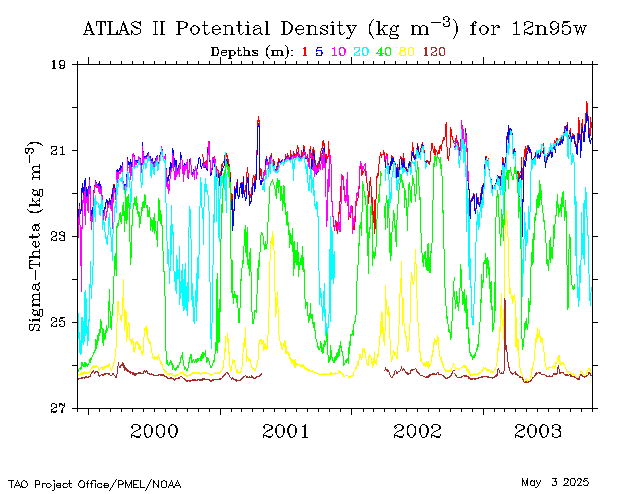
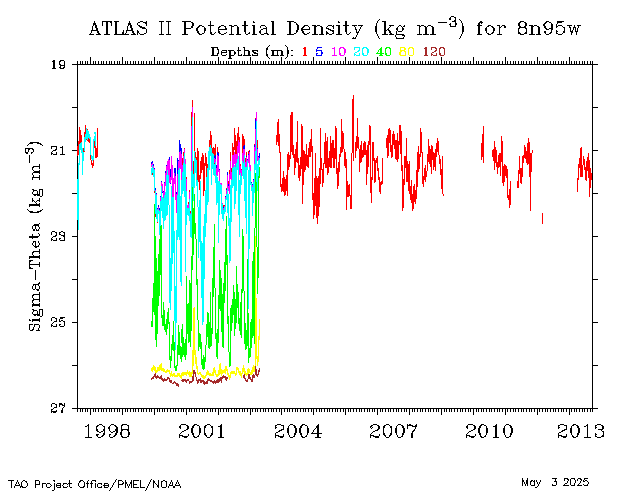
Potential
Density |
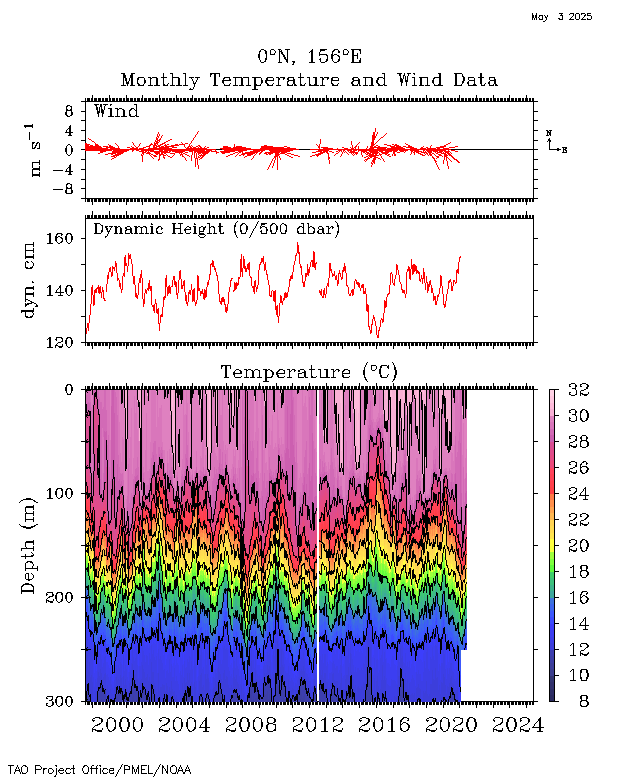
| 0°, 156°E |
 |
 |
 |
 |
 |
 |
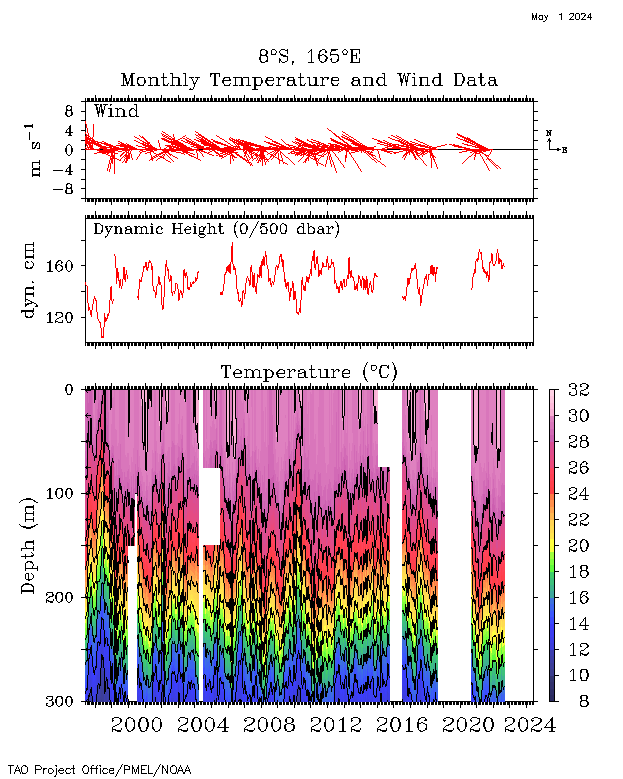
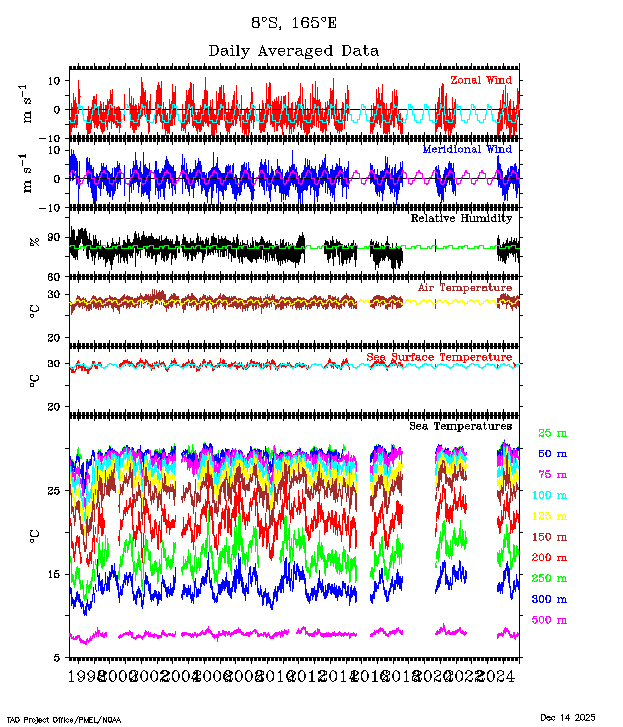
| 8°S, 165°E |
 |
 |
 |
 |
 |
 |
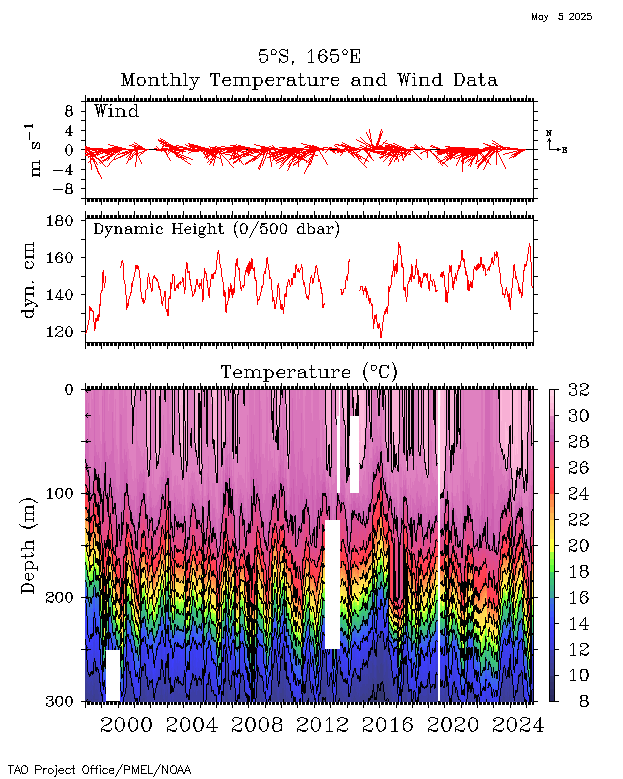
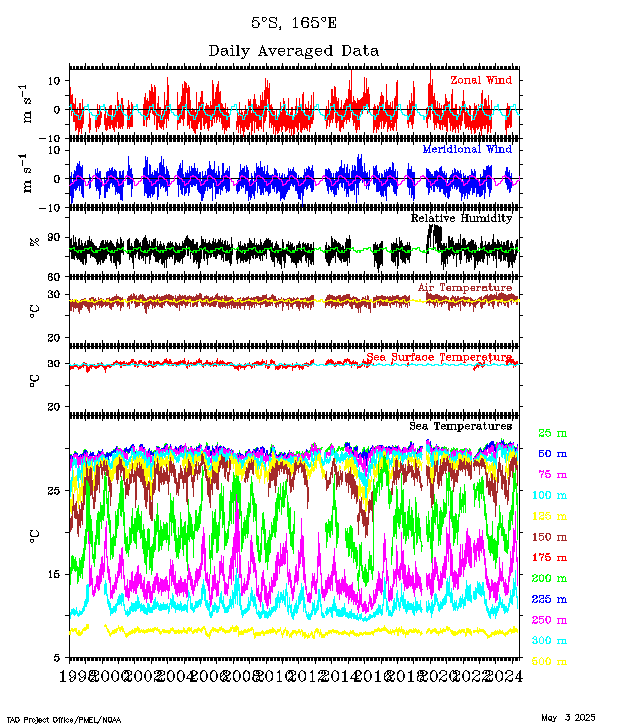
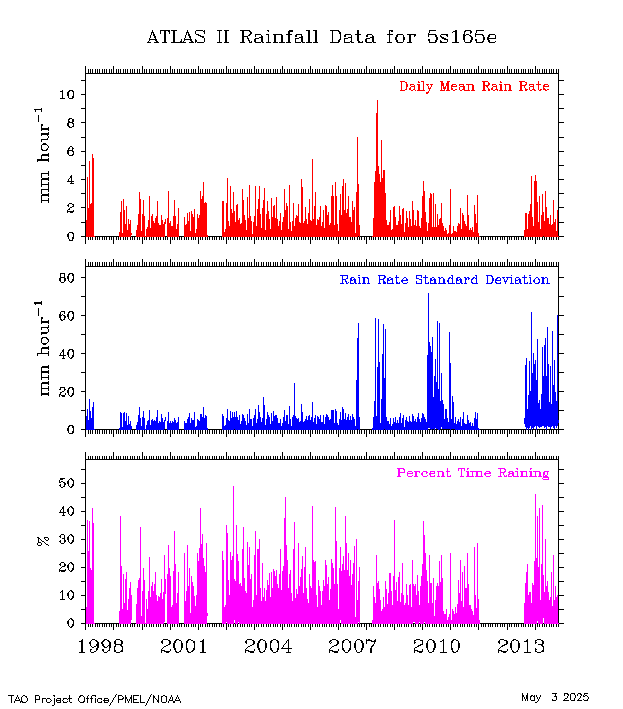
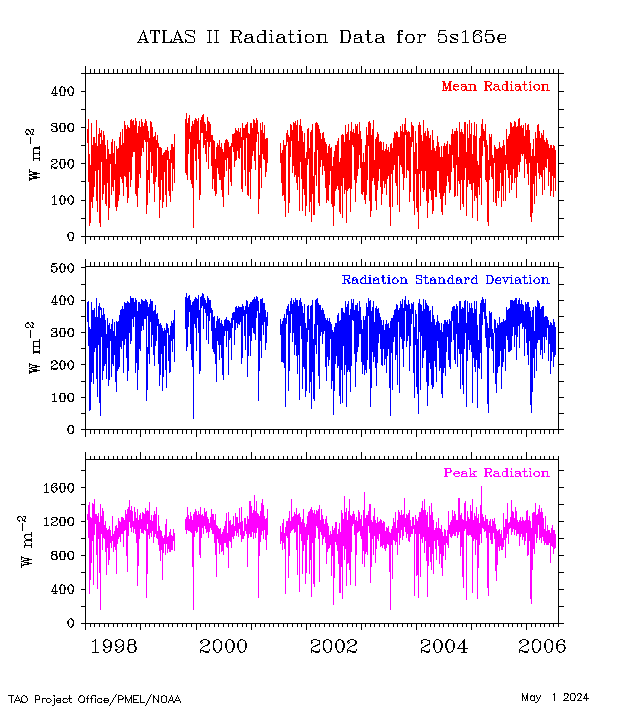
| 5°S, 165°E |
 |
 |
 |
 |
 |
 |
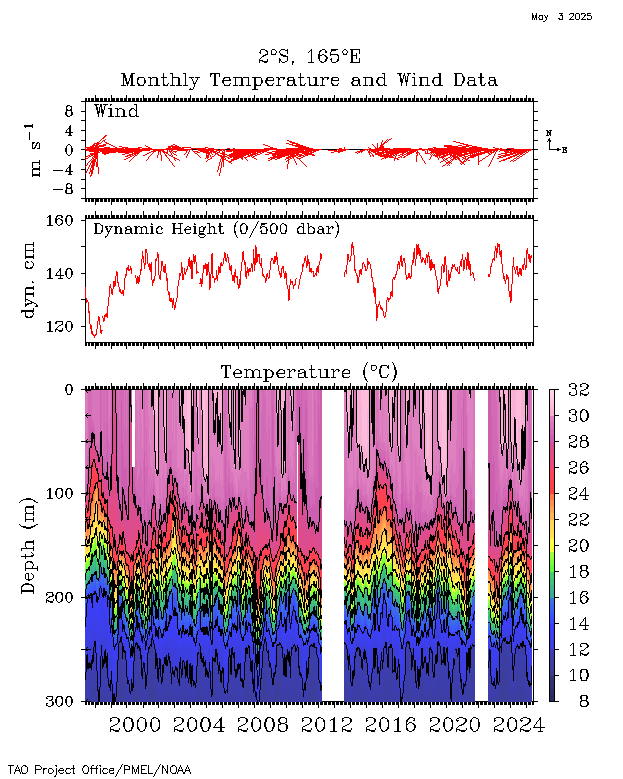
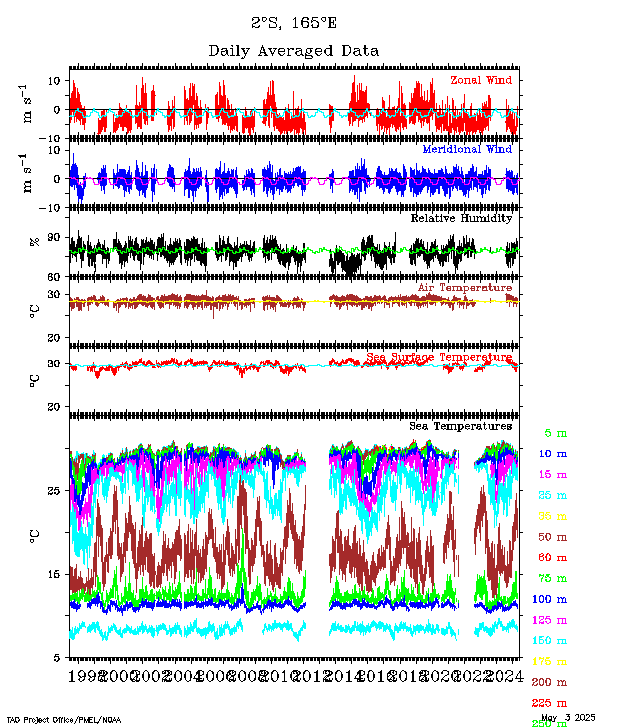
| 2°S, 165°E |
 |
 |
 |
 |
 |
 |
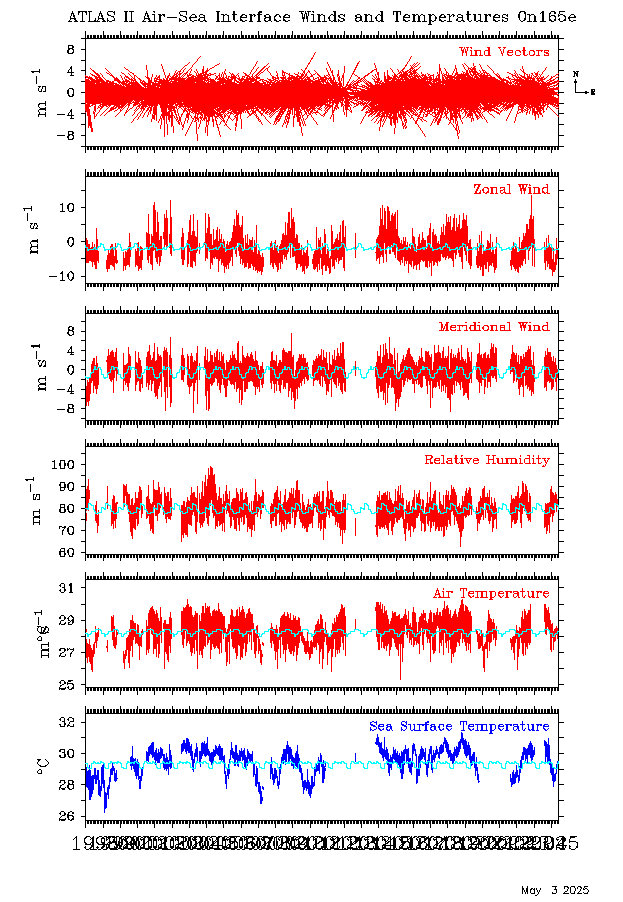
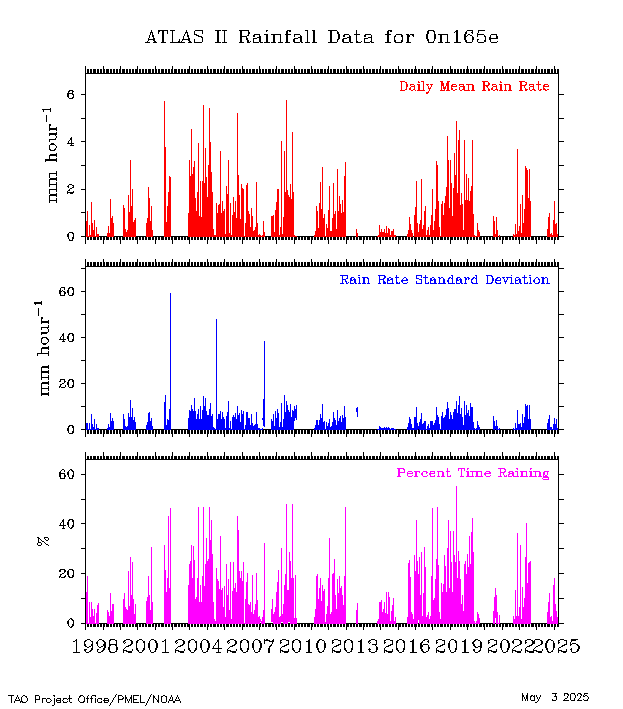
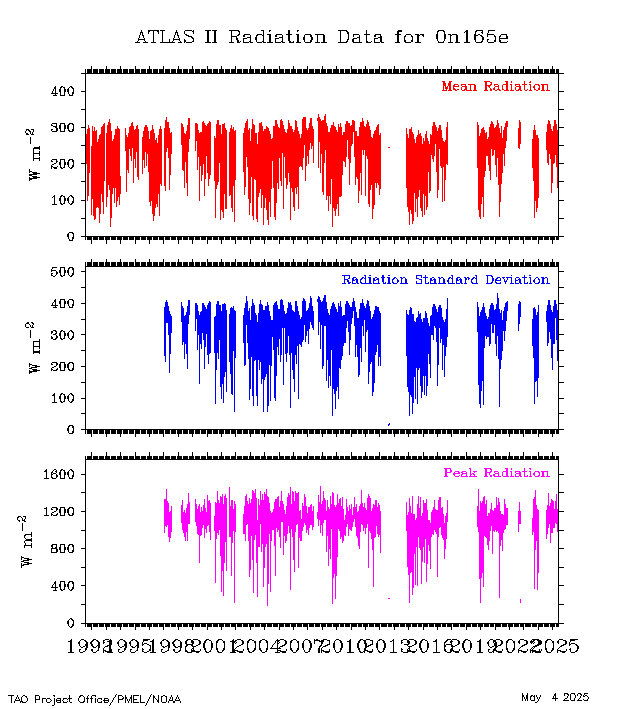
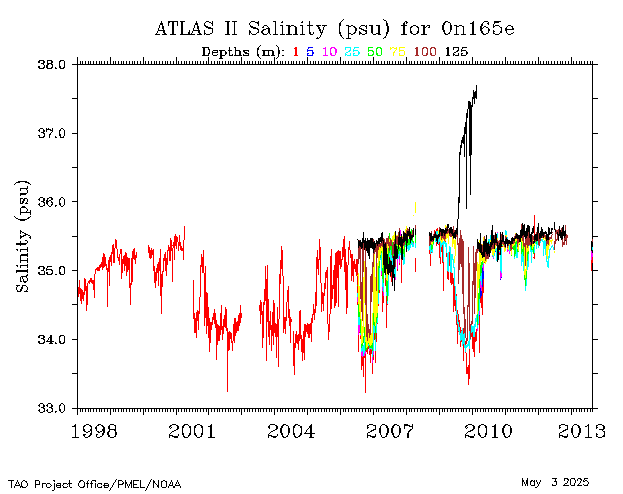
| 0°, 165°E |
|
 |
 |
 |
 |
 |
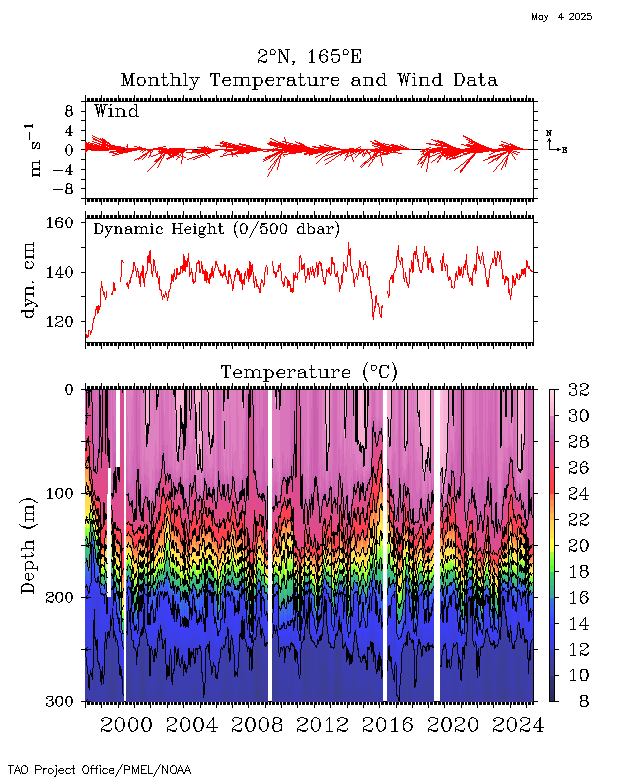
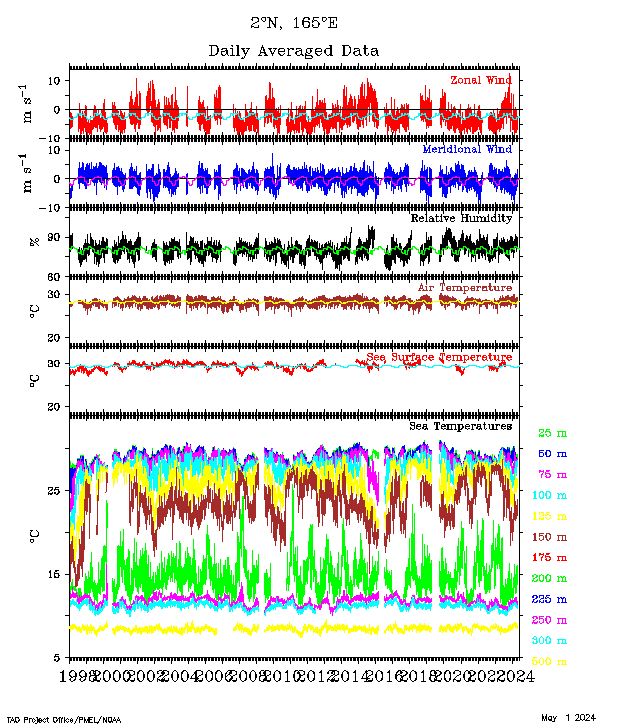
| 2°N, 165°E |
 |
 |
 |
 |
 |
 |
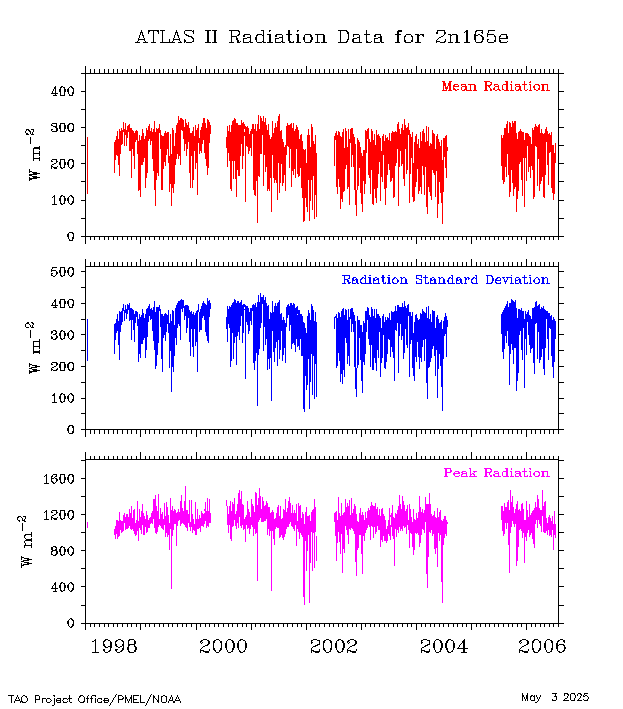
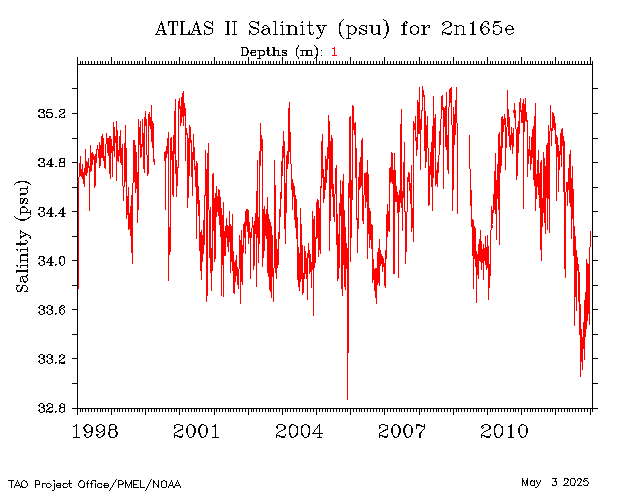
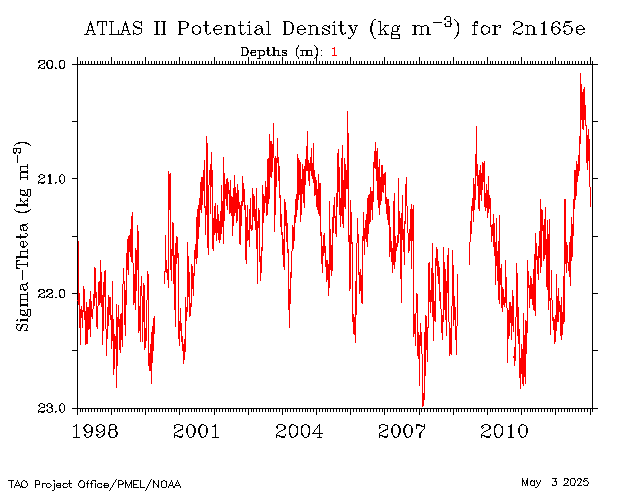
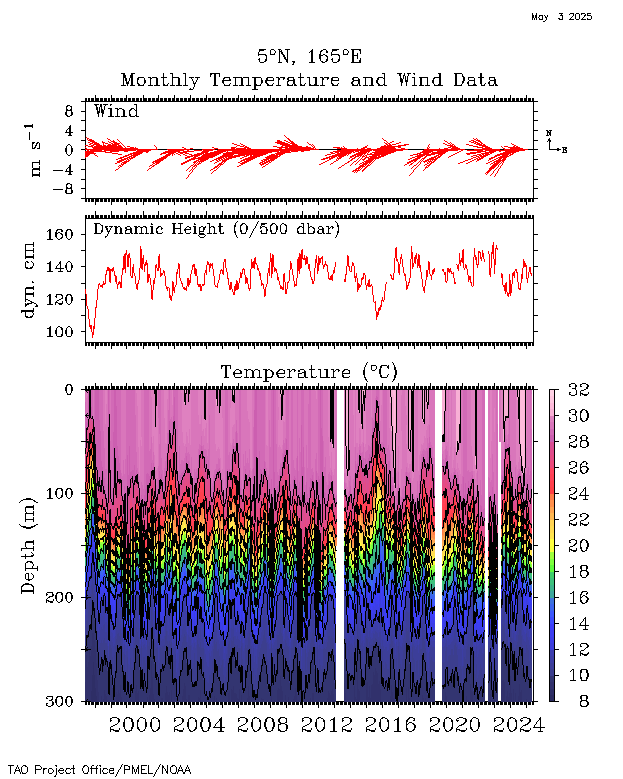
| 5°N, 165°E |
 |
 |
 |
 |
 |
 |
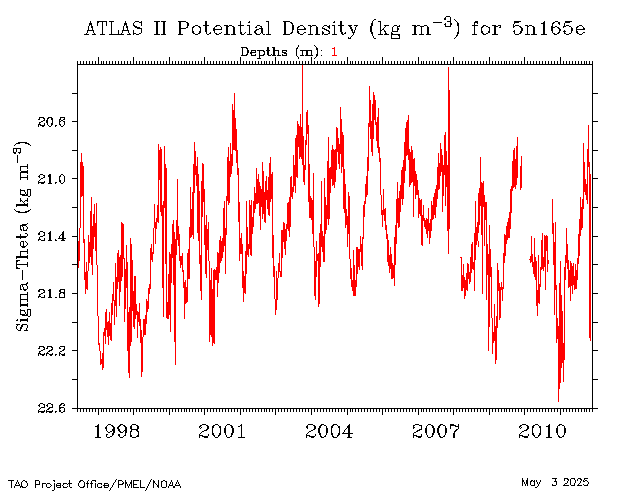
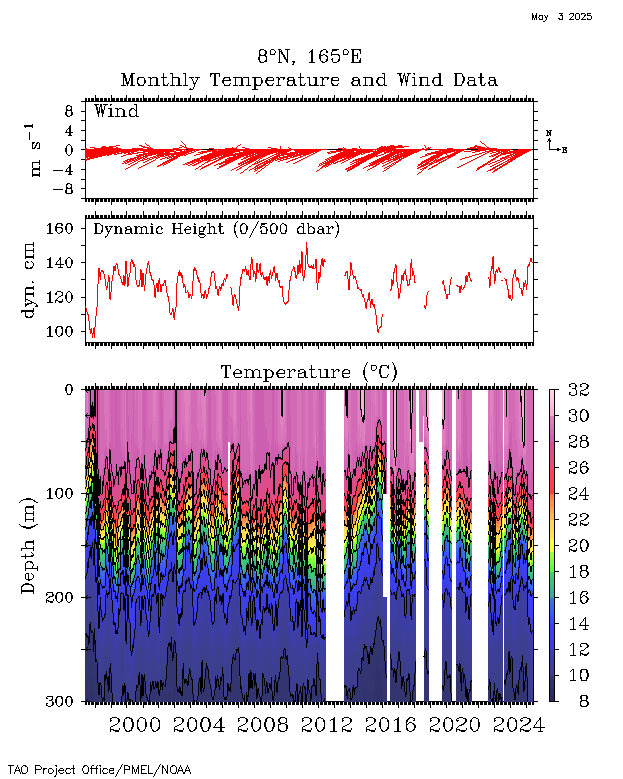
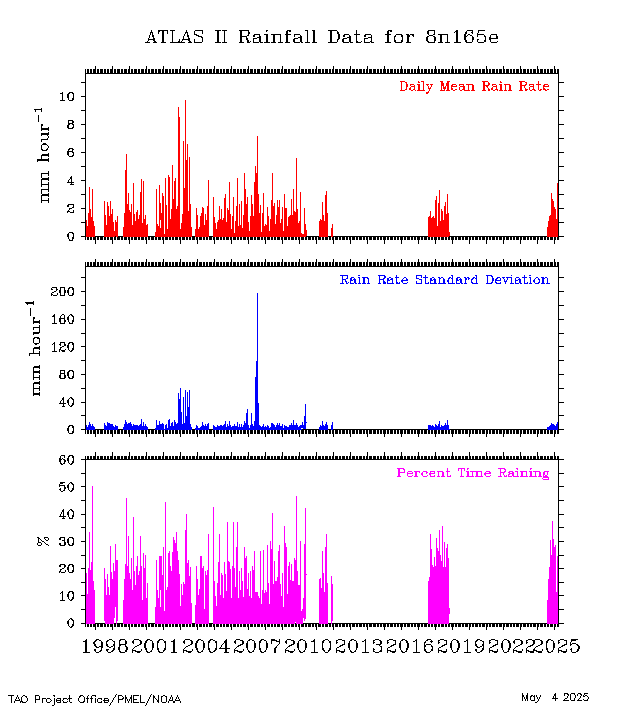
| 8°N, 165°E |
 |
 |
 |
 |
 |
 |
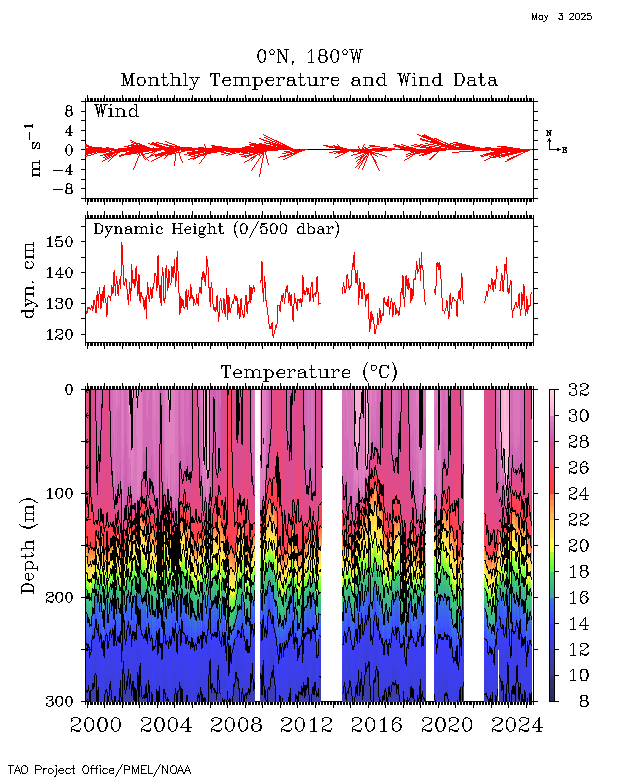
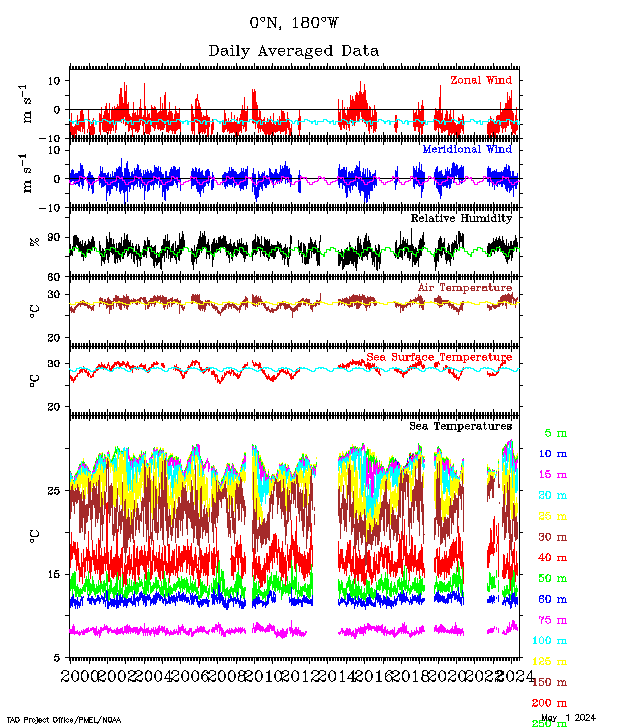
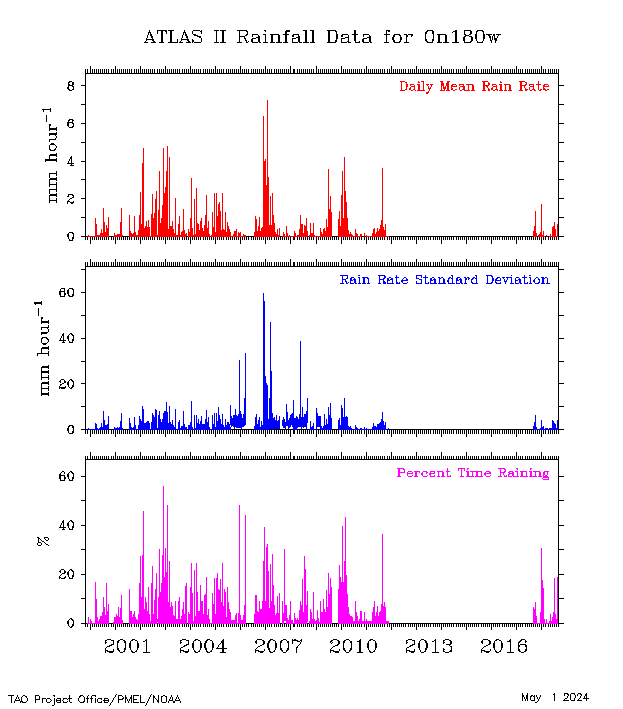
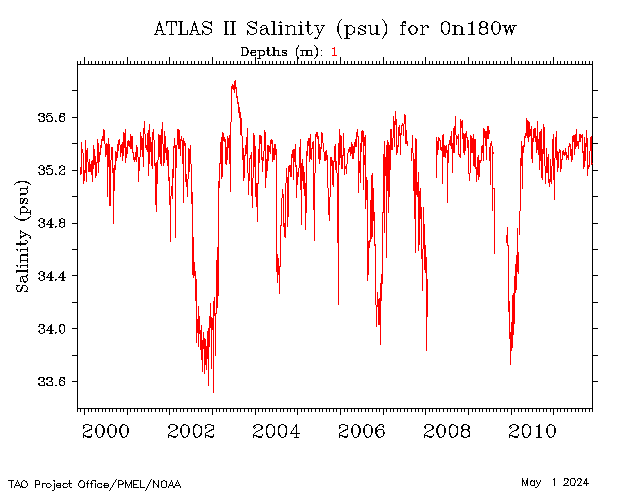
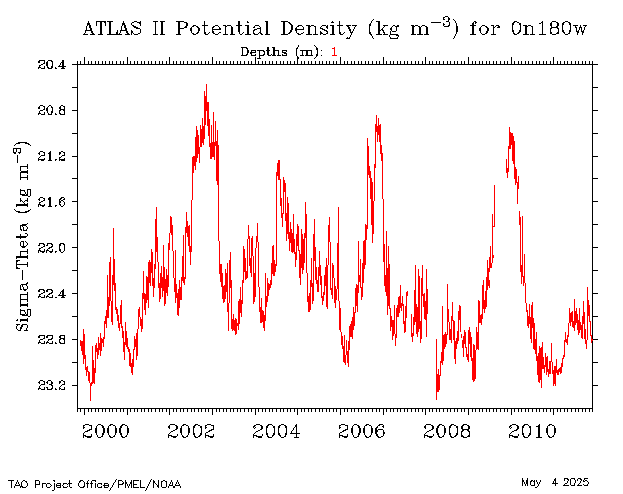
| 0°N, 180°W |
 |
 |
 |
|
 |
 |
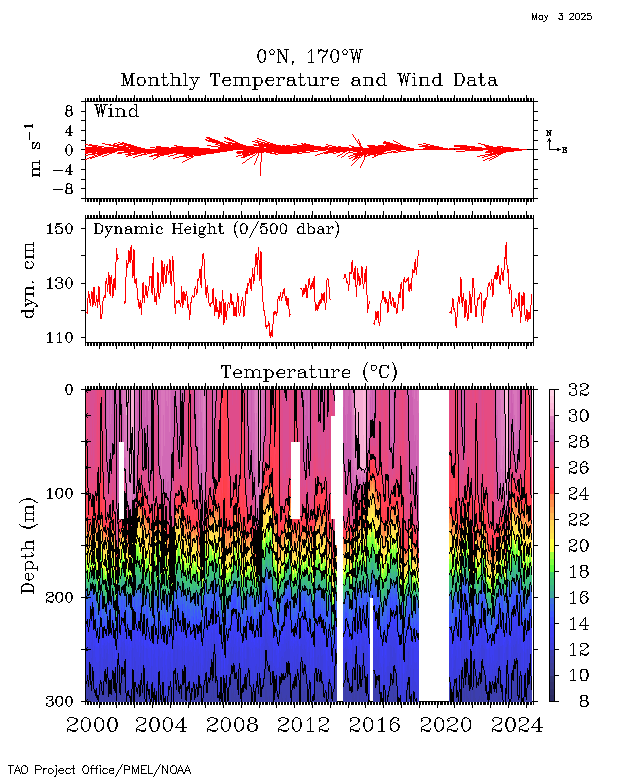
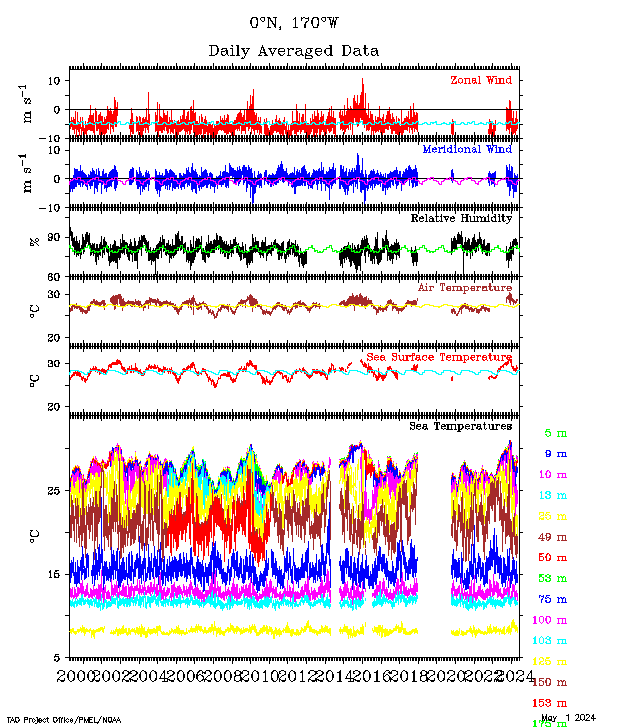
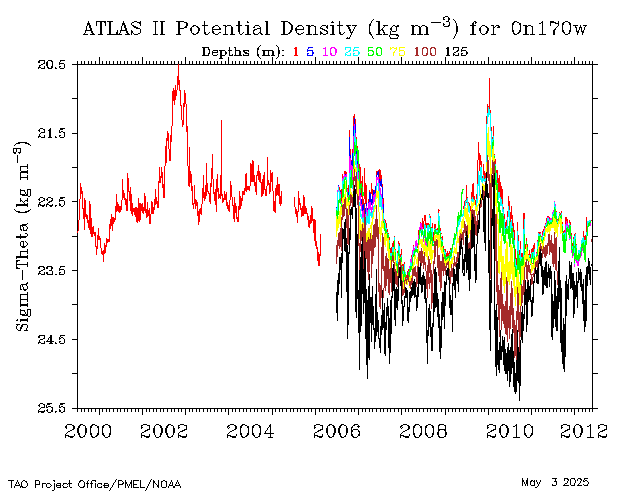
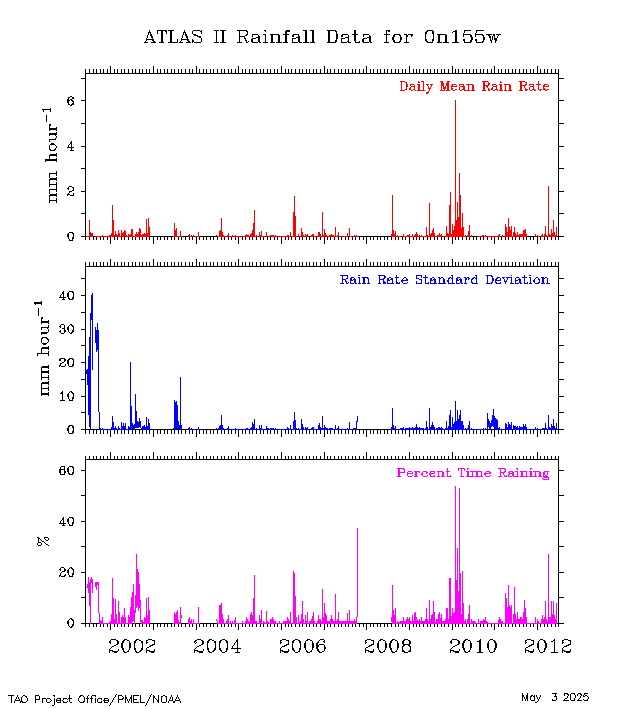
| 0°N, 170°W |
 |
 |
 |
|
 |
 |
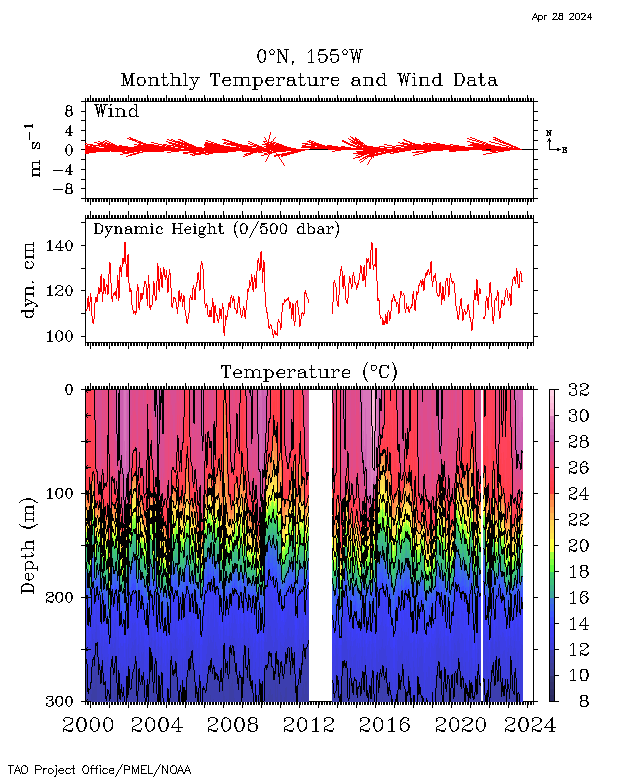
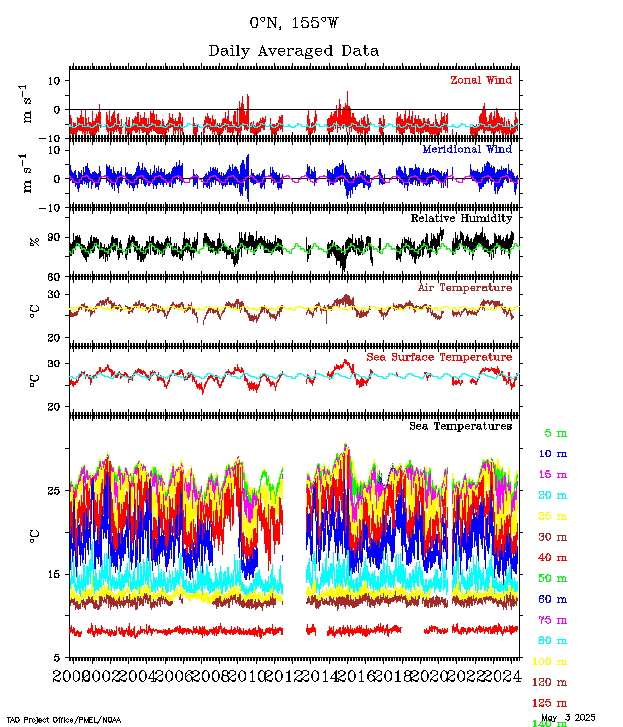
| 0°N, 155°W |
 |
 |
 |
|
 |
 |
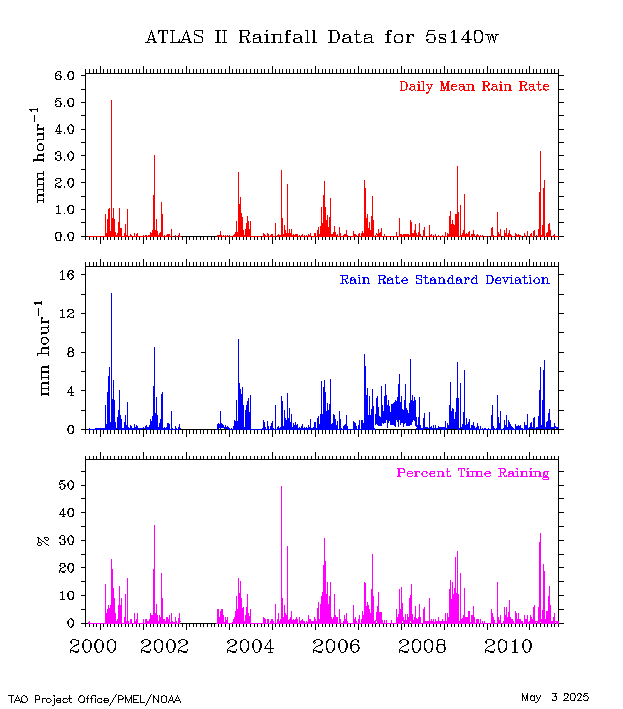
| 5°S, 140°W |
 |
 |
 |
|
 |
 |
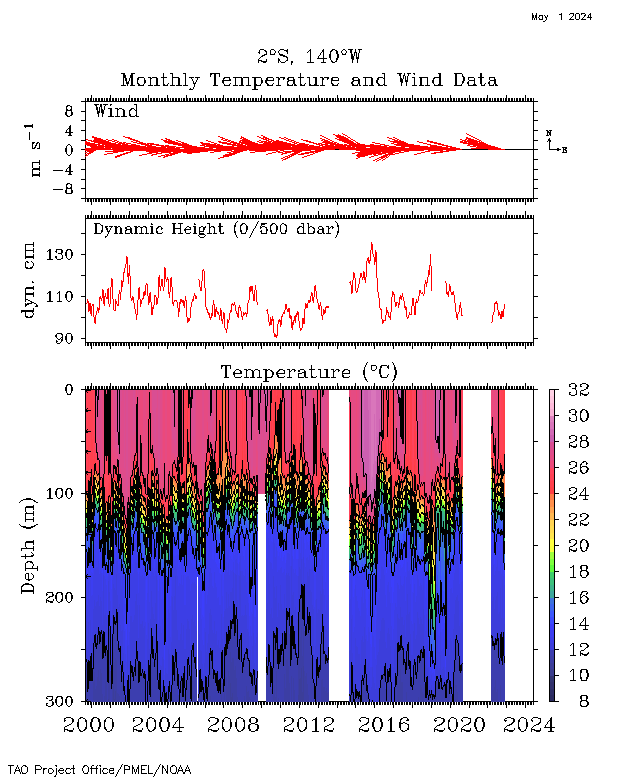
| 2°S, 140°W |
 |
 |
 |
|
 |
 |
| 0°, 140°W |
|
 |
 |
 |
 |
 |
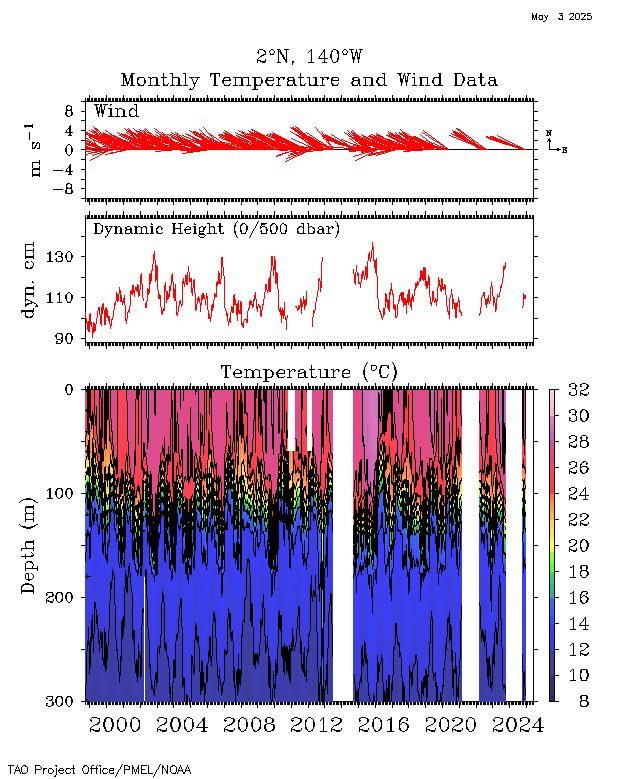
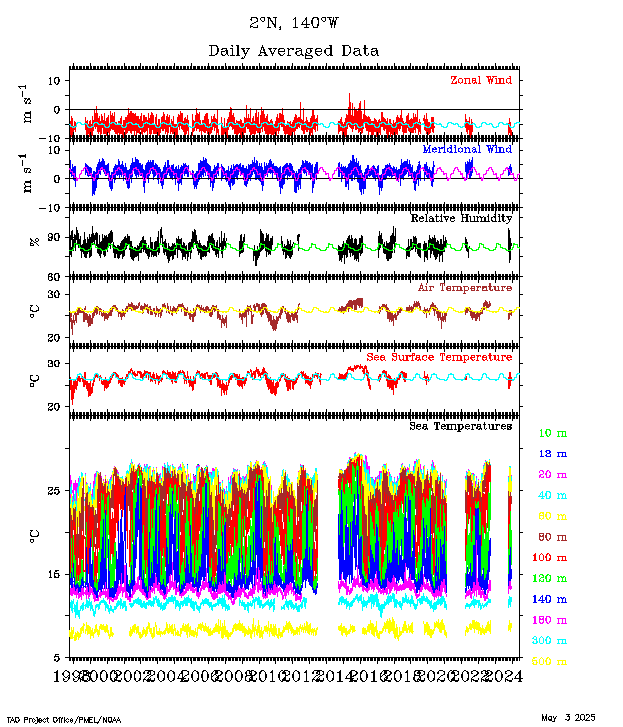
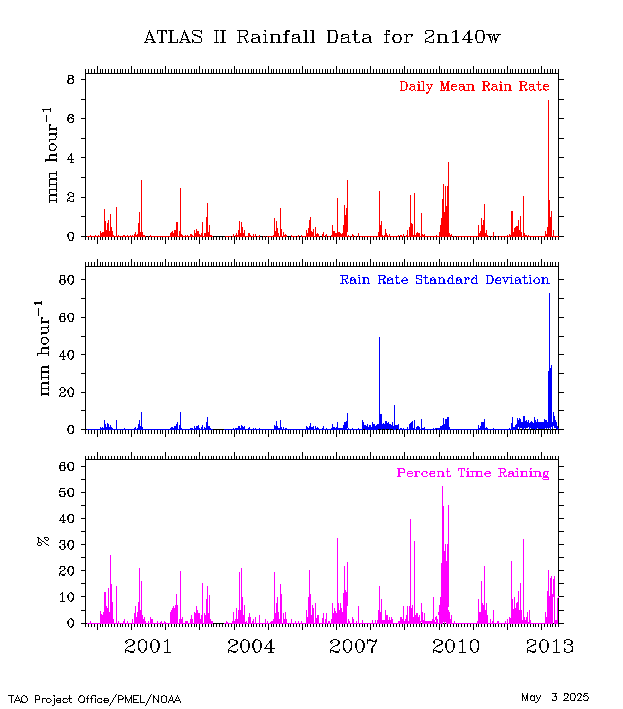
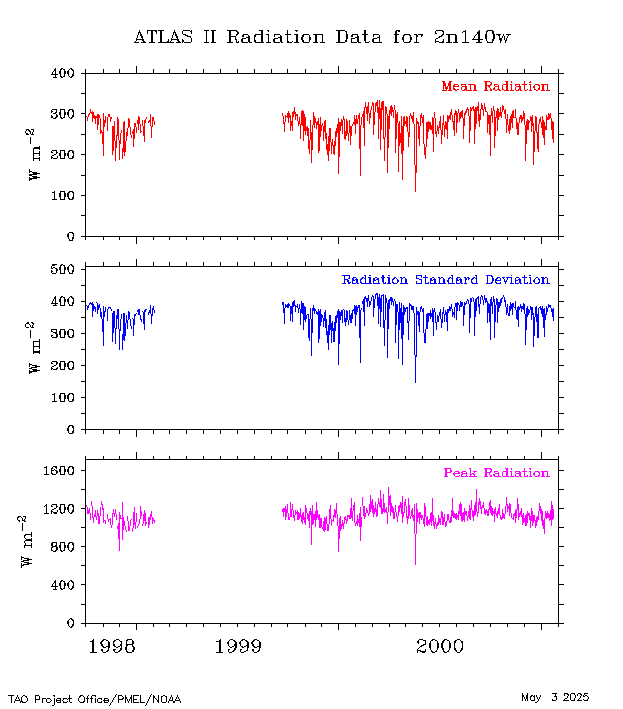
| 2°N, 140°W |
 |
 |
 |
 |
 |
 |
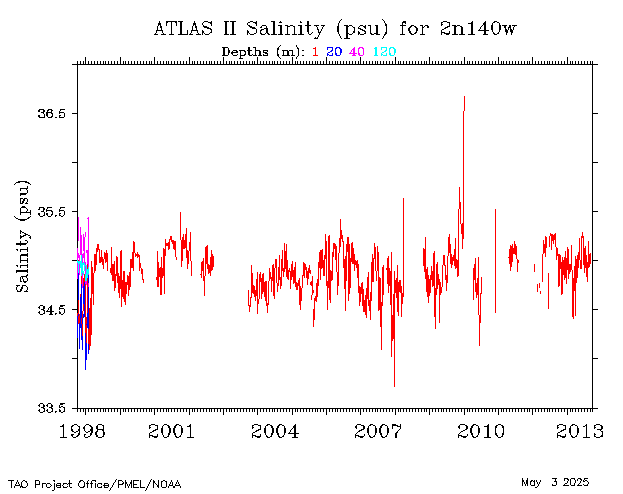
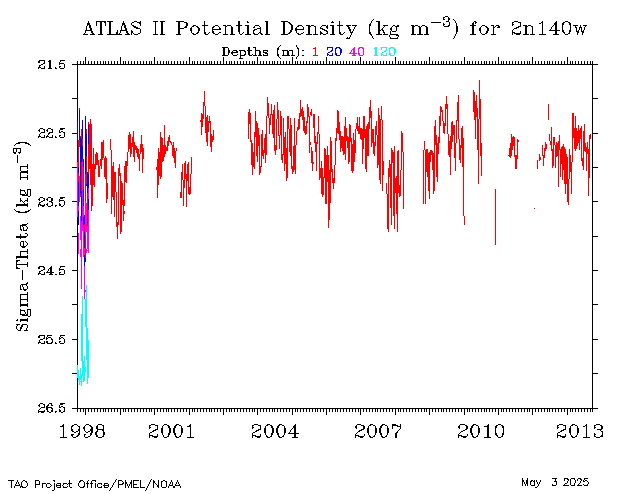
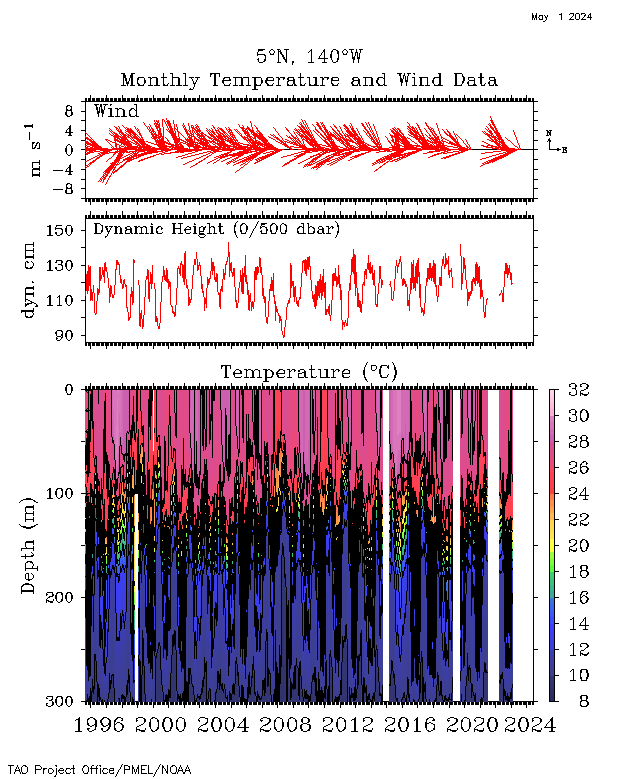
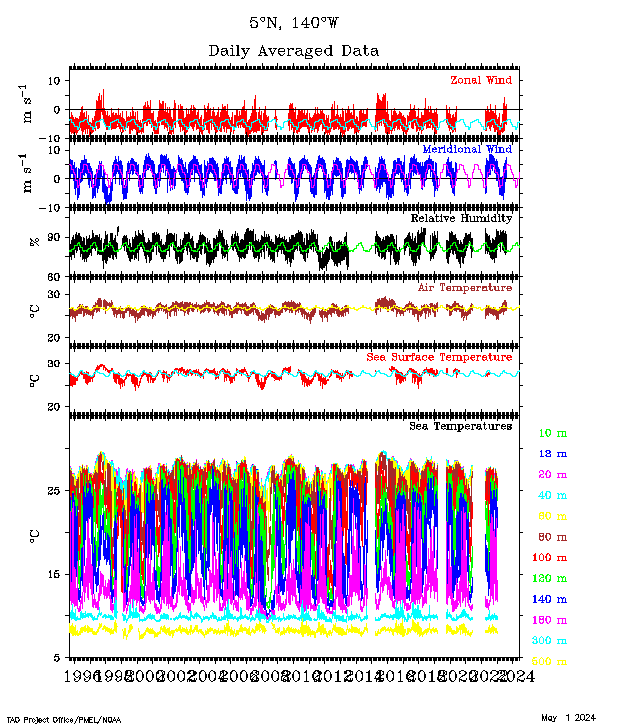
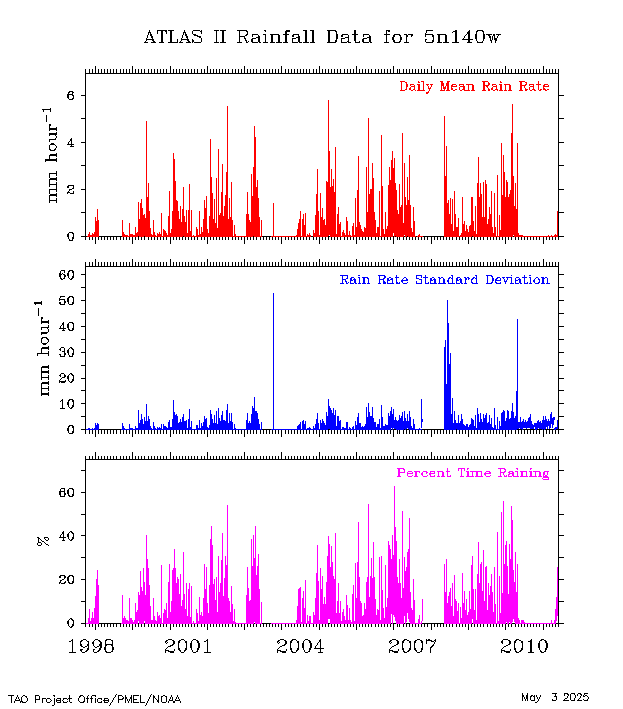
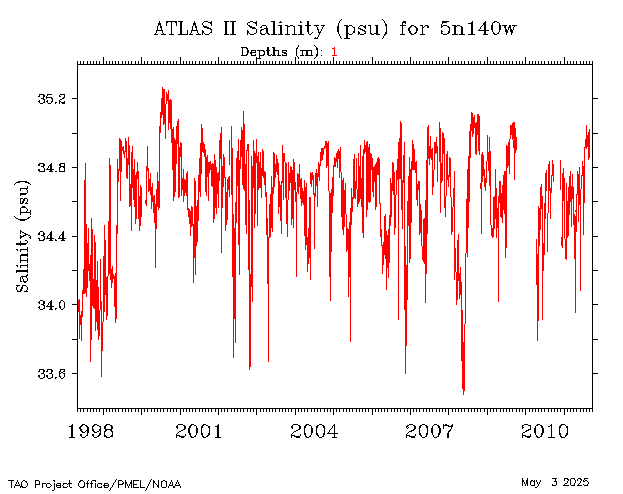
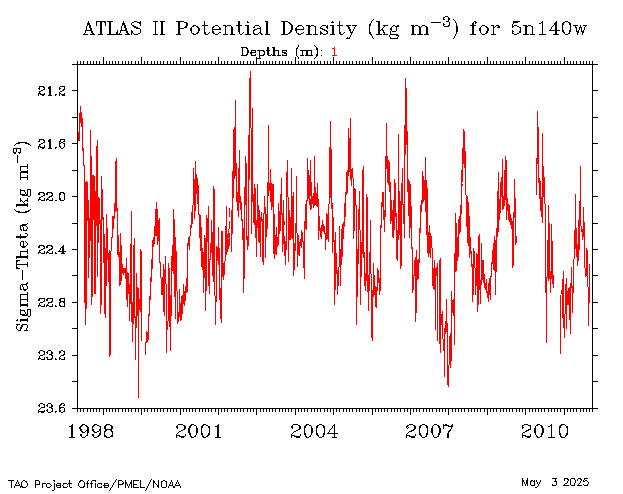
| 5°N, 140°W |
 |
 |
 |
|
 |
 |
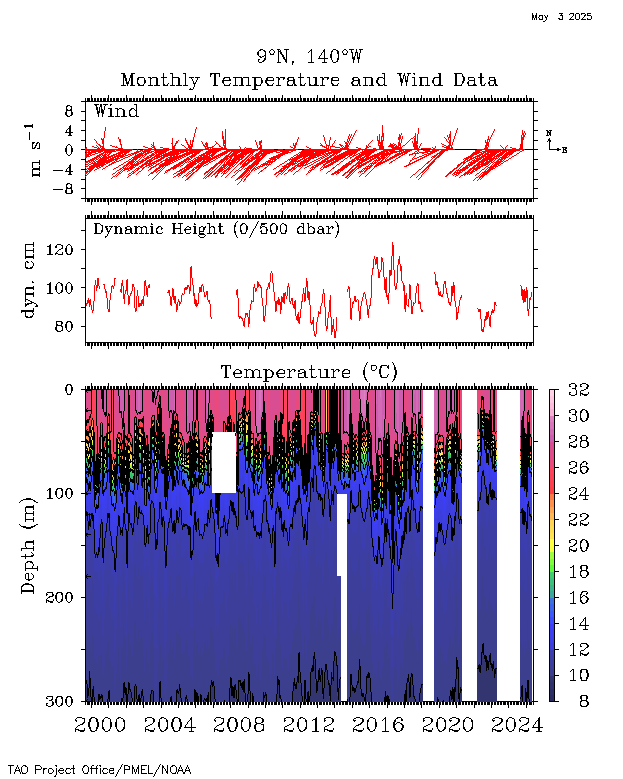
| 9°N, 140°W |
 |
 |
 |
|
 |
 |
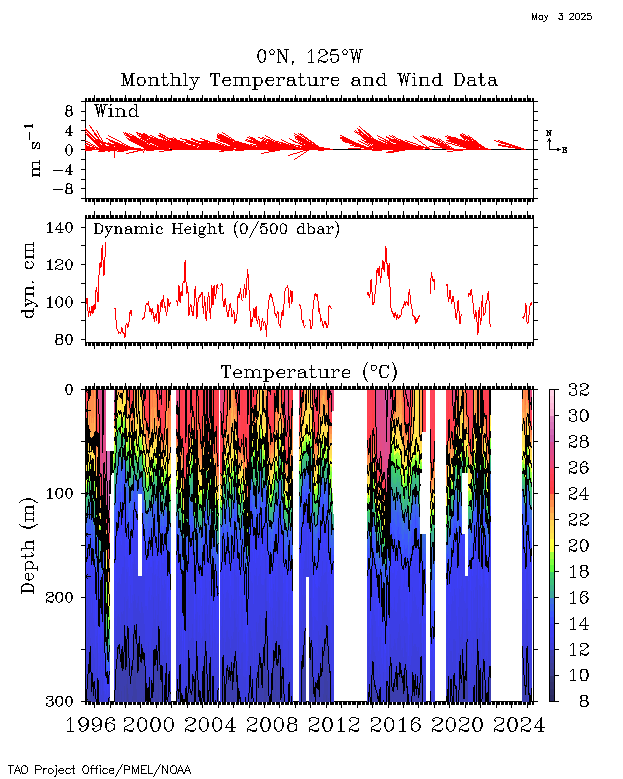
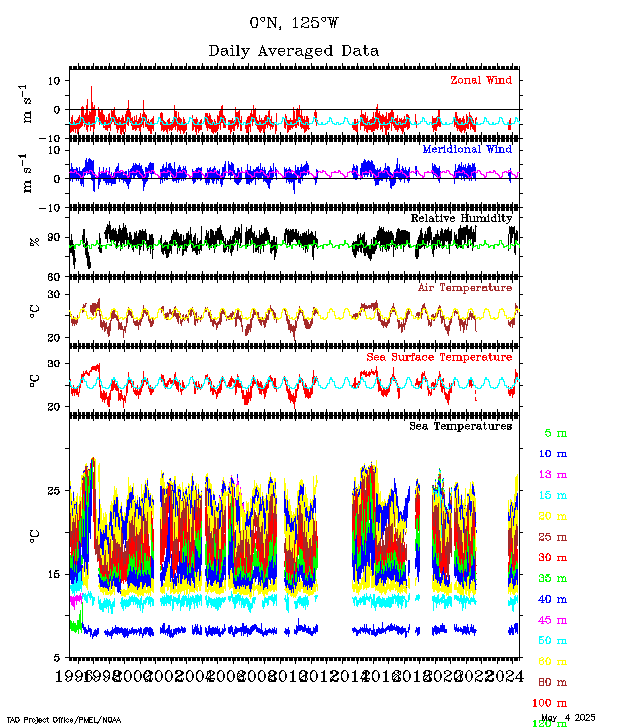
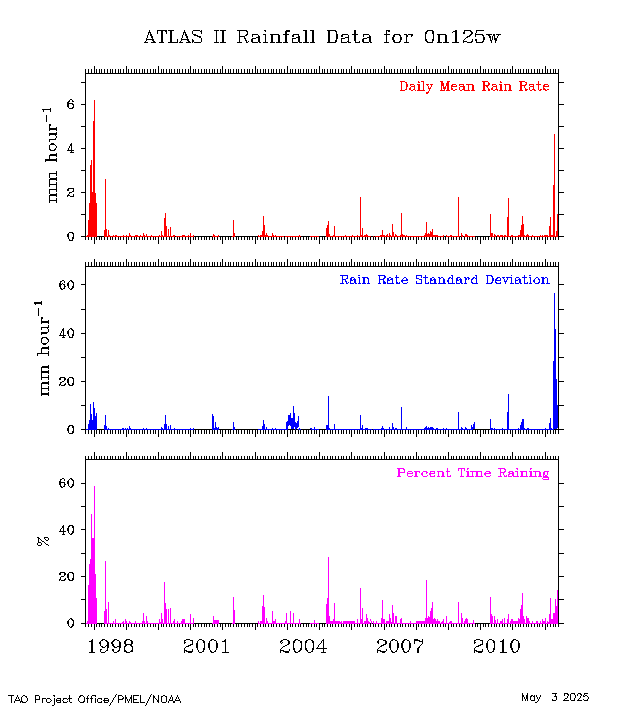
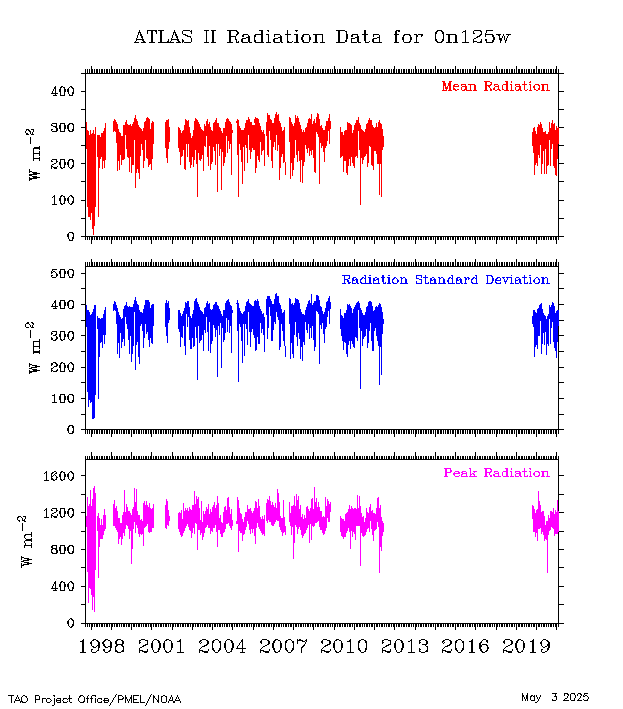
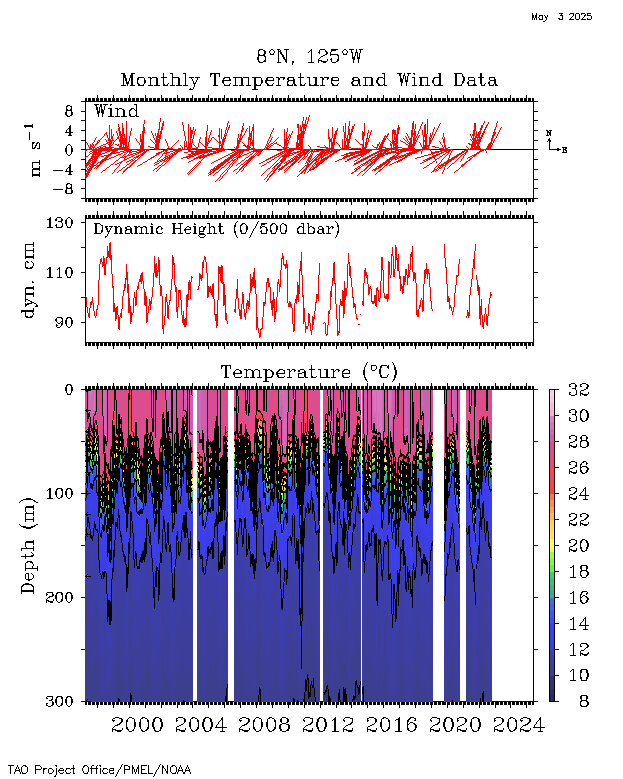
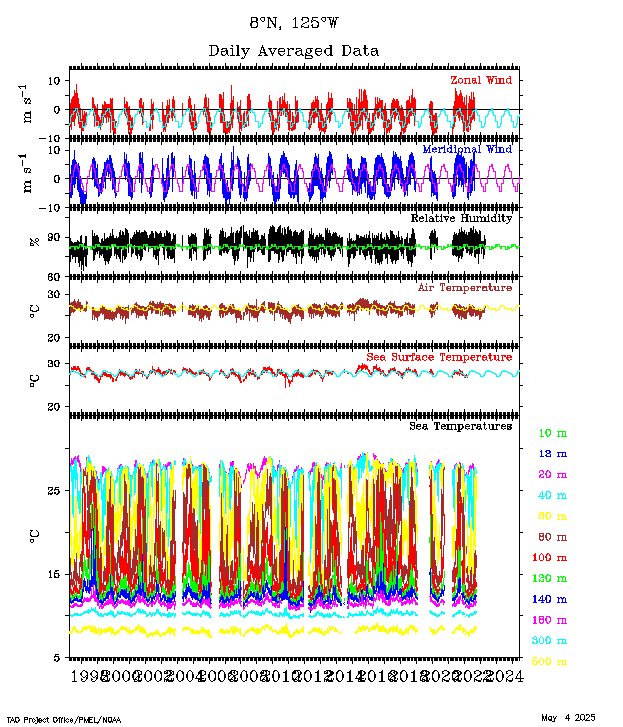
| 0°, 125°W |
 |
 |
 |
 |
 |
 |
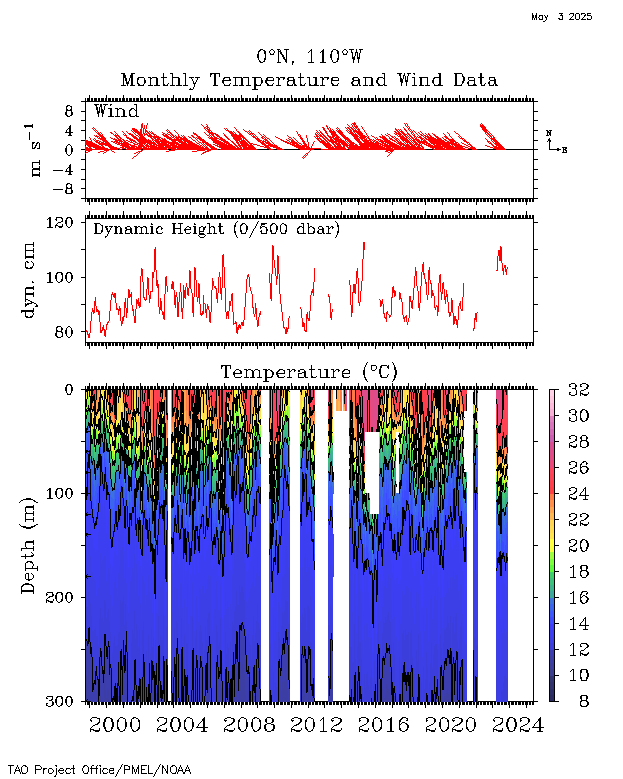
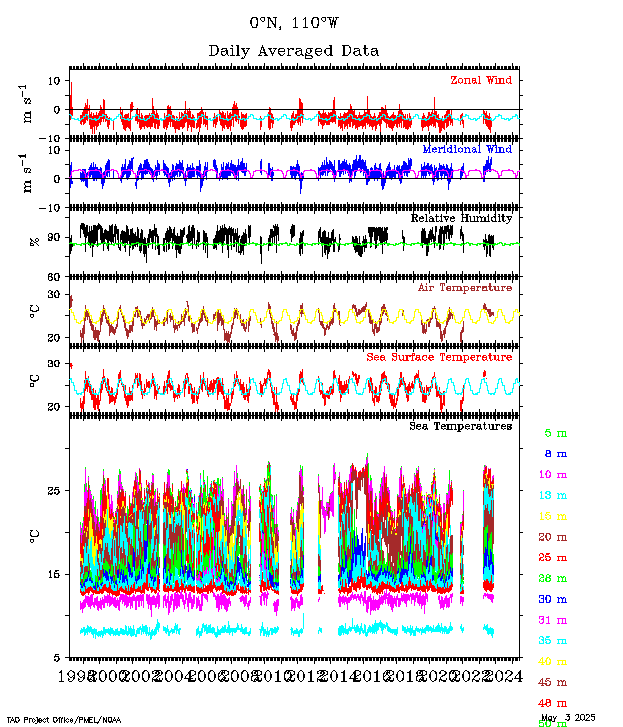
| 0°, 110°W |
 |
 |
 |
 |
 |
 |
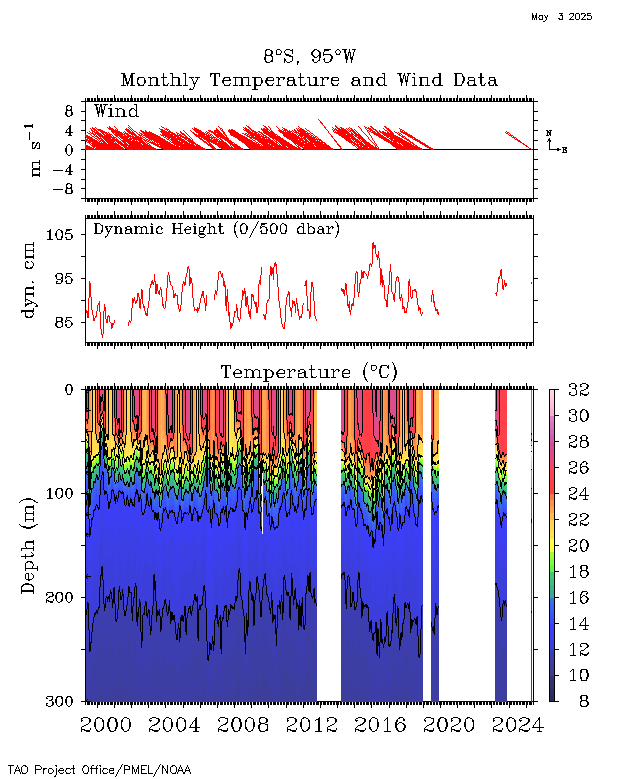
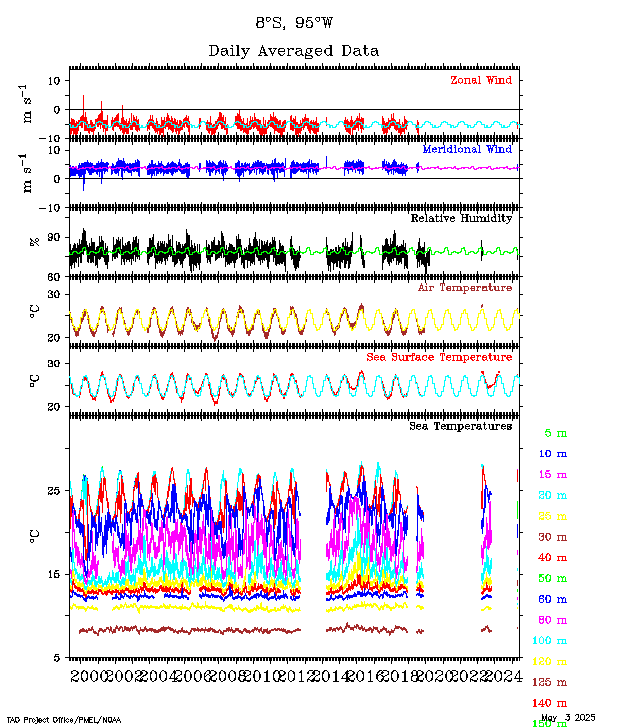
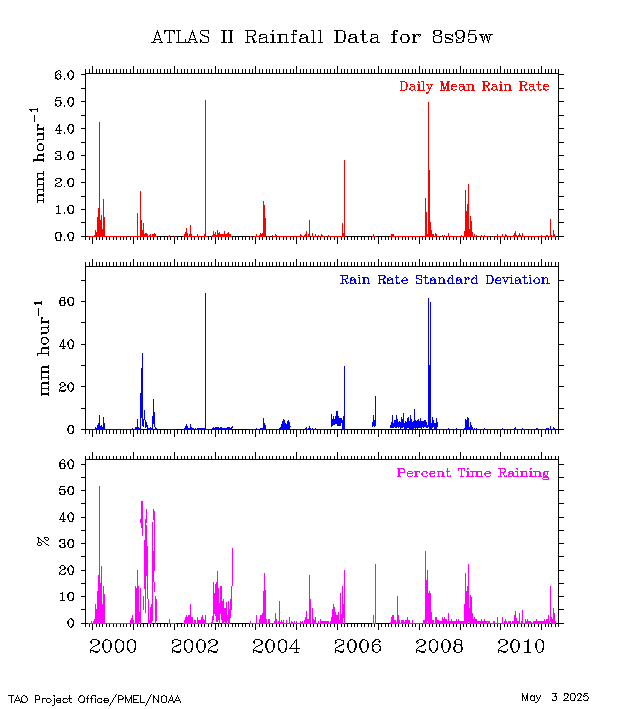
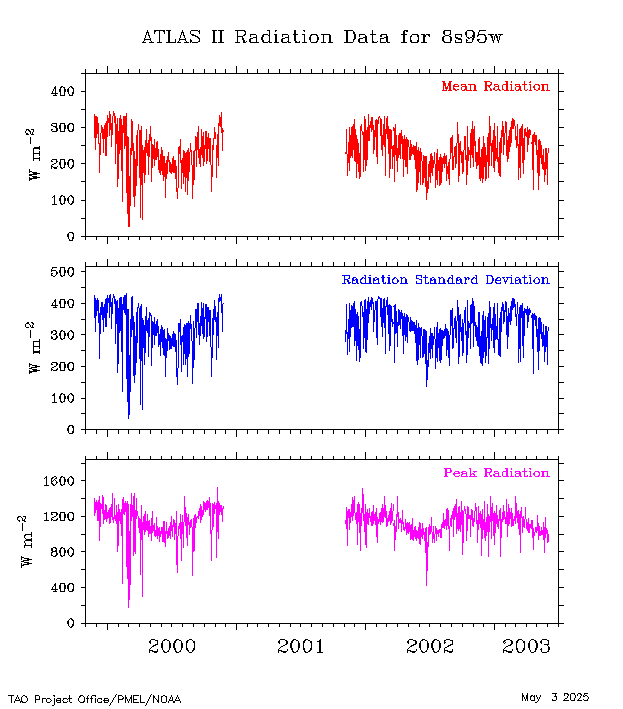
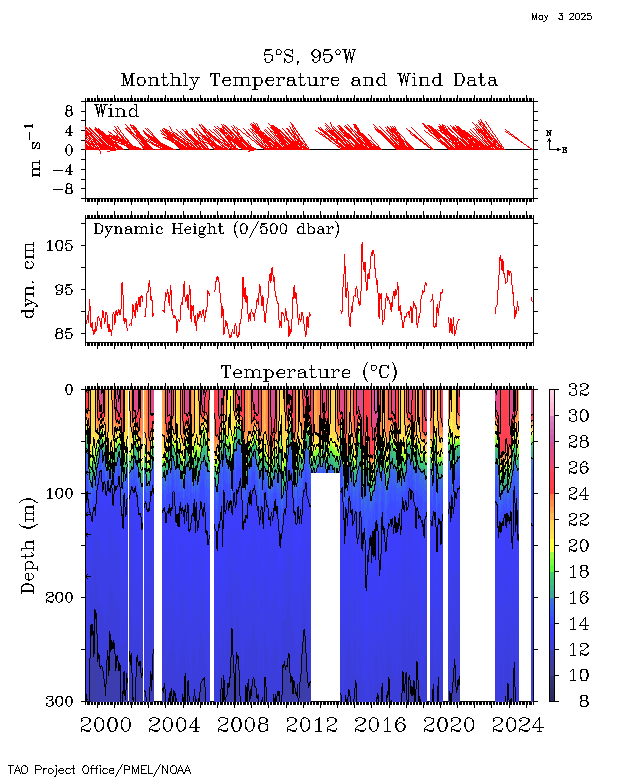
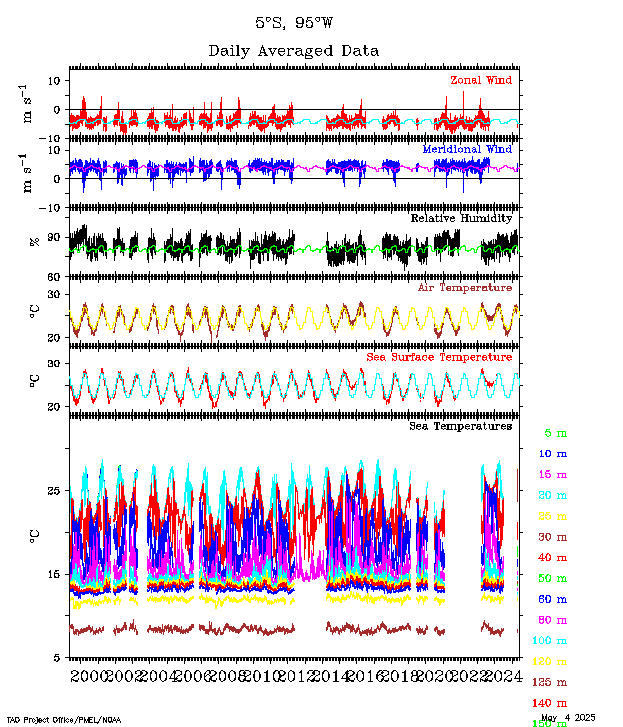
| 8°S, 95°W |
 |
 |
 |
 |
 |
 |
| 5°S, 95°W |
 |
 |
 |
 |
 |
 |
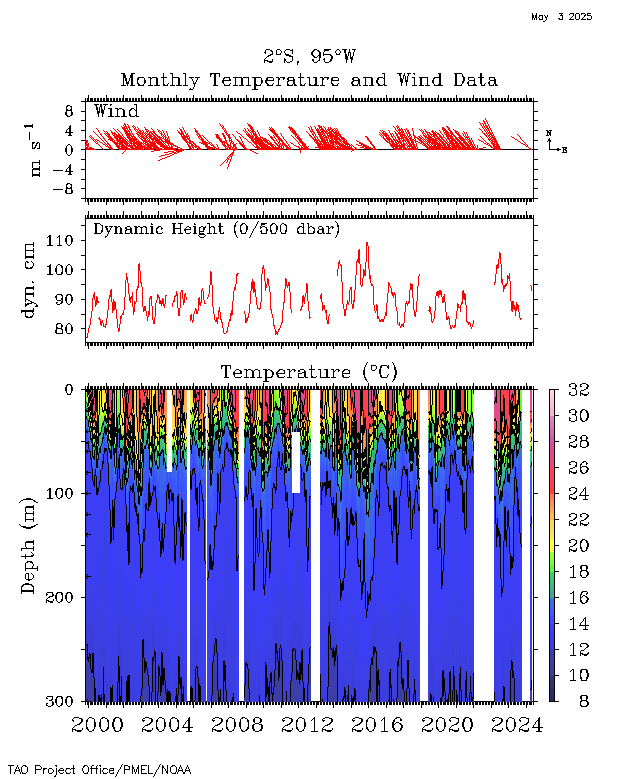
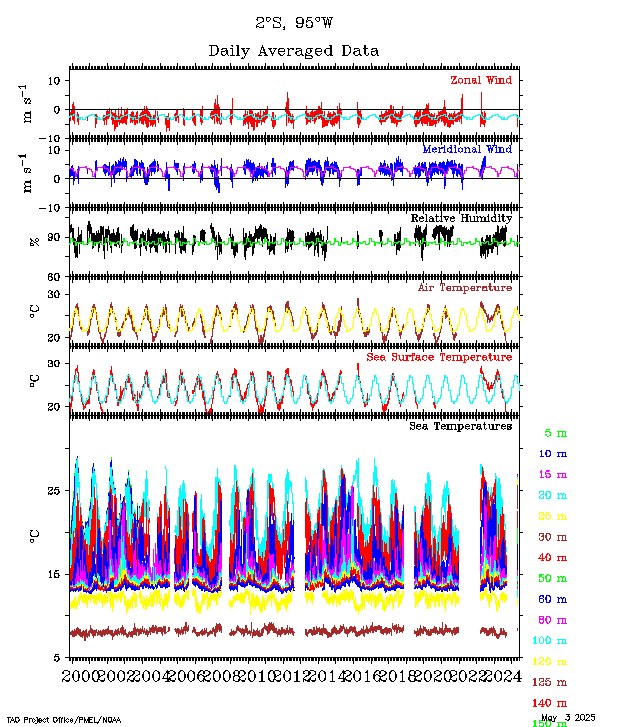
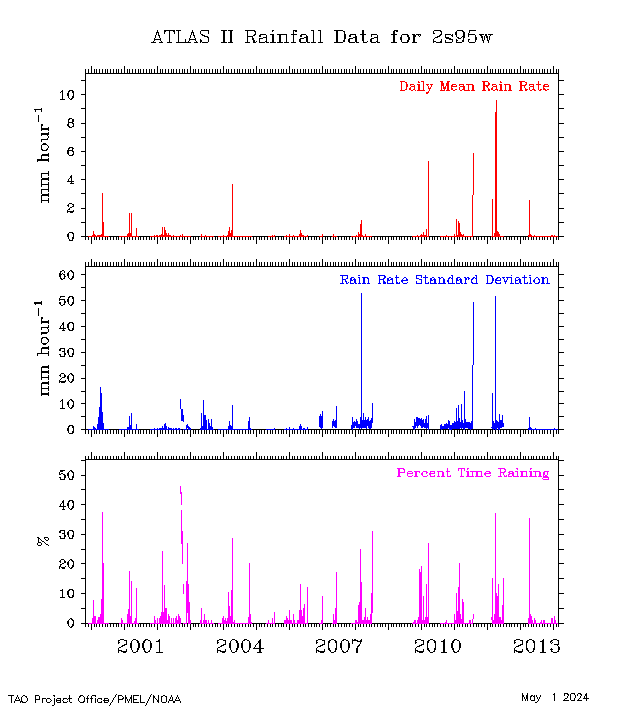
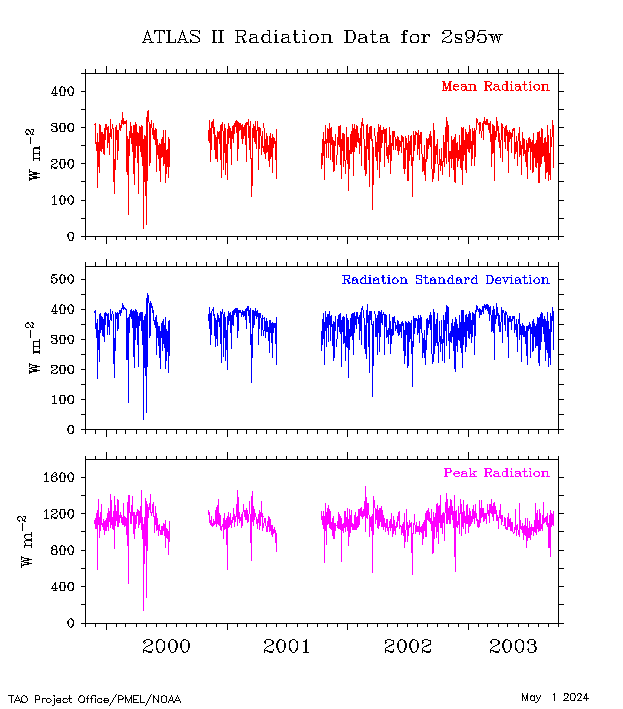
| 2°S, 95°W |
 |
 |
 |
 |
 |
 |
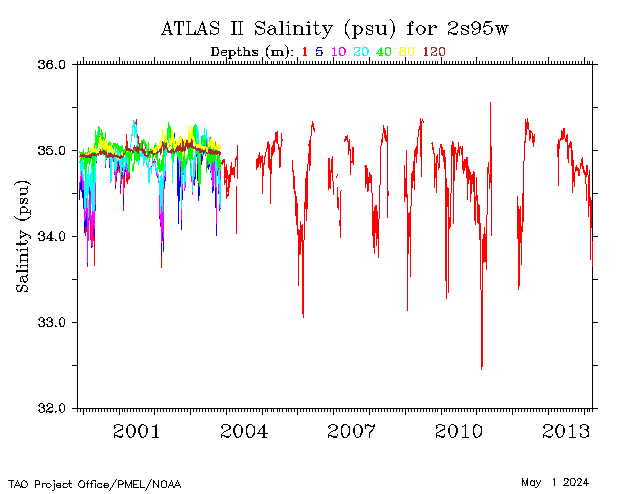
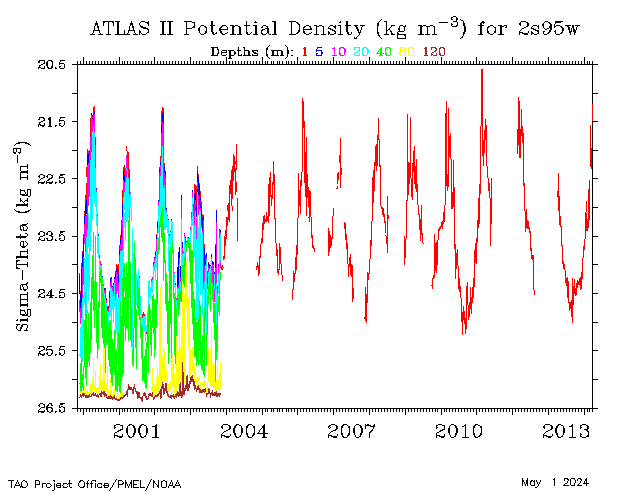
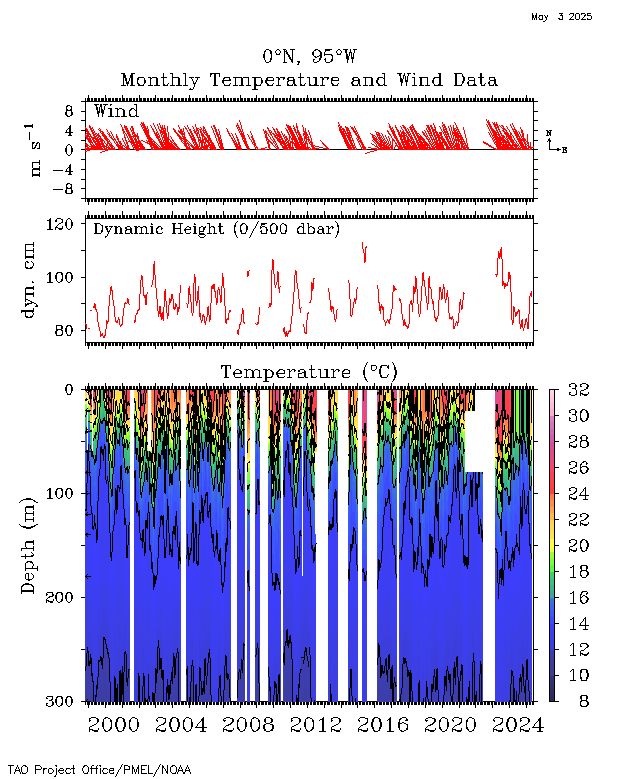
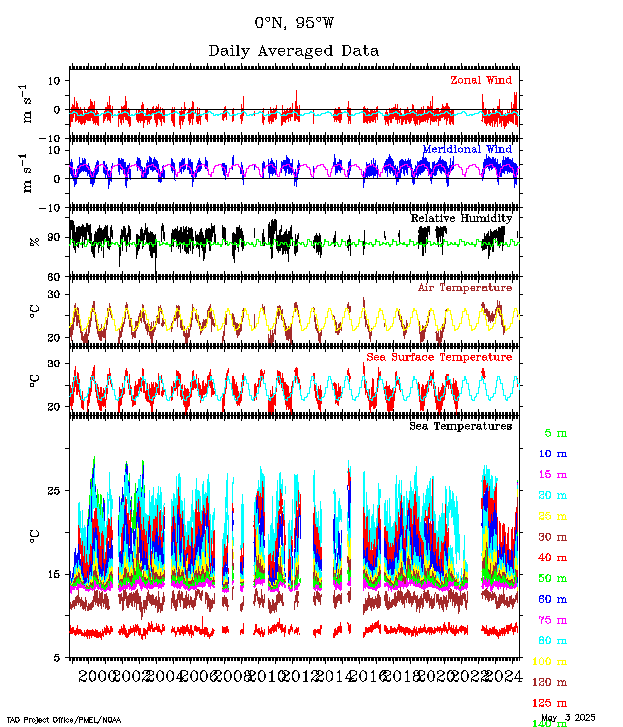
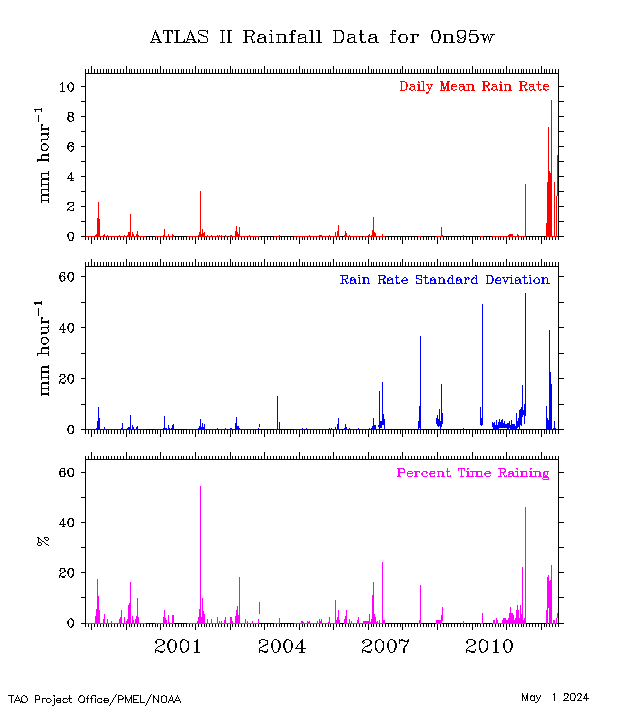
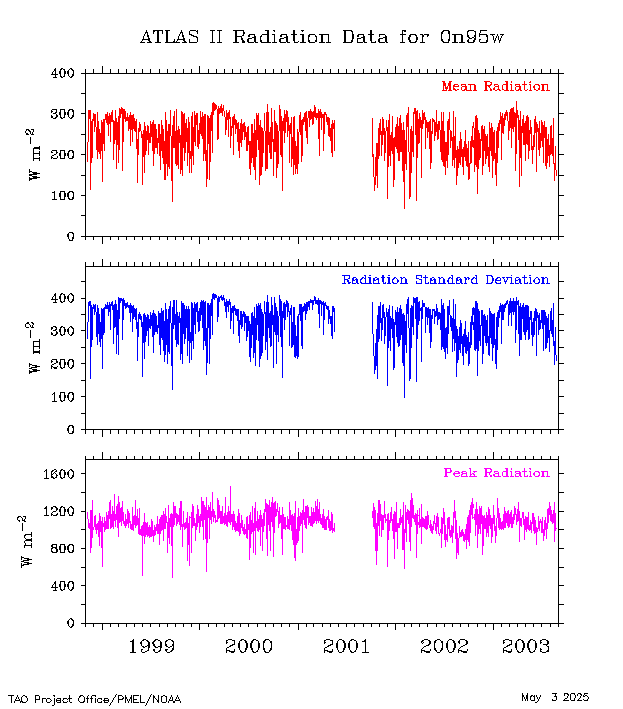
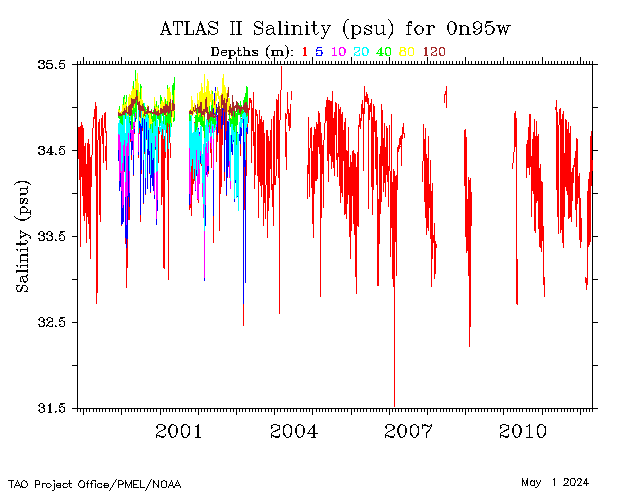
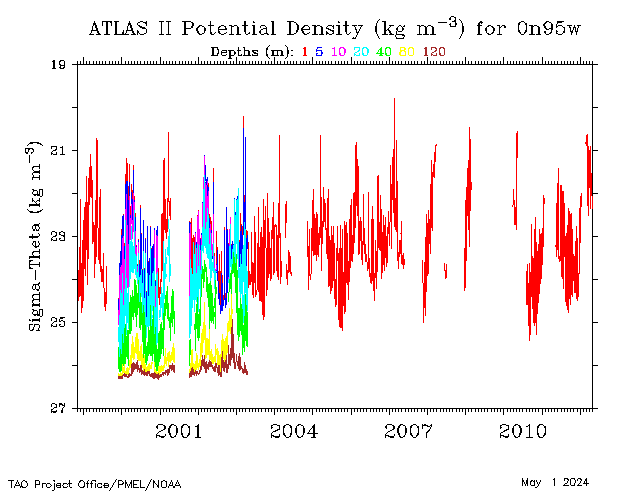
| 0°, 95°W |
 |
 |
 |
 |
 |
 |
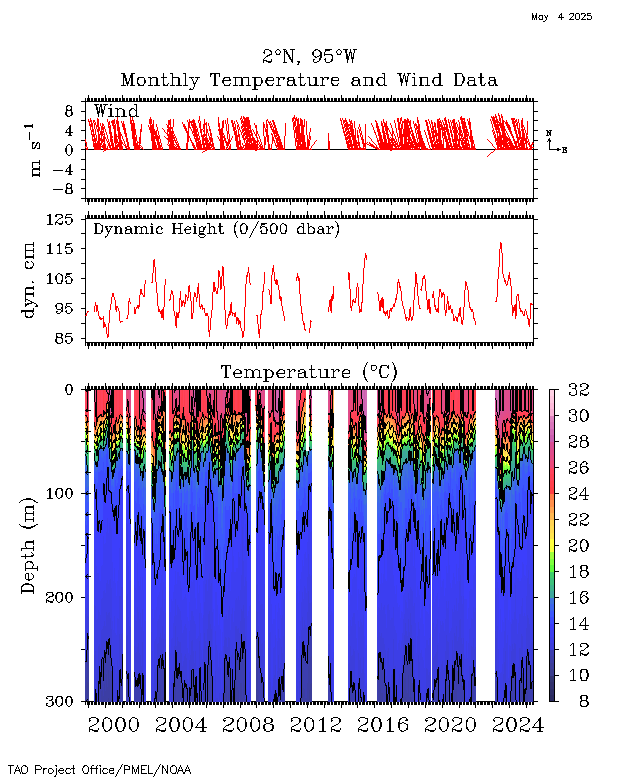
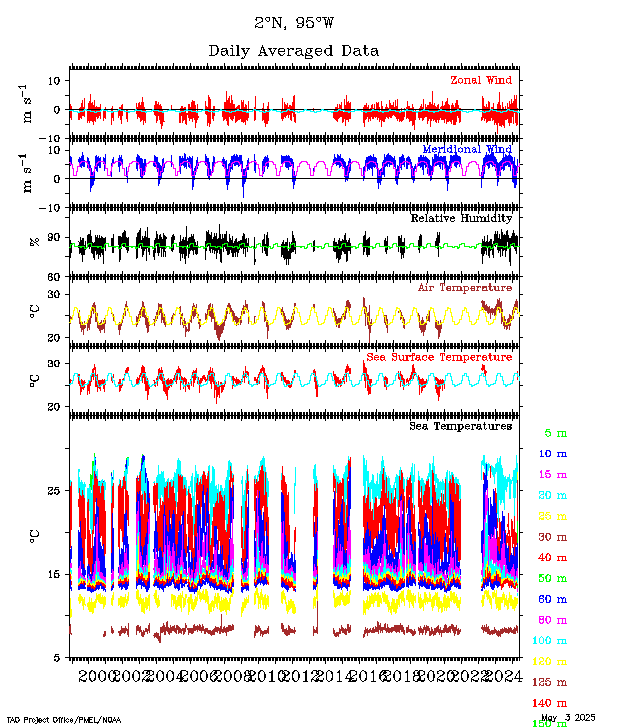
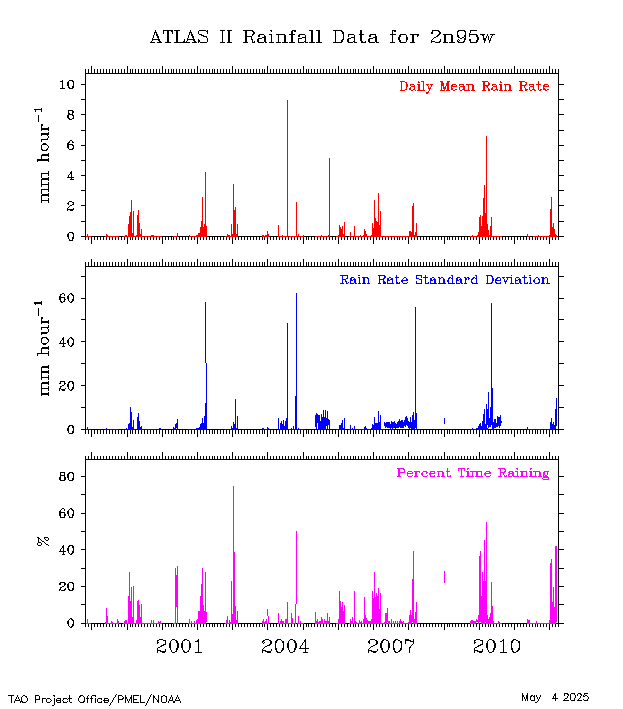
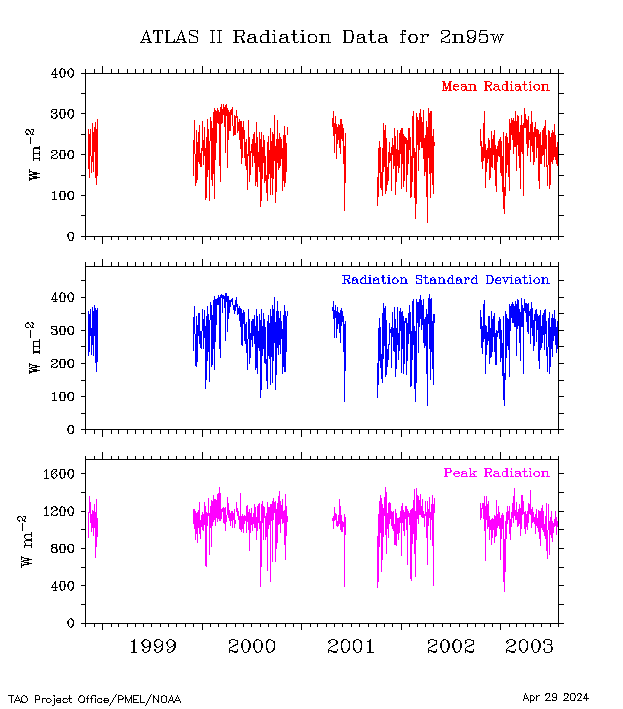
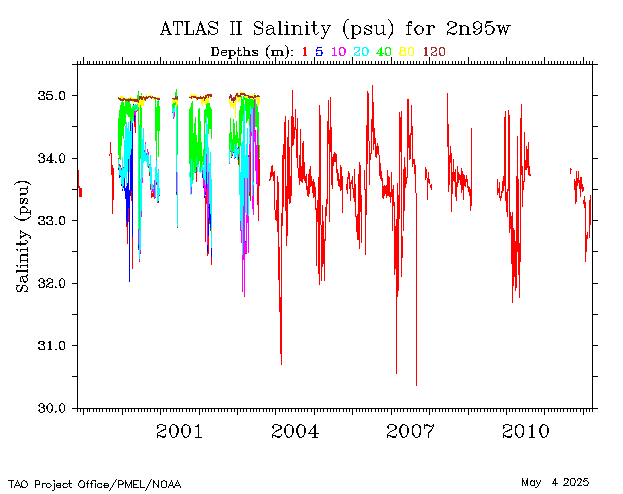
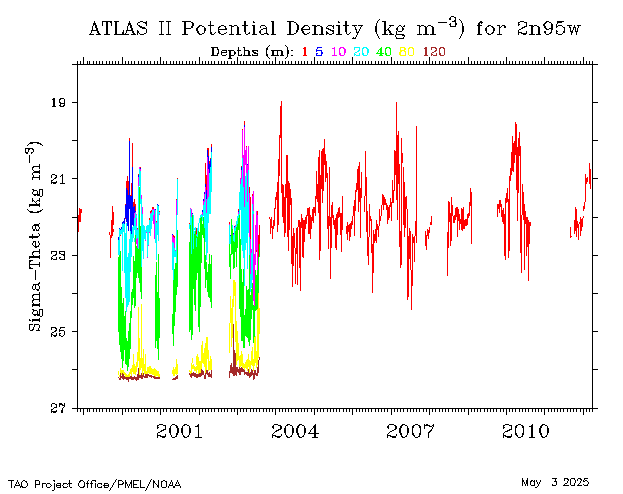
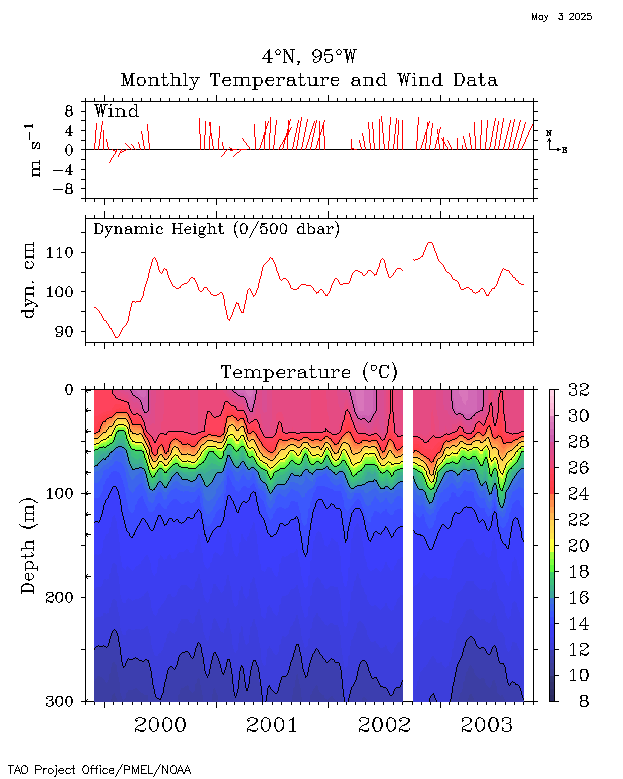
| 2°N, 95°W |
 |
 |
 |
 |
 |
 |
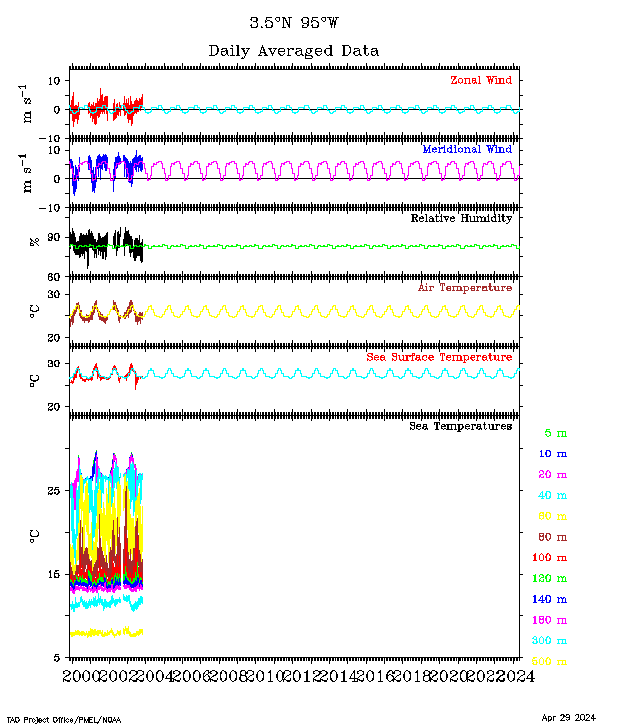
| 3.5°N, 95°W |
 |
 |
 |
 |
 |
 |
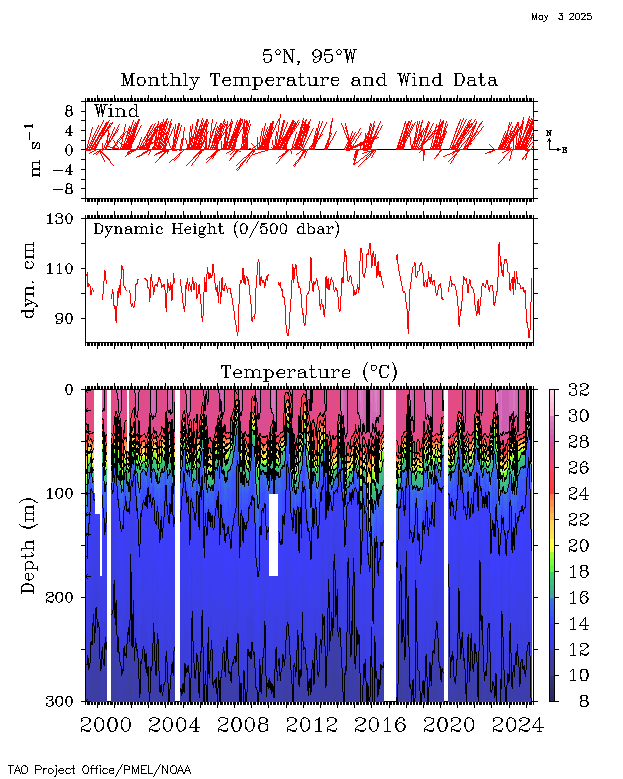
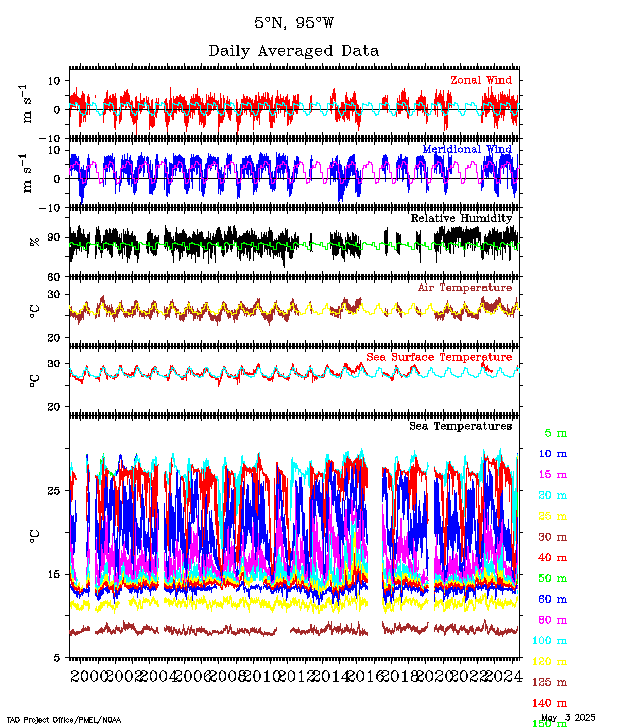
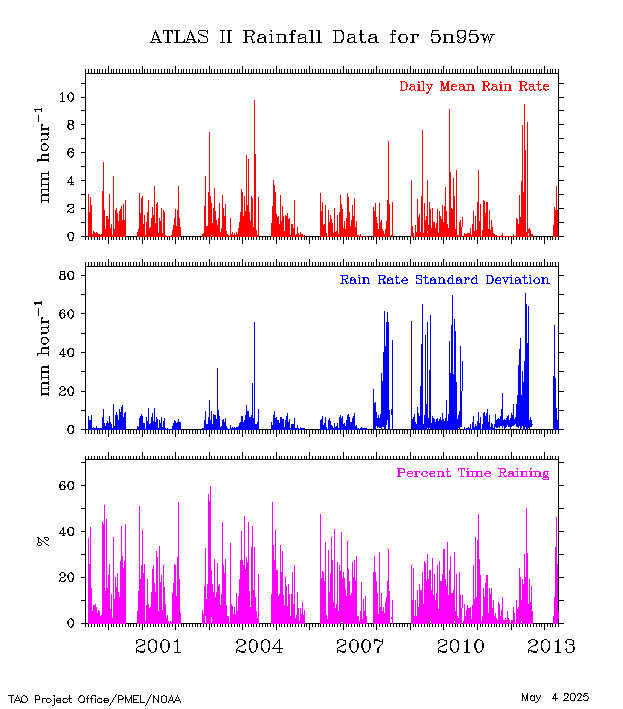
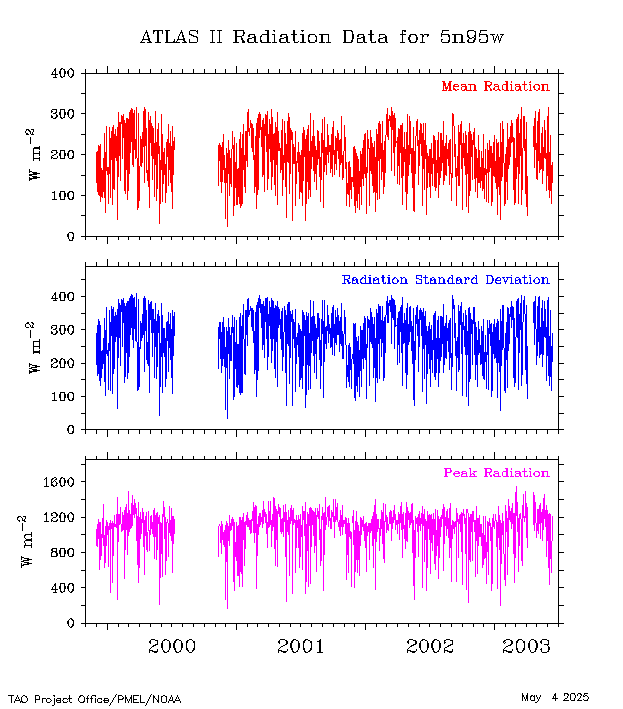
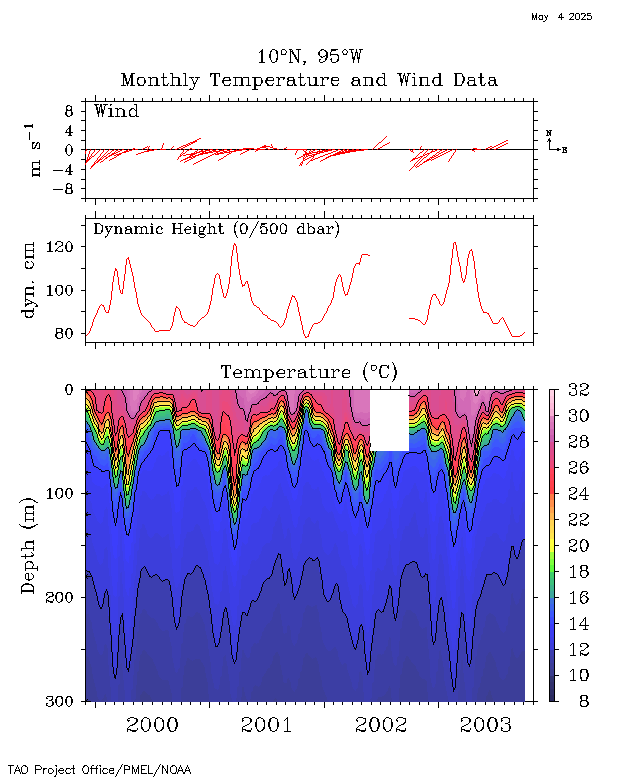
| 5°N, 95°W |
 |
 |
 |
 |
 |
 |
| 10°N, 95°W |
 |
 |
 |
 |
 |
 |
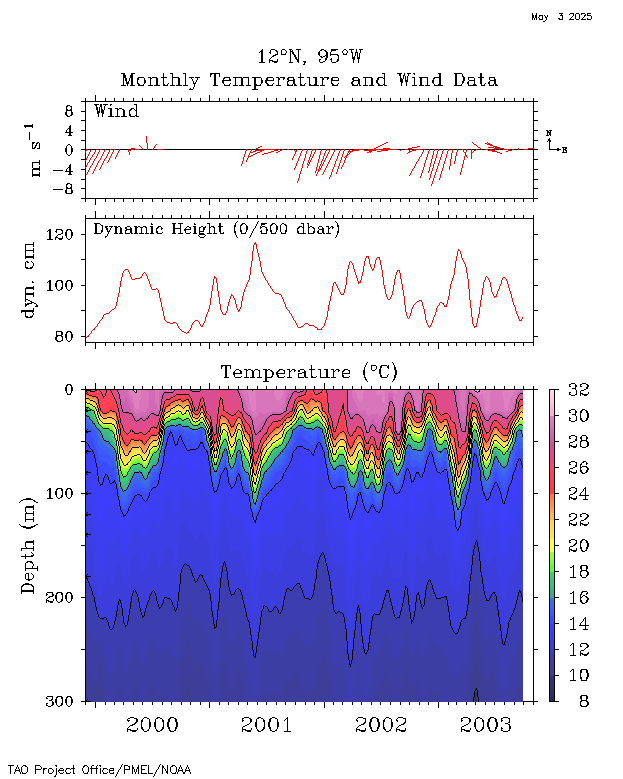
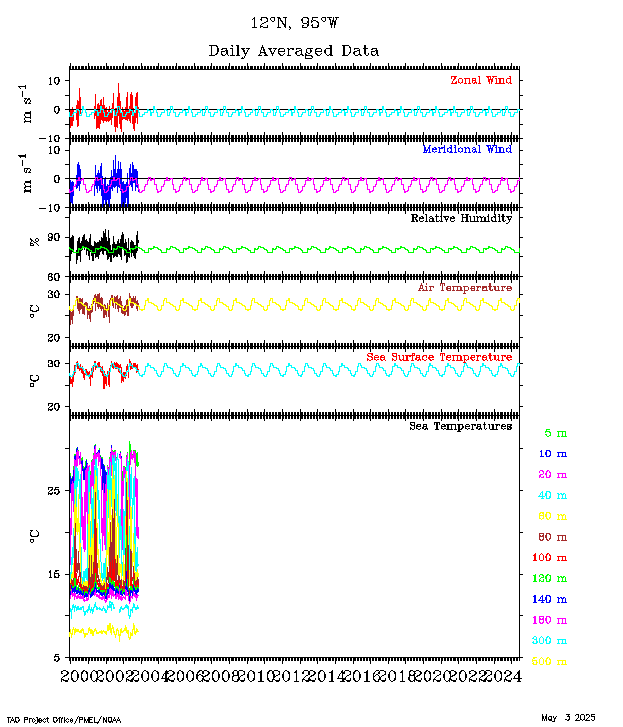
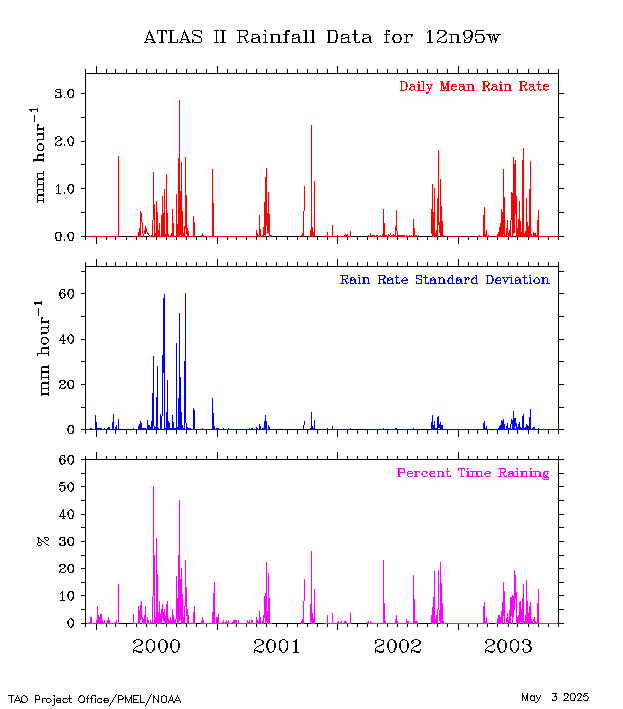
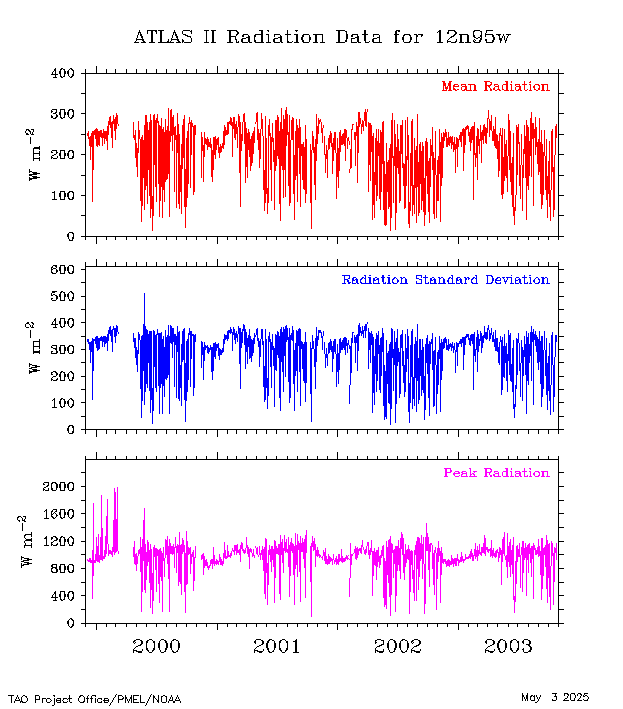
| 12°N, 95°W |
 |
 |
 |
 |
 |
 |
Additional sites with shortwave radiation, rain,
and salinity measurements
(though not currently instrumented) |
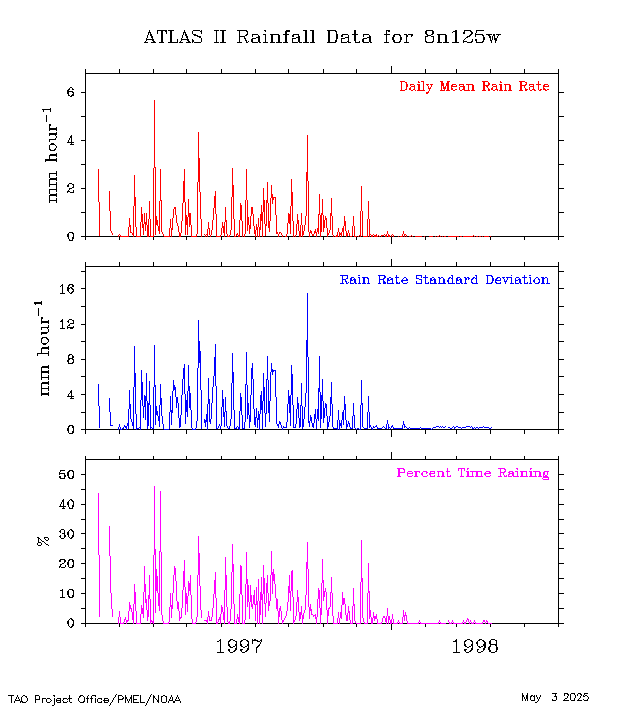
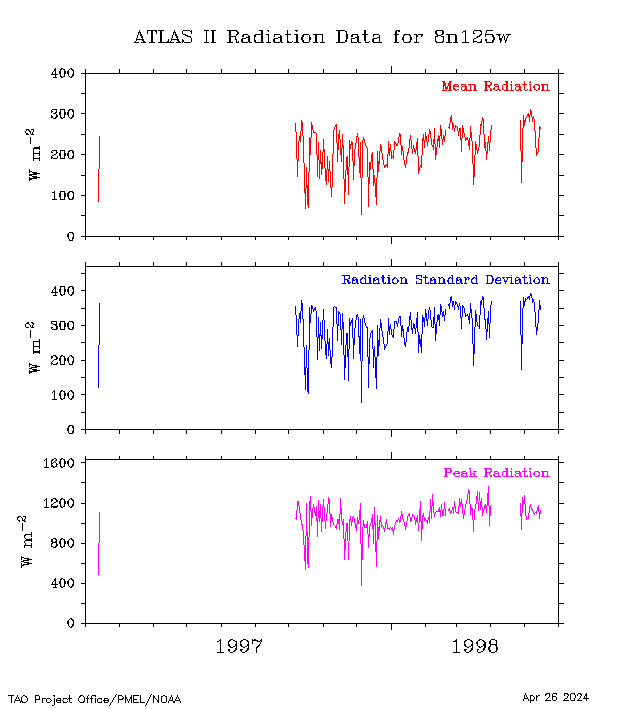
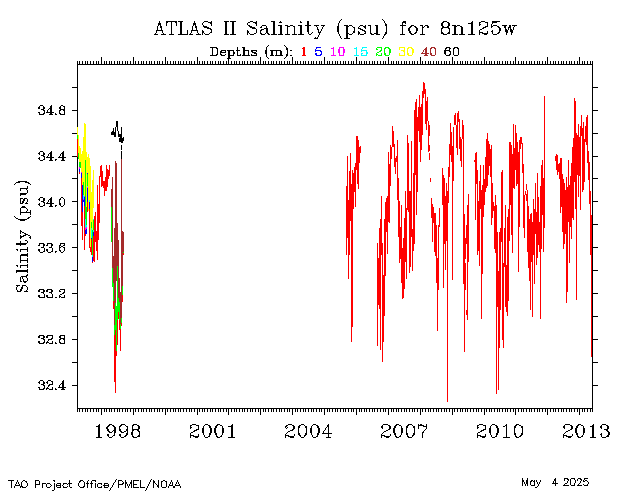
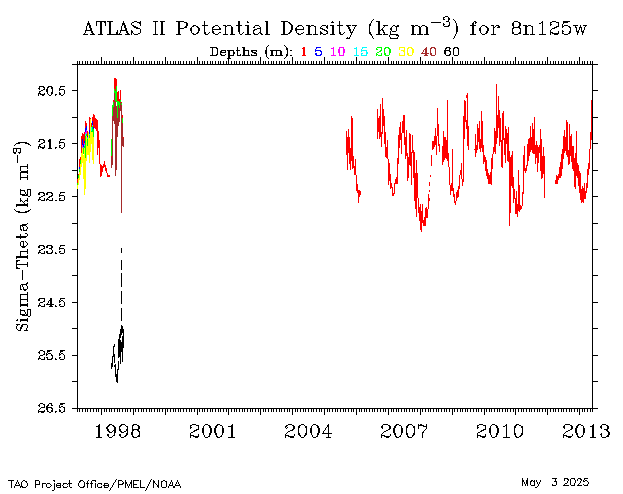
| 8°N, 125°W |
 |
 |
 |
 |
 |
 |
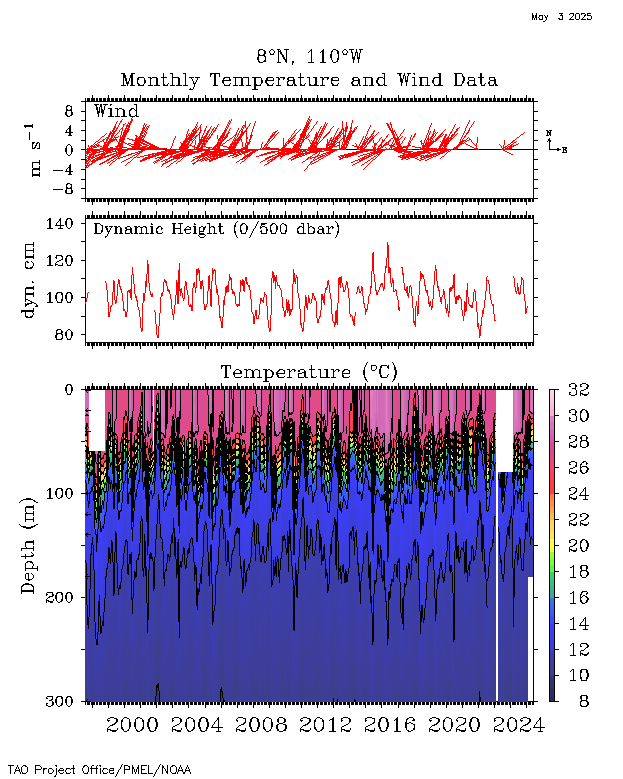
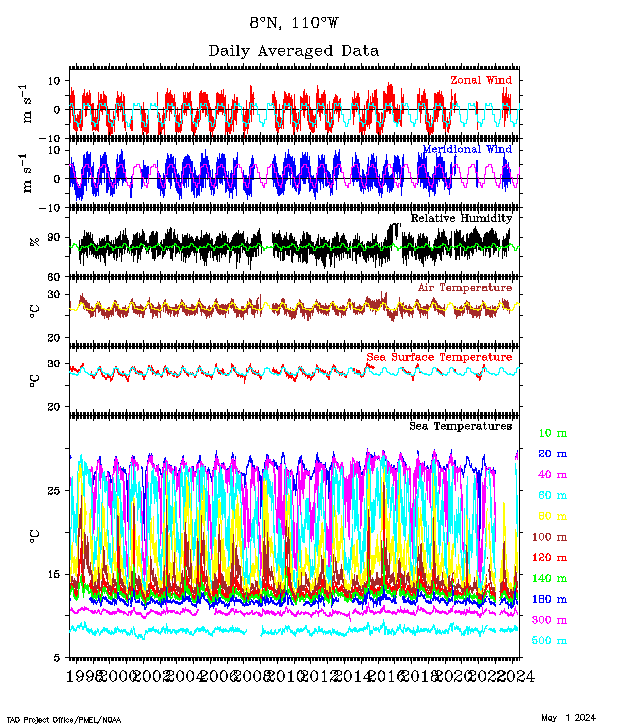
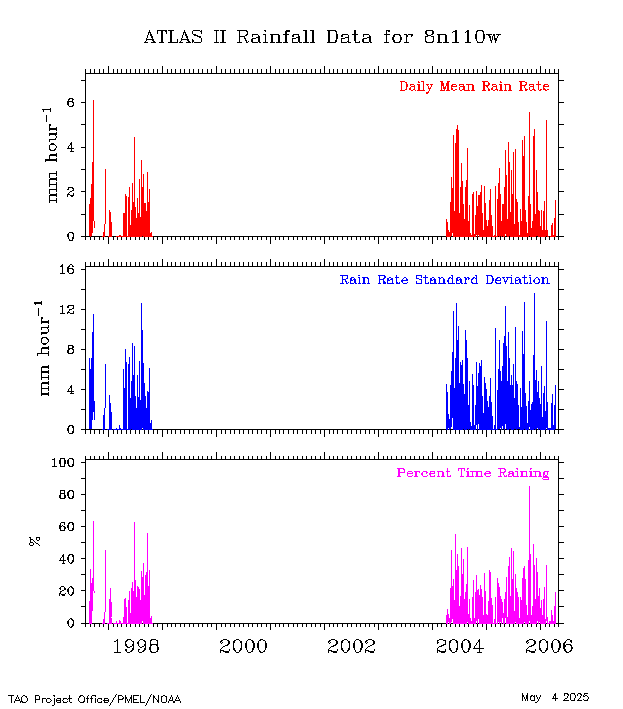
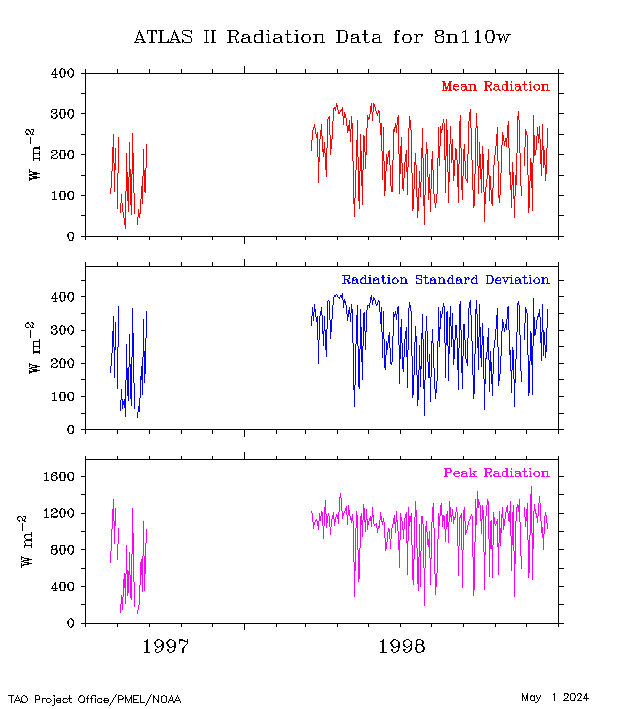
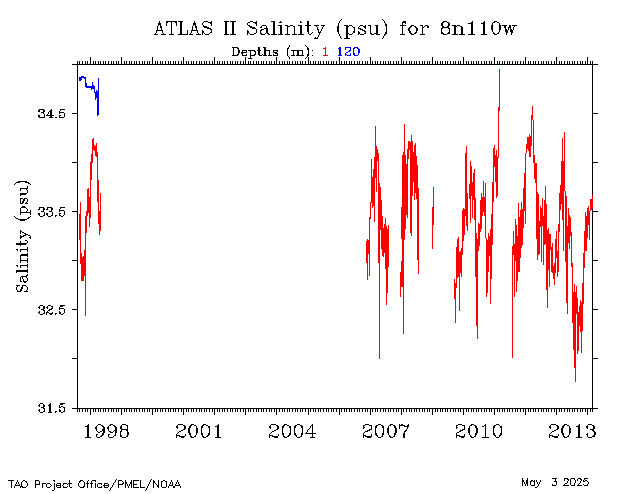
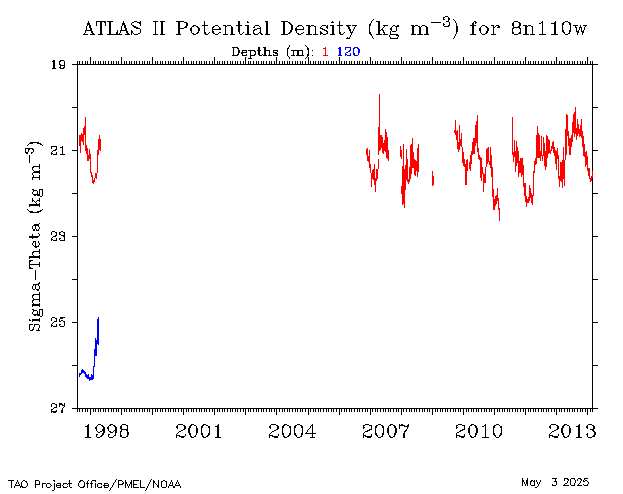
| 8°N, 110°W |
 |
 |
 |
 |
 |
 |
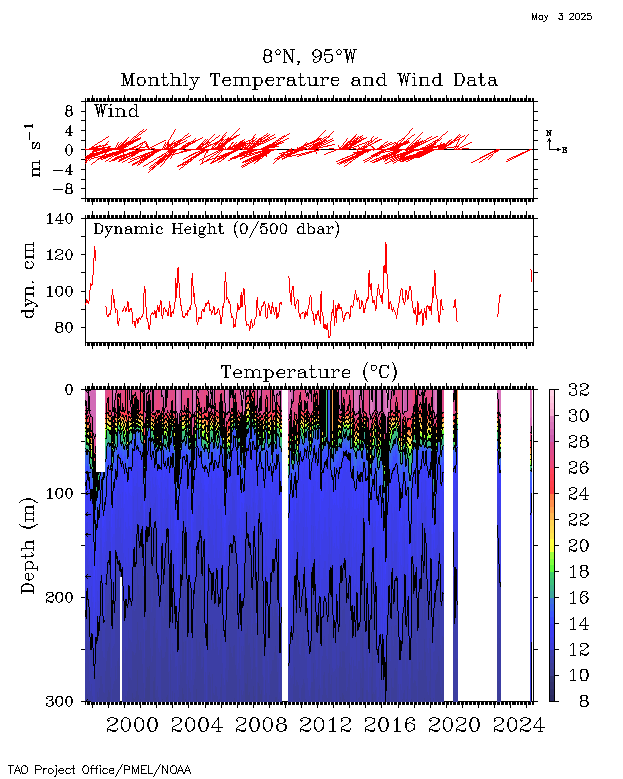
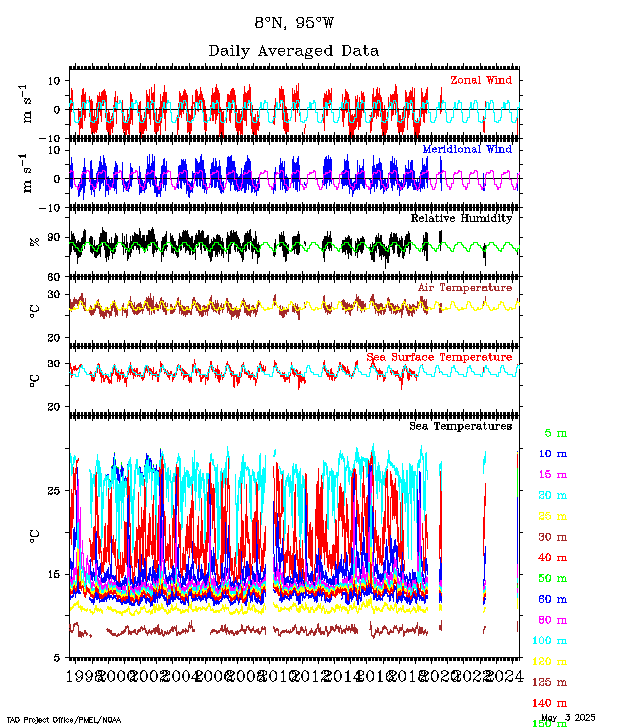
| 8°N, 95°W |
 |
 |
 |
 |
 |
 |
|