
In the southeastern Bering Sea, 2005 was a period of belowaverage seasonal sea-ice coverage and above-average air and water temperatures (Stabeno et al., 2007). In the last 36 years, the mid-1970s had the greatest ice cover in the southeastern Bering Sea (Fig. 2), while the seasonal sea-ice cover in the early 2000s was well below the 36-year mean. The average ice extent over the northern shelf, however, was not markedly different from the earlier "cold" period. This is not to say that there were not differences in ice thickness or spatial patterns of advance and/or retreat (e.g., Grebmeier et al., 2006), but rather in the broadest sense, the areal coverage of sea ice over the northern shelf has not varied on decadal scales. While some of the maxima and minima in the two series are coincident, the overall correlation of areal ice extent between the two areas was not statistically significant (99% significance).
Fig. 2. Average percent ice cover in two bands of latitude, 62–63°N and 57–58°N, that stretch from the coast to the International Date Line and the shelf break, respectively. Averages were calculated from US National Ice Center data for each winter–spring (December, January–May), 1972 through 2005.
During 2005, the maximum southern ice extent reached ~57°N on 11 April (almost a month prior to the spring cruise) with the edge stretching from Cape Newenham across the International Date Line to the Russian Federation (Fig. 3). By the beginning of the cruise (9 May) there had been significant melting of sea ice in Bristol Bay and the southern half of the 70-m isobath transect (Stations 88–118) and the southernmost cross-shelf transect were ice-free. Stations 60–68 in the lee of St. Lawrence Island were also ice-free. As the cruise progressed, the ice-free region to the west of St. Lawrence Island expanded to the southwest. Toward the end of the cruise, the ice barely reached the 70-m isobath stations (Fig. 3c). The eastern portion of the east-west transect located south of St. Matthew Island bordered the ice, but the western portion had been ice-free for several weeks (Fig. 3)
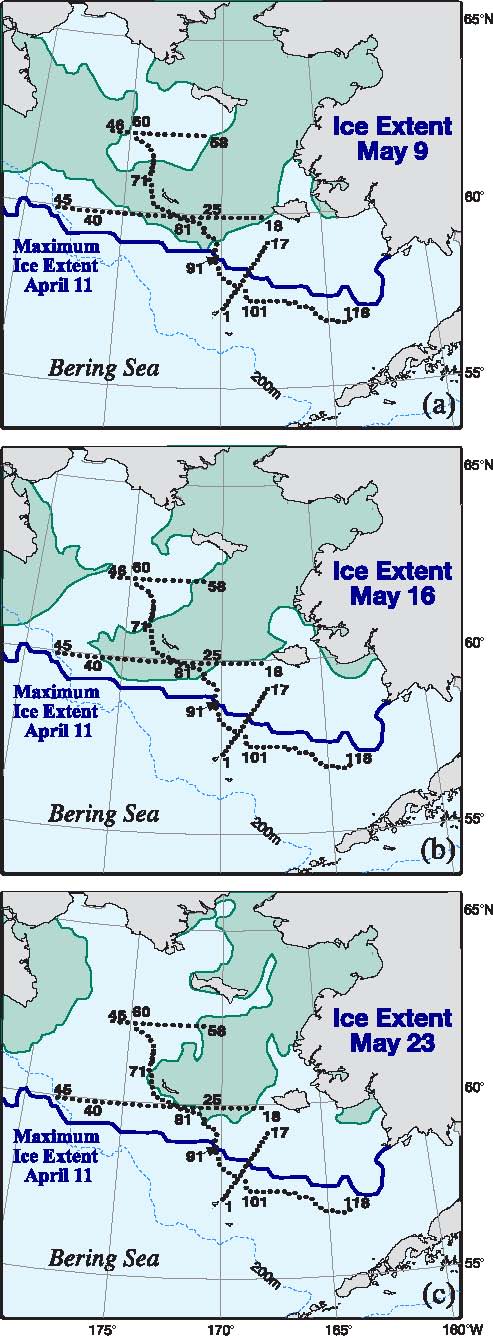
Fig. 3. Spring sea-ice extent during a three-week period in 2005. (a) Ice extent at the start of the cruise, (b) midway and (c) near the end of the cruise. The maximum ice extent was on April 11 and is shown as a thick black. The hydrographic stations for the spring cruise are indicated. The fall cruise occupied the same stations along the 70-m isobath. Moorings M4, M5, and M8 are at the intersection of the crossshelf lines and the 70-m isobath. M2 is at the southern terminus of the 70-m isobath.
The 70-m isobath is at the center of the middle shelf domain, and as such it is characterized by a two-layer structure during the late spring and summer, with ice playing an important role in determining its temperature and salinity. Our horizontal resolution of small features was limited by ~20 km station separation. The southern part of the 70-m transect was ice free the entire winter and spring of 2005, while over the northern portion the ice had retreated just the week prior to sampling. Maximum ice extent was near Station 91 (Fig. 3). As a result the water was warmer south of Station 91 than north of it (Fig. 4). There was a front (a change of ~2°C and 0.4 psu over a distance of ~40 km) between the fresher, colder northern waters and the more saline, warmer southern shelf waters. While the front persisted into September, its location migrated northward ~150 km, as did southern boundary of the cold pool (bottom water <2°C; Fig. 5). In September, the northern and southern regions of the middle shelf were distinguished by surface salinity, not surface temperature, and by bottom temperatures (Figs. 4 and 5).
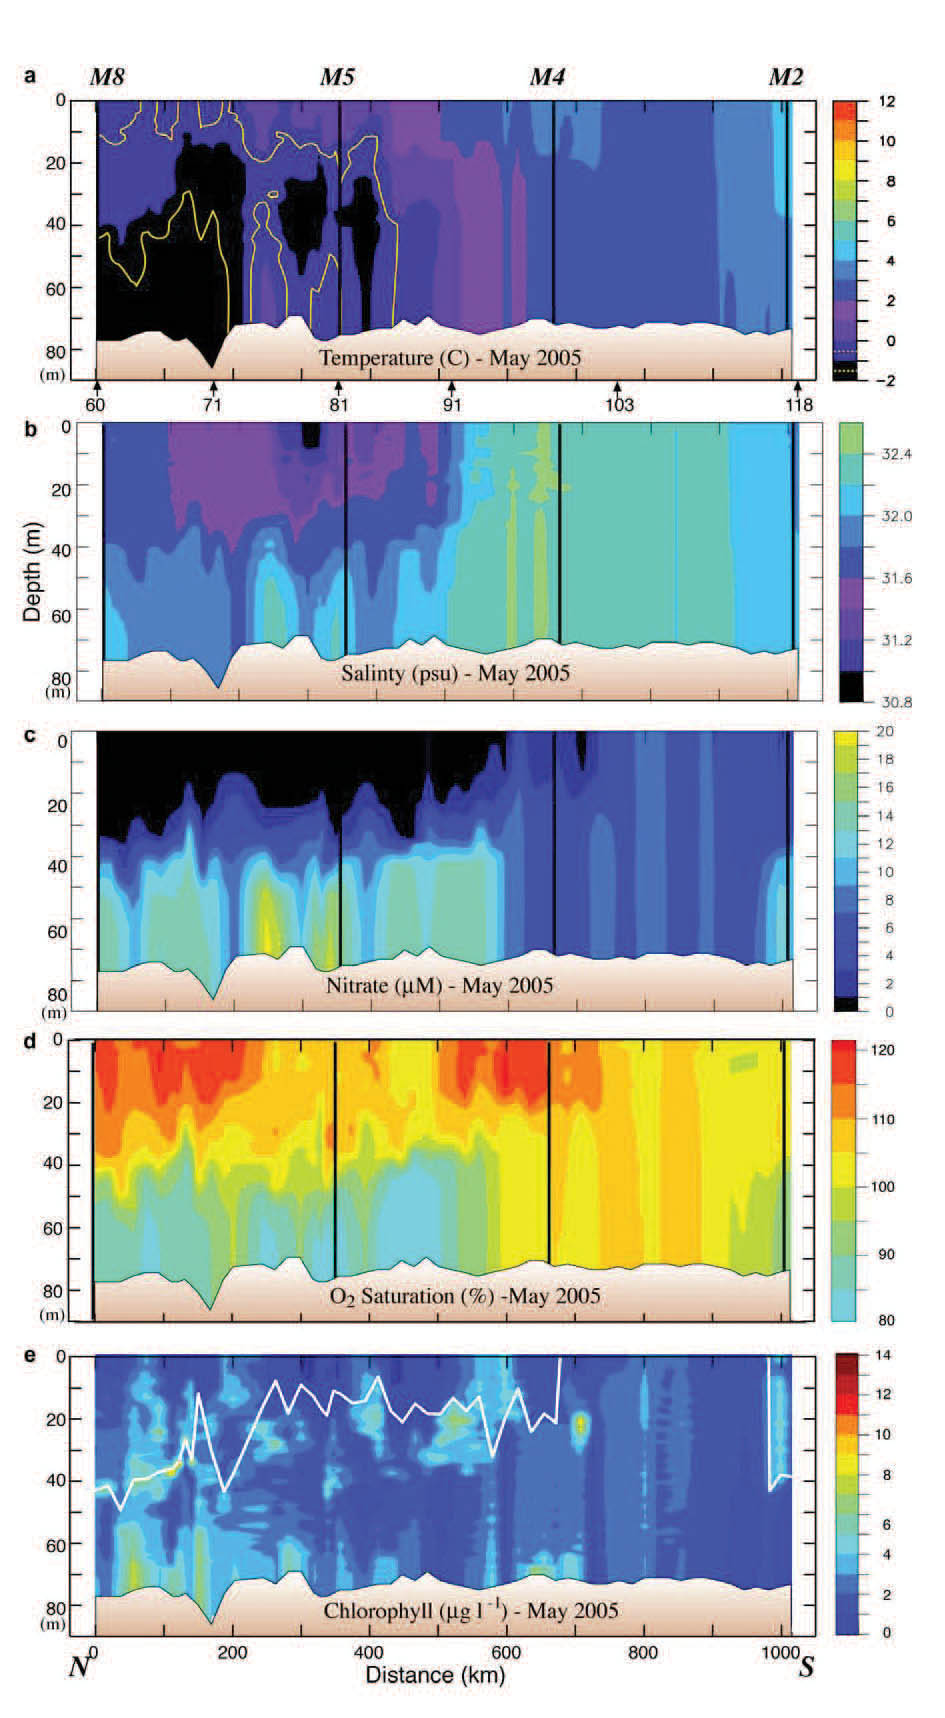
Fig. 4. Data collected along the 70-m isobath during the May 2005 cruise. The y-axes are depth. (a) Temperature, (b) salinity, (c) nitrate, (d) percent oxygen saturation and (e) chlorophyll. The vertical black lines indicate the position of the moorings. The distance between stations was ~20 km. The locations of specific stations are indicated at the bottom of the top panel. Nitrate was measured every ~10 m and at the bottom of each hydrographic cast. Since the stratification in the top panel was relatively weak, the 1°C isotherm is shown in yellow, and the −1°C isotherm is shown in white. The white line in the bottom panel is the mixed-layer depth (defined as the depth at which the temperature had decreased by 0.2°C).
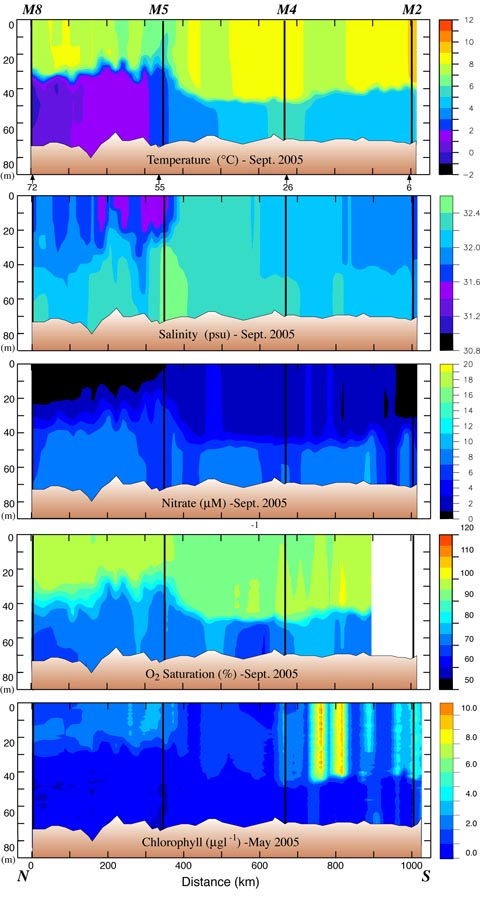
Fig. 5. Data collected along the 70-m isobath during the September 2005 cruise. The y-axes are depth. (a) Temperature, (b) salinity, (c) nitrate, (d) percent oxygen saturation and (e) chlorophyll. The black lines indicate the position of the moorings. The distance between stations was ~20 km. The locations of specific stations are indicated at the bottom of the top panel. Nitrate was measured every ~10 m and at the bottom of each cast.
During May, the vertical stratification south of the maximum ice extent was very weak, while north of maximum ice extent, stratification was stronger and almost totally a result of salinity (Fig. 6a). The greatest density difference between near-surface waters (5 m) and near-bottom waters (65 m) was found at x = ~300 km, where the ship sampled along the ice edge. While the density difference between 5 and 65 m was largest along the ice edge, the gradient was significant throughout the water column (Fig. 6b). By September, this pattern had changed markedly; the density difference between the top and the bottom of the water column was greatest over the northern shelf, where temperature and salinity contributed almost equally to the vertical density difference (Fig. 6c). The difference between the near-surface and near-bottom density over the southern shelf was mostly due to temperature. Along the portion of the 70-m isobath south of St. Matthew Island (~400 km in Fig. 6c) the stratification was limited to an extremely sharp interface at a depth of 40–50 m evident in the Brunt-Väisälä frequency (Fig. 6d), while the portion north of the island, the interface was more diffuse, with greatest gradient in density occurring at ~30 m (Figs. 5 and 6). The horizontal change in the intensity of the Brunt-Väisälä frequency (Fig. 6b and d) coincides with the front between northern and southern parts of the shelf.
Fig. 6. Panels a and c: Sigma-t along the 70-m isobath at 5 m and at 65 m. The rose shaded area indicates the portion of difference between the near-surface and near-bottom densities that resulted from just salinity and the gray-green shade indicates the portion that resulted from temperature. Panels b and d: Contours of the Brunt-Väisälä frequency along the 70-m isobath in May and in September.
The maximum extent of ice in spring sets up chemical and biological fronts as well as physical fronts. The timing of the spring phytoplankton bloom is dependent upon the flux of solar energy, the presence/absence of ice, and the onset of water-column stratification. Along the northern portion of the 70-m isobath transect, a bloom had already occurred before the May cruise, with the highest spring chlorophyll found below the mixed layer and/or near the bottom (Fig. 4). The surface layer was depleted of nitrate and supersaturated with oxygen. The bottom layer was replete with nitrate, and had some of the highest concentrations of chlorophyll observed on the transect, while dissolved oxygen was under-saturated. This suggests that a significant fraction of the spring new production had sunk to the bottom, avoiding immediate consumption by micro- and mesozooplankton in the upper water column. The association of this bloom with ice will be discussed later using data from the moorings.
Historically, nitrate concentrations over the southern portion of the middle shelf prior to the spring bloom are 15–20 μM (Stabeno et al., 2002). The nitrate concentration in spring 2005 was approximately half that (the other macro-nutrients were similarly reduced), indicating that new production had already begun drawing down the nutrients even though the water column did not exhibit physical stratification. At the southernmost extent of the transect the water column was beginning to stratify and new production was occurring, as evidenced by declining nitrate concentrations and increased chlorophyll (Figs. 4 and 5). The timing of the blooms is discussed in more detail in the section on time series.
During late September, nitrate depletion was observed in the surface mixed layer at the northern end of the transect, but the region of depletion was smaller than observed in the spring. Because chlorophyll was low and oxygen was under-saturated, nitrate depletion in the north was most likely a remnant of spring and summer production. To the south of M5, nitrate concentrations were slightly higher (>1 μM), but chlorophyll and oxygen saturation remained low, suggesting low levels of new production. One exception was a region between M4 and M2 where temperatures were slightly cooler and chlorophyll concentrations were the highest observed in September. This would be consistent with a recent mixing event that introduced colder, nutrient-rich bottom water into the euphotic zone, promoting new production (Sambrotto et al., 1986). Historically, this portion of the 70-m isobath has shown considerable small-scale (~20 km) spatial variability (Stabeno et al., 2002). In addition, oxygen was not supersaturated (except at one station), suggesting that the rates of exchange with the atmosphere were high and/or primary production had recently increased, perhaps representing the early stages of the fall bloom at this locale (the fall bloom at M2 began in August, discussed below).
In September 2005, while ammonium concentrations in the upper water column of the 70-m isobath transect were low, concentrations in the bottom layer often exceeded 8 μM (Fig. 7). It has been previously observed that ammonium concentrations over the middle shelf have strong seasonal dependence and can be extremely high during the summer (Whitledge et al., 1986; Mordy et al., 2008; Rho et al., 2005). The high nitrite concentrations (often >1 μM) that we observed, however, have not been previously reported. The high nitrite concentrations observed in a few stations south of M5 were coincident with a comparable decrease in ammonium of ~2 μM. Nitrite concentrations in the world's oceans are almost always <1 μM and those observed in 2005 in the Bering Sea are comparable to concentrations observed in oxyclines of the equatorial Pacific Ocean. Nitrite is an intermediate formed during nitrification (the oxidation of ammonium to nitrate). High nitrite coincident with decreasing ammonium in well-oxygenated water suggests a decoupling of the oxidation steps associated with nitrification. While there are not enough data to develop a robust hypothesis on why such high concentrations of nitrite occurred in 2005, these unusual concentrations are an indication that the microbial ecosystems were perturbed in late summer 2005.
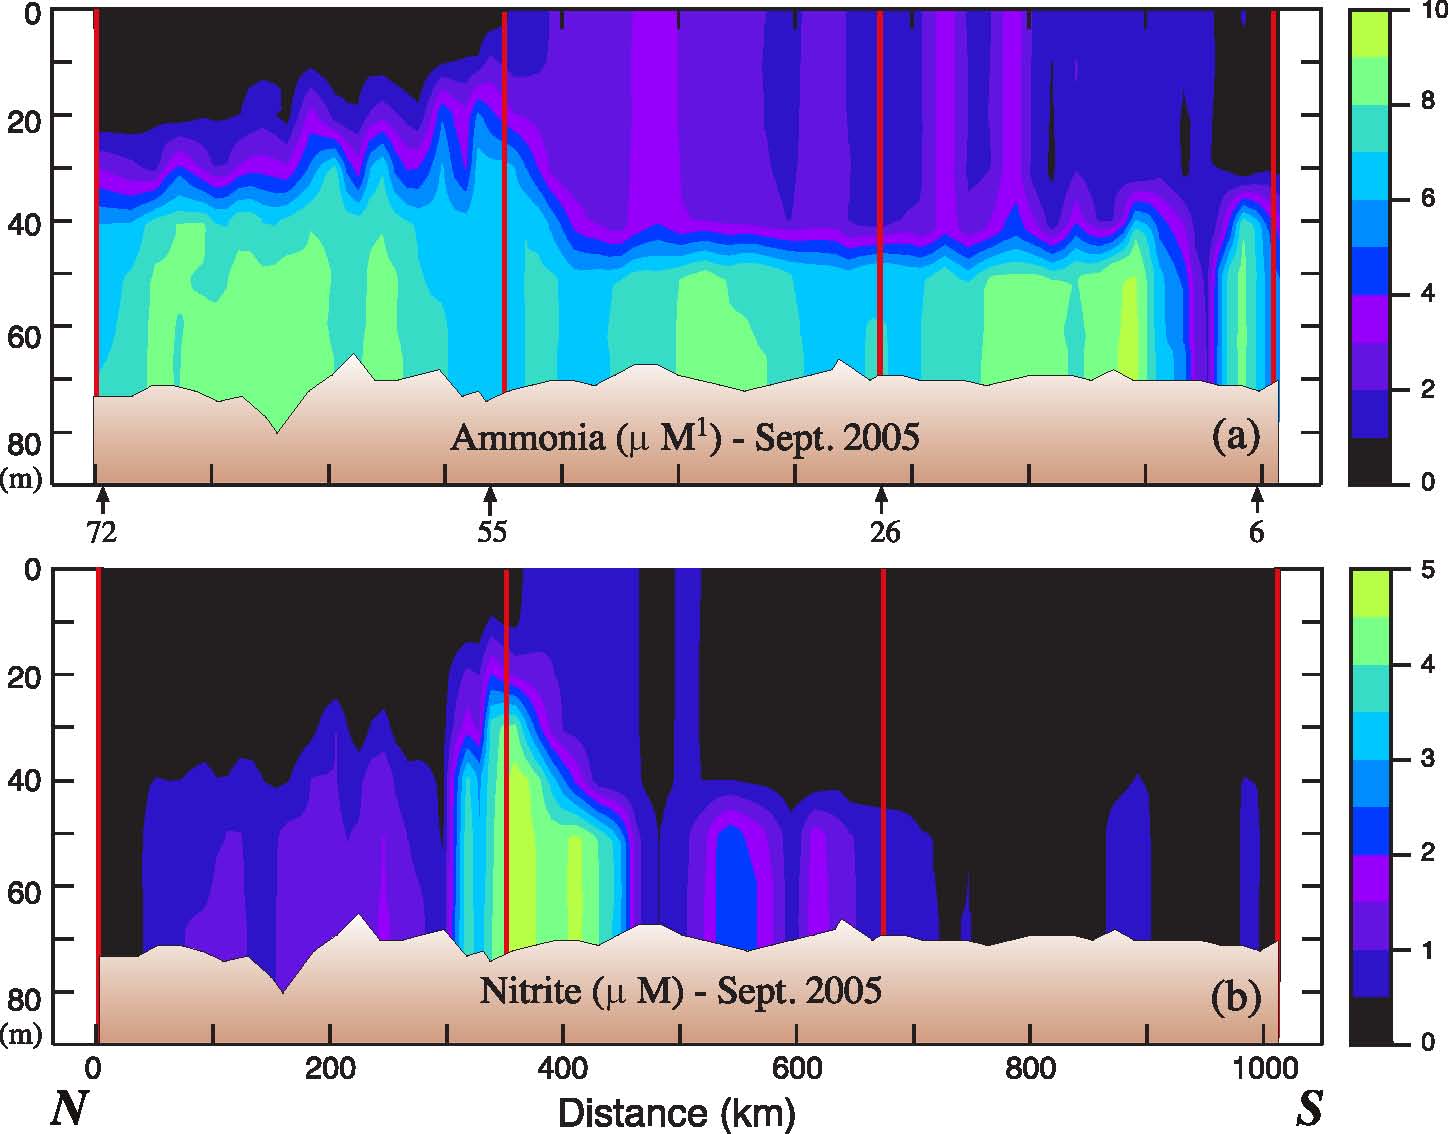
Fig. 7. (a) Ammonium and (b) nitrite in September 2005 along the 70-m isobath. The y-axes are depth. The vertical red lines indicate the position of the moorings.
In the spring and late summer, there were also differences in the community composition of zooplankton between the two regions as sampled by both the fine and coarse mesh nets (Fig. 8). In the spring, the contribution of Acartia spp. to total abundance was higher at the northernmost stations than at the southern stations. The five northern stations were also notable for the percent of total abundance contributed by chaetognaths (two stations) and barnacle nauplii (Cirripedia, two stations). These first five stations coincided with the area of very cold ocean temperatures ( 1°C, Fig. 4). Between 200 and 600 km, the community was dominated by Pseudocalanus spp. copepodites (
 70% total). At the last two stations along the transect, the percent of total abundance contributed by larvacea increased and Pseudocalanus spp. decreased. Throughout the transect, the relative contribution of copepodites of Calanus marshallae was small, with the highest concentrations of this important species found at the southern edge of the very cold region (not shown). Of the organisms enumerated from coarser mesh nets (333 μm), chaetognaths were relatively more important in the north than the south and Anomura (crab larvae), Neocalanus spp. and fish larvae contributed more to the total abundance in the south than the north (not shown).
Fig. 8. Percent total abundance of common zooplankton along the 70-m isobath. (a) spring, (b) late summer. A single sample was obtained at every other station along the isobath during spring, but in the late summer, replicate samples were obtained at the mooring site and at four stations forming a square around the mooring site (total of five stations). The exception is at M8 where a storm forced us to end operations early. A single sample was collected at that mooring site.
In September, the percent contribution by different taxa was more similar between north and south than during the spring. The small cyclopoid copepod Oithona spp. dominated the numerical abundance of the small mesh catch, constituting 27–84% of the total at each site (Fig. 8). The contribution of early stage copepodites of Pseudocalanus spp. was low at M8, increased at M5 and then decreased at the two southern sites. The contribution of Cladocera was higher at mooring M2 than anywhere else. Larvacea contributed less to the total abundance at the southern stations in the late summer, than they did in the spring.
Our conclusions regarding the zooplankton community were based on the number of organisms, which is biased toward the small, most numerous plankters. The larvae of benthic organisms were relatively more important in the northern portion than in the southern part of the transect during spring, perhaps due to the proximity of a source of benthic invertebrates from the shallower waters surrounding the islands of St. Matthew and St. Lawrence. Coyle and Pinchuk (2002a) also observed significant contributions by benthic larvae to their 1999 plankton collections on a transect from Nunivak Island to the middle shelf domain. The relative abundances of Acartia and Pseudocalanus in the two regions during our study is harder to explain, although Acartia often is very abundant in coastal estuaries with low salinity and is important in the coastal domain. Chaetognaths which prey on small copepods can be very abundant in the eastern Bering Sea and their populations appear to respond to climate forcing (Baier and Terazaki, 2005). Why they should be relatively more important in the north during spring is unclear. The spring concentrations of C. marshallae along the 70-m isobath transect were generally low, with the highest values (9–14 m−3) occurring at the three most southern stations. C. marshallae has arctic affinities, although it is found as far south as ~40.5°N in the cooler waters in the upwelling region of the northwest coast of North America (Frost, 1974; Peterson et al., 1979). In the eastern Bering Sea, its springtime abundance is related to an early spring bloom and cold water/ presence of sea ice (Baier and Napp, 2003). The individuals observed in the southeastern Bering Sea may have been advected through Unimak Pass where the Alaska Coastal Current passes from the Gulf of Alaska to the eastern Bering Sea (Stabeno et al., 2002). If the Bering continues to warm, Unimak Pass may be an important passageway for the "invasion" of more temperate species.
The southern middle and coastal domains of the eastern Bering Sea are often dominated by small copepods such as Pseudocalanus, Acartia, and Oithona (Cooney and Coyle, 1982). The smaller copepodite stages of the latter two were undersampled by our choice of net mesh. Historically, C. marshallae and the euphausiid Thysanoessa raschii were important contributors to the plankton biomass on the middle shelf (Coyle and Pinchuk, 2002b; Smith and Vidal, 1986; Smith, 1991). Recent cruises over the middle shelf have observed declines in the abundance of these two species that are important prey for planktivorous seabirds, fish, and marine mammals (Coyle et al., 2008; Hunt et al., 2008). The recent warm period in the Bering Sea (2001–2005) may have affected the community composition, particularly in late summer, although there are few data with which to compare. The occurrence of a community dominated by small copepods that occurred throughout the uniformly warm surface layer along the 70-m isobath could have more to do with the absence or loss of larger taxa, than an increase in standing stock of smaller taxa.
The cross-shelf variability of the hydrographic, nutrient, and chlorophyll properties was assessed on three transects during the spring cruise (Fig. 3). Each transect intersected the 70-m isobath at one of the mooring sites (M4, M5, and M8). The character of the coastal and middle domains was similar in the three cross sections, but only the middle transect crossed into the outer domain. Because of this we will focus on this middle transect which was south of St. Matthew Island (Stations 18–45).
During the May cruise, the coastal domain on the St. Matthew Island transect extended out to the ~60-m isobath as evidenced by complete mixing of the water column (Fig. 9). Nitrate had been stripped from the entire water column and chlorophyll values were low. In addition, the water column was supersaturated in dissolved oxygen. These observations are consistent with the spring bloom already having occurred in the coastal domain.
Fig. 9. Hydrographic section along the St. Matthew Island transect during the May 2005 cruise: (a) temperature, (b) salinity, (c) nitrate, (d) percent oxygen saturation and (e) chlorophyll. The y-axes are depth. The domains are indicated at the top of the plot and the locations of specific stations are indicated at the bottom of each panel. Nitrate was measured every ~10 m and at the bottom of each cast.
The middle shelf had a well-defined two-layer structure in salinity and nutrients, but not in temperature (top panel, Fig. 9). The temperature of the shallower portion of the middle domain was colder ( 1°C) than the coastal domain. Oxygen was supersaturated in the surface layer, while nutrients were largely depleted there. In the bottom layer over the middle shelf, lower concentrations of oxygen coincided with an area of slightly elevated chlorophyll. This is consistent with a bloom having already occurred in the surface layer, with portions falling to the benthos. The bottom layer retained significant concentrations of nitrate. In the surface, there was a band of higher nitrate concentrations (6–10 μM) between the depleted waters of the coastal and middle shelf domains (the inner front). This is consistent with observations made farther south at the inner front during previous summers (Kachel et al., 2002). In this frontal region of relatively weak vertical stratification and strong tidal mixing, nutrients from the bottom layer of the middle shelf were mixed upward into the euphotic zone. These processes can result in intermittent production throughout the summer along of the inner front (Jahncke et al., 2005).
The outer domain was characterized by weaker thermal stratification, higher salinity, and slightly warmer temperatures. There were two maxima in chlorophyll: the highest chlorophyll was associated with the offshore edge of the surface, nitrate-depleted zone, a second area of elevated chlorophyll was farther offshore in 140 m of water. Both of these patches of high chlorophyll were associated with water that was supersaturated in dissolved oxygen and slightly reduced nitrate concentrations, indicative of on-going new production.
Go to Next section