U.S. Dept. of Commerce / NOAA / OAR / PMEL / Publications
Using observations from 38 ichthyoplankton surveys conducted near Shelikof Strait, Alaska between 1979 and 1992, we characterized the horizontal distribution and spatial patchiness of the early life stages of walleye pollock (Theragra chalcogramma). Lloyd's index of patchiness ranged from 3.9-6.1 for eggs and 3.9-16.2 for larvae. This index was size (age) dependent: low for eggs, high for newly hatched larvae, then decreasing through late larval stage. By the early juvenile stage, patchiness increased as pollock began to school. The percentage of larvae in a patch (defined as the percentage of larvae present at stations where larval counts exceeded the mean by one standard deviation during the given survey) varied greatly (26-92%). Larval distributions were used to deduce physical mechanisms responsible for patches. Three categories of patches were identified: those created by interaction of larvae with time-dependent currents, those in the vicinity of Sutwik Island, and those associated with eddies. Simulation experiments were utilized to examine processes influencing patch formation and the role of larval swimming. Between 5 and 6 weeks after hatching, larvae have swimming abilities that enable them to maintain a patch already created by physical mechanisms.
Plankton occur in aggregations or patches on a continuum of scales. These features are dynamic, continually responding to temporal and spatial changes in the physical processes that create, maintain and disperse them. The transport of phytoplankton by subtidal currents influences the degree of patchiness (Eppley et al., 1984). Tidal currents can deform the shape of larval patches (Levasseur et al., 1983), and internal tidal bores off southern California transport larvae shoreward (Pineda, 1991). Mesoscale physical features (e.g., fronts, eddies, and meanders) often create boundaries between water types associated with aggregations. For example, in the eastern Bering Sea, frontal systems result in distinct plankton and higher trophic level communities (Kinder et al., 1983; Smith and Vidal, 1986) and regions where zooplankton and their predators aggregate (Coyle and Cooney, 1993). Wind-driven flow and its interaction with topographic features influences the degree of patchiness found on the Great Barrier Reef (Willis and Oliver, 1990). In Shelikof Strait, fronts influence plankton distributions (Brodeur et al., 1996a, see pp. 71-80 in this supplement; Napp et al., 1996, see pp. 19-30 in this supplement) and high concentrations of larval pollock often are associated with eddies (Schumacher et al., 1993; Vastano et al., 1992). The dominant physical mechanisms that cause patches depend on the life style of the organism and the nature of the oceanography in the region.
We focus on the horizontal patterns (scales of tens of km) of the early life stages of walleye pollock (Theragra chalcogramma) in the western Gulf of Alaska (Fig. 1). Data from 38 ichthyoplankton surveys conducted on the shelf in and to the southwest of Shelikof Strait (1979-1992) provide the observations for this paper. Statistics of patchiness are examined using Lloyd's index (Lloyd, 1967), and an estimate of the percentage of larvae per survey in patches is made. Characteristics of larval patterns help to establish the physical processes that create and maintain the patches. As larvae develop, their improving ability to swim adds a behavioral aspect that can influence patch dynamics. This aspect is examined using an analytic model that balances effects of diffusion with swimming ability.
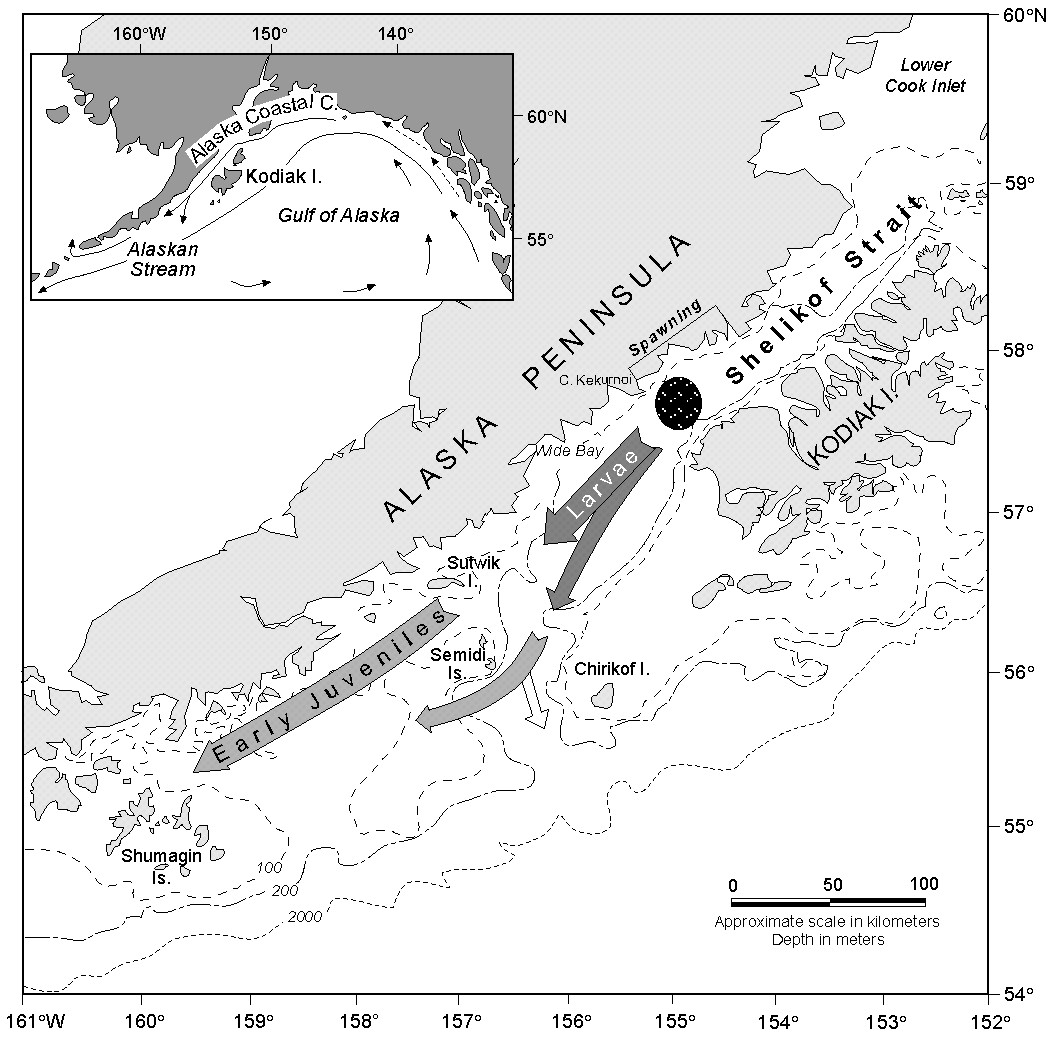
Figure 1. The study area in the western Gulf of Alaska with a schematic of pollock location as a function of life history stage. The sea valley extends southwestward from the northern end of Kodiak Island to the vicinity of Sutwik Island where it turns south toward the continental slope. The insert shows the location of the Alaska Coastal Current and the Alaskan Stream.
A large concentration of adult pollock aggregates each March over the deep sea valley to spawn (Fig. 1). Eggs are found in the bottom 50 m near the spawning location in early April; by late April or early May the eggs hatch and the larvae drift southwestward toward Sutwik Island (Hinckley et al., 1991; Kendall and Picquelle, 1990). Larvae are generally found in the upper 50 m (Kendall et al., 1994). Significant interannual differences in larval distribution and abundance occur by late May (Kendall and Picquelle, 1990; Hermann et al., 1996b, see pp. 58-70 in this supplement).
Circulation on the shelf in the North Pacific is dominated by the Alaska Coastal Current (ACC), a narrow (<50 km), shallow (<150 m) and partially baroclinic current that flows southwestward along the coast (Stabeno et al., 1995). The ACC occupies only a portion of the sea valley at any time and its strength fluctuates on a time scale of days. In Shelikof Strait, current speed (transport) can be appreciable, briefly reaching ~100 cm s-1 (3 × 10⁶ m3 s-1). Transport is largely determined by winds, which are spatially complex (Macklin et al., 1993) and create zones of convergence in the Ekman layer (Schumacher and Kendall, 1991). Southwestward larval drift is characterized by two primary tracks, either the weak flow (<10 cm s-1) along the Alaska Peninsula shoreward of the sea valley, or in the rapidly moving (>25 cm s-1) ACC (Kim and Kendall, 1989).
Eddies are common in the sea valley to the west of Kodiak Island. For example, from April to July 1989, 10 eddies (2.5 month-1) were observed in the sea valley (Bograd et al., 1994). Results from a semi-spectral primitive equation model tuned to this region indicate that the number of eddies observed in 1989 was not unusual and was a function of freshwater discharge (Hermann and Stabeno, 1996; Stabeno and Hermann, 1996). The primary source of eddies is baroclinic instability, which occurs often within Shelikof Strait (Mysak et al., 1981; Schumacher et al., 1993).
We use egg and larval abundance data from 38 ichthyoplankton cruises conducted mainly in the Shelikof sea valley and adjacent waters from May 1979 through May 1992 (Tables 1 and 2). The maximum sampling domain was from Shelikof Strait to the Shumagin Islands, and from the Alaska Peninsula to the shelf break. Generally, sampling ceased when no larvae were found. Ichthyoplankton were routinely sampled by double-oblique tows of 60-cm diameter bongo samplers equipped with 333 µm or 505 µm (in late May) mesh nets. Additional surveys of late larvae and/or early juveniles used 1 m2 Tucker trawl or 5 m2 Methot trawls. Tow depth varied according to the predominant life stage occurring at the time of sampling. During egg surveys, maximum tow depths were 200 m (before 1985) or within 10 m of the bottom (after 1985). The nominal maximum depth of each larval tow was 100 m. A pressure sensing device was used to determine the maximum sampling depth and to verify that tow trajectories were not biased. Sampled volumes were calculated from mechanical flow meters in the mouth of each net. All samples were preserved in a 5% buffered formalin/seawater solution for later analysis; pollock in the samples were sorted and enumerated. Eggs were staged according to the six age groups of Kendall and Kim (1989). A random subsample of up to 50 larvae were measured to the nearest 0.1 mm. An age/length relationship developed for larvae from the study area provided estimates of age (Bailey et al., 1996, see pp. 137-147 in this supplement).
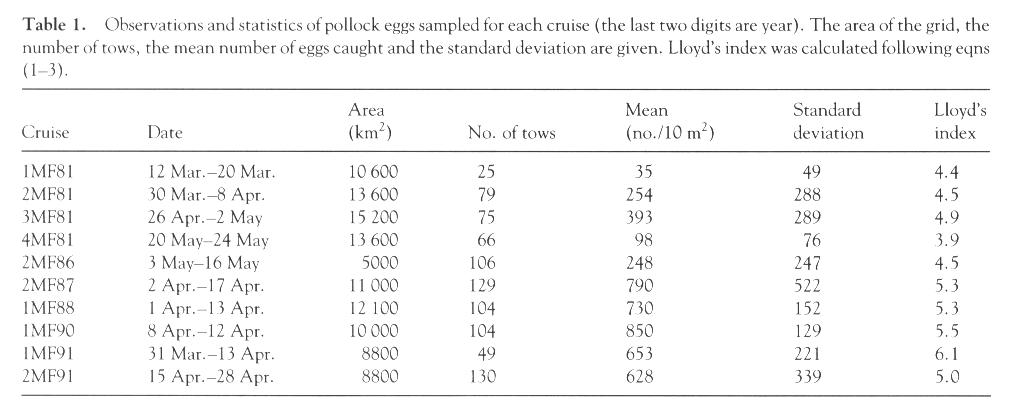
Table 1. Observations and statistics of pollock eggs sampled for each cruise (the last two digits are year). The area of the grid, the number of tows, the mean number of eggs caught and the standard deviation are given. Lloyd's index was calculated following eqns (1-3). [Graphic image of Table 1]
| Cruise | Date | Area (km2) |
No. of tows | Mean (no./10 m2) |
Standard deviation |
Lloyd's index |
| 1MF81 | 12 Mar.-20 Mar. | 10,600 | 25 | 35 | 49 | 4.4 |
| 2MF81 | 30 Mar.-8 Apr. | 13,600 | 79 | 254 | 288 | 4.5 |
| 3MF81 | 26 Apr.-2 May | 15,200 | 75 | 393 | 289 | 4.9 |
| 4MF81 | 20 May-24 May | 13,600 | 66 | 98 | 76 | 3.9 |
| 2MF86 | 3 May-16 May | 5000 | 106 | 248 | 247 | 4.5 |
| 2MF87 | 2 Apr.-17 Apr. | 11,000 | 129 | 790 | 522 | 5.3 |
| 1MF88 | 1 Apr.-13 Apr. | 12,100 | 104 | 730 | 152 | 5.3 |
| 1MF90 | 8 Apr.-12 Apr. | 10,000 | 104 | 850 | 129 | 5.5 |
| 1MF91 | 31 Mar.-13 Apr. | 8800 | 49 | 653 | 221 | 6.1 |
| 2MF91 | 15 Apr.-28 Apr. | 8800 | 130 | 628 | 339 | 5.0 |
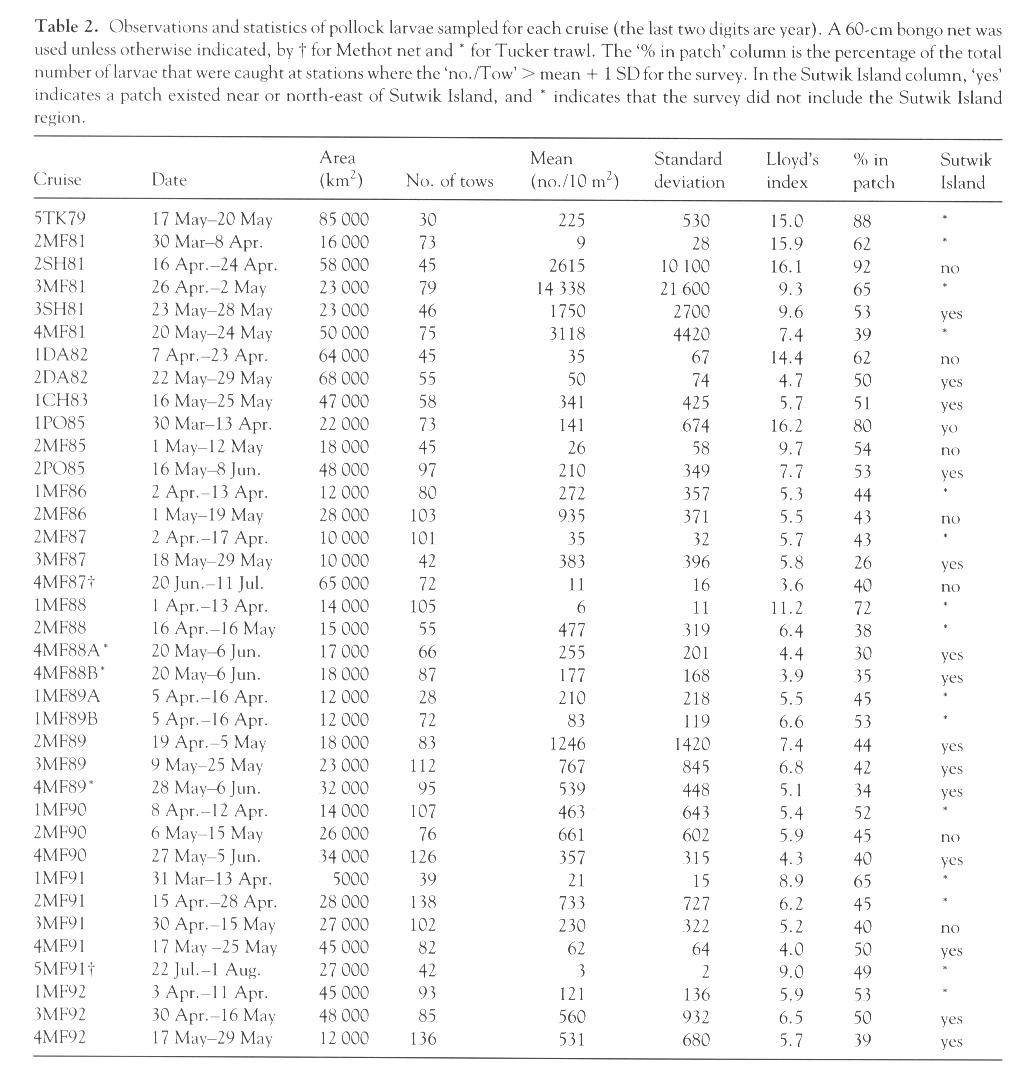
Table 2. Observations and statistics of pollock larvae sampled for each cruise (the last two digits are year). A 60-cm bongo net was used unless otherwise indicated, by † for Methot net and * for Tucker trawl. The "% in patch" column is the percentage of the total number of larvae that were caught at stations where the "no./Tow" > mean + 1 SD for the survey. In the Sutwik Island column "yes" indicates a patch existed near or northeast of Sutwik Island, and * indicates that the survey did not include the Sutwik Island region. [Graphic image of Table 2]
| Cruise | Date | Area (km2) |
No. of tows | Mean (no./10 m2) |
Standard deviation |
Lloyd's index |
% in patch |
Sutwik Island |
| 5TK79 | 17 May-20 May | 85,000 | 30 | 225 | 530 | 15.0 | 88 | * |
| 2MF81 | 30 Mar-8 Apr. | 16,000 | 73 | 9 | 28 | 15.9 | 62 | * |
| 2SH81 | 16 Apr.-24 Apr. | 58,000 | 45 | 2615 | 10,100 | 16.1 | 92 | no |
| 3MF81 | 26 Apr.-2 May | 23,000 | 79 | 14,338 | 21,600 | 9.3 | 65 | * |
| 3SH81 | 23 May-28 May | 23,000 | 46 | 1750 | 2700 | 9.6 | 53 | yes |
| 4MF81 | 20 May-24 May | 50,000 | 75 | 3118 | 4420 | 7.4 | 39 | * |
| 1DA82 | 7 Apr.-23 Apr. | 64,000 | 45 | 35 | 67 | 14.4 | 62 | no |
| 2DA82 | 22 May-29 May | 68,000 | 55 | 50 | 74 | 4.7 | 50 | yes |
| 1CH83 | 16 May-25 May | 47,000 | 58 | 341 | 425 | 5.7 | 51 | yes |
| 1PO85 | 30 Mar-13 Apr. | 22,000 | 73 | 141 | 674 | 16.2 | 80 | no |
| 2MF85 | 1 May-12 May | 18,000 | 45 | 26 | 58 | 9.7 | 54 | no |
| 2PO85 | 16 May-8 Jun. | 48,000 | 97 | 210 | 349 | 7.7 | 53 | yes |
| 1MF86 | 2 Apr.-13 Apr. | 12,000 | 80 | 272 | 357 | 5.3 | 44 | * |
| 2MF86 | 1 May-19 May | 28,000 | 103 | 935 | 371 | 5.5 | 43 | no |
| 2MF87 | 2 Apr.-17 Apr. | 10,000 | 101 | 35 | 32 | 5.7 | 43 | * |
| 3MF87 | 18 May-29 May | 10,000 | 42 | 383 | 396 | 5.8 | 26 | yes |
| 4MF87† | 20 Jun.-11 Jul. | 65,000 | 72 | 11 | 16 | 3.6 | 40 | no |
| 1MF88 | 1 Apr.-13 Apr. | 14,000 | 105 | 6 | 11 | 11.2 | 72 | * |
| 2MF88 | 16 Apr.-16 May | 15,000 | 55 | 477 | 319 | 6.4 | 38 | * |
| 4MF88A* | 20 May-6 Jun. | 17,000 | 66 | 255 | 201 | 4.4 | 30 | yes |
| 4MF88B* | 20 May-6 Jun. | 18,000 | 87 | 177 | 168 | 3.9 | 35 | yes |
| 1MF89A | 5 Apr.-16 Apr. | 12,000 | 28 | 210 | 218 | 5.5 | 45 | * |
| 1MF89B | 5 Apr.-16 Apr. | 12,000 | 72 | 83 | 119 | 6.6 | 53 | * |
| 2MF89 | 19 Apr.-5 May | 18,000 | 83 | 1246 | 1420 | 7.4 | 44 | yes |
| 3MF89 | 9 May-25 May | 23,000 | 112 | 767 | 845 | 6.8 | 42 | yes |
| 4MF89* | 28 May-6 Jun. | 32,000 | 95 | 539 | 448 | 5.1 | 34 | yes |
| 1MF90 | 8 Apr.-12 Apr. | 14,000 | 107 | 463 | 643 | 5.4 | 52 | * |
| 2MF90 | 6 May-15 May | 26,000 | 76 | 661 | 602 | 5.9 | 45 | no |
| 4MF90 | 27 May-5 Jun. | 34,000 | 126 | 357 | 315 | 4.3 | 40 | yes |
| 1MF91 | 31 Mar-13 Apr. | 5000 | 39 | 21 | 15 | 8.9 | 65 | * |
| 2MF91 | 15 Apr.-28 Apr. | 28,000 | 138 | 733 | 727 | 6.2 | 45 | * |
| 3MF91 | 30 Apr.-15 May | 27,000 | 102 | 230 | 322 | 5.2 | 40 | no |
| 4MF91 | 17 May-25 May | 45,000 | 82 | 62 | 64 | 4.0 | 50 | yes |
| 5MF91† | 22 Jul.-1 Aug. | 27,000 | 42 | 3 | 2 | 9.0 | 49 | * |
| 1MF92 | 3 Apr.-11 Apr. | 45,000 | 93 | 121 | 136 | 5.9 | 53 | * |
| 3MF92 | 30 Apr.-16 May | 48,000 | 85 | 560 | 932 | 6.5 | 50 | yes |
| 4MF92 | 17 May-29 May | 12,000 | 136 | 531 | 680 | 5.7 | 39 | yes |
Lloyd's (1967) index of patchiness is often used to quantify the degree of patchiness in ichthyoplankton distributions (Frank et al., 1993; Hewitt, 1981; Houde and Lovdal, 1985; Matsuura and Hewitt, 1995). It is the ratio of mean crowding of a population to its mean density. The mean crowding is defined as the mean number of neighbors per individual per unit area. Individuals are neighbors if they are taken in the same sample.
A patchiness index that is not a function of the population density is ideal because it permits comparisons of patchiness between years with varying abundance and over different life stages. Since the mean crowding is averaged over individuals, it is unaffected by samples taken outside the natural range of the organism which contain no individuals. However, the mean population density would be reduced with these zero-count samples included. Therefore the patchiness index would rise. For example, if the domain consists of the Gulf of Alaska, then each aggregation of spawning pollock (e.g. Shelikof Strait, Shumagin Islands, Chirikof Island) appears as a patch. On this scale, Lloyd's index of patchiness would be large. We focussed on pollock spawning in Shelikof Strait since our interests are the processes in this smaller domain. Lloyd's index is independent of the sampling domain on this scale. We defined the spatial extent of our domain by excluding all stations with zero-counts of pollock eggs or larvae at the edge of the domain. Zero-count stations within this domain were retained since they contribute legitimately to the patchiness.
The area sampled should be much smaller than the size of the patches but large enough so that the relative space occupied by the individual organisms is negligible (Lloyd, 1967). In theory, the minimum observable patch size would be that of a single bongo tow, or a diameter of ~1 km. Survey design, however, dictates the actual minimum and maximum scales. The former is station spacing, generally >10 km, and the latter is geographic range of the survey. The coarseness of the sampling grid did not permit resolution of the scales of patches using either correlograms or variograms (Rossi et al. 1992; P. Dell'Arciprete, Fisheries Research Institute, Univ. Washington, pers. comm.). Examination of maps of larval concentrations suggested, however, that patches occur on scales of 10-50 km.
Lloyd's index (1967) is given by
 (1)
(1)
where  is the population
mean density of eggs or larvae per 10 m2 and
is the population
mean density of eggs or larvae per 10 m2 and  2 is the population variance. As in most
experiments, the true population mean and variance are unknown, and only their
sample estimates are available from observations. Unfortunately, substitution
of the sample estimates into eqn (1) gives a value of P for
which the standard error cannot be reliably calculated. Instead many investigators
fit a negative binomial distribution to the frequency distribution of population
density samples. Such a fit gives the maximum likelihood estimator (Bliss
and Fisher, 1953), k, that relates the variance to the mean by
2 is the population variance. As in most
experiments, the true population mean and variance are unknown, and only their
sample estimates are available from observations. Unfortunately, substitution
of the sample estimates into eqn (1) gives a value of P for
which the standard error cannot be reliably calculated. Instead many investigators
fit a negative binomial distribution to the frequency distribution of population
density samples. Such a fit gives the maximum likelihood estimator (Bliss
and Fisher, 1953), k, that relates the variance to the mean by
 (2)
(2)
The standard error of the patchiness can be derived following Lloyd (1967)
Std error (P) = (var(k))˝/k2 (3)
where var(k) is the sampling variance for k. P equals unity for a random distribution and increases without bound for increasingly aggregated populations.
We first calculated P for eggs and larvae (regardless of age) for each cruise. Lloyd's index for eggs was nearly constant (3.6-6.1) with a small standard error (Table 1; Fig. 2). For larvae, the variability in P was much larger (3.9-16.2; Table 2), as was the standard error. Values of P were greatest and most variable shortly after hatching; both the magnitude and variability decreased during the early larval period. Starting from the middle of larval stage (~12 mm), Lloyd's index increased again. This is similar to the U-shaped pattern for larvae described by others. These results substantiate previous work based on two years of larval data (Kim, 1987) and extend the analysis through the early juvenile stage. A primitive equation, hydrodynamic model was used to simulate advection of larvae and the ensuing distributions were used to obtain estimates of P (Hermann et al., 1996a, see pp. 39-57 in this supplement). The age-dependent pattern of these model estimates between newly hatched and late larval stages was similar to ours (Fig. 2). Since no schooling behavior was included in the model, however, patchiness in the simulations remained low through the juvenile period.
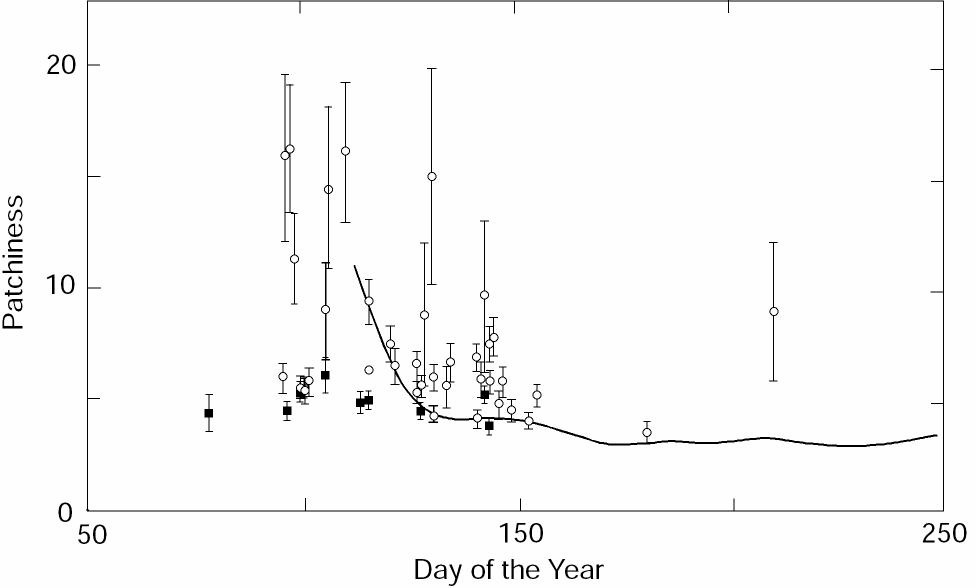
Figure 2. Estimates of Lloyd's index of patchiness for eggs (solid box) and larvae (open circle). Results from a given survey, regardless of egg or larval size (age), are shown as a function of the mean survey date. The error bars show the standard error of the index estimates. The heavy line shows the mean index for larvae from model results (Hermann et al., 1996a).
The trends in the estimates of P suggest that a relationship exists between patchiness and larval age. To explore this, we calculated P as a function of size class (closely correlated with age). This analysis also removed any bias toward younger animals whose numbers had not been reduced by mortality. The largest P occurred for newly hatched larvae, and a minimum occurred between 8 and 14 mm, or ~42 days post-hatch (Fig. 3). As the pollock entered late larval or early juvenile stage, patchiness increased. Patchiness for eggs was not significantly dependent upon stage.
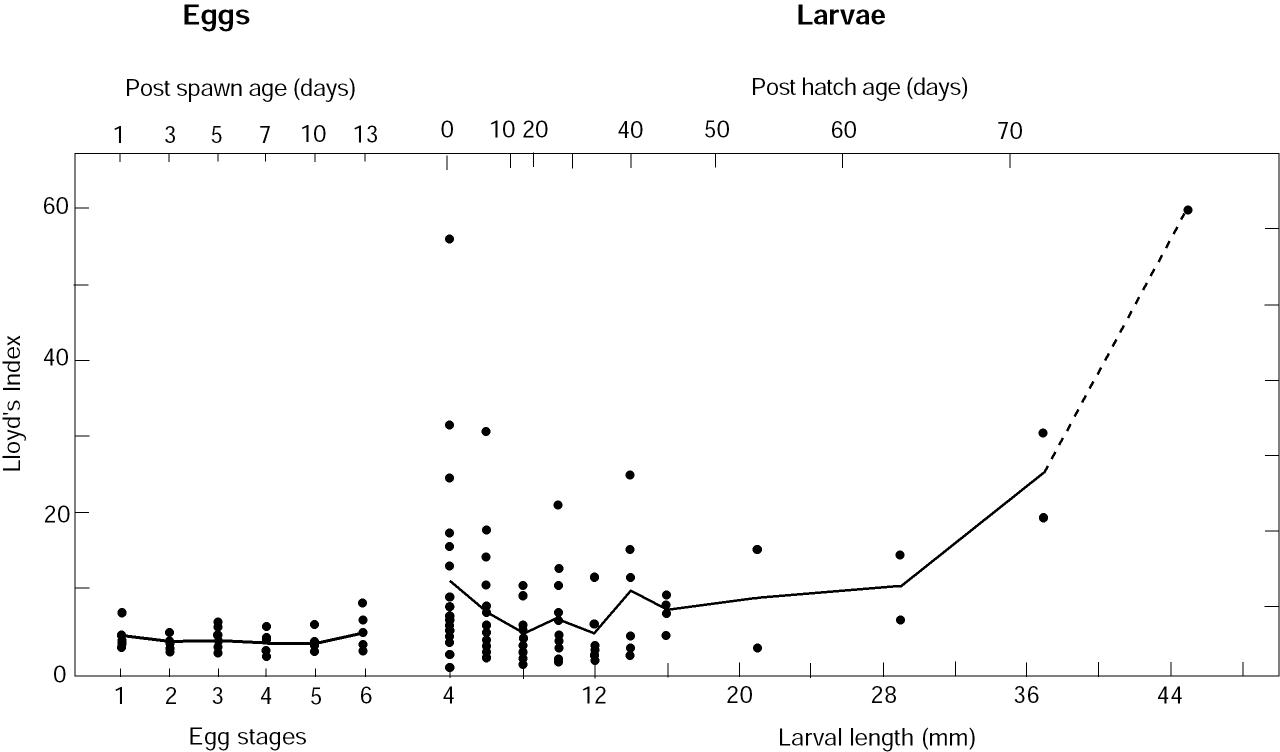
Figure 3. Lloyd's index of patchiness as a function of egg stages and larval length (age). Age was estimated using results from Bailey et al. (1996). Larvae were grouped by 2-mm bins for lengths <17 mm and by 8-mm bins for larger animals. Data sets that consisted of >90% zeros were not used. A line connects the mean values of P for each stage (eggs) and for each length bin (larvae).
Lloyd's index provides no information regarding the percentage of larvae occurring in patches. To obtain an estimate of the contribution of larvae in patches to the total population, we computed the proportion of larvae present at stations where the larval concentration (number/10 m2) exceeded the survey mean by one standard deviation. Almost 92% of the larvae were found in a patch near Cape Kekurnoi during April 1981 (2SH81; Fig. 4e) and only 30% occurred in a patch located northeast of Sutwik Island in May of 1988 (4MF88A; Fig. 4b). Not surprisingly, the percent of larvae in patches was well correlated with Lloyd's index (r = 0.84).
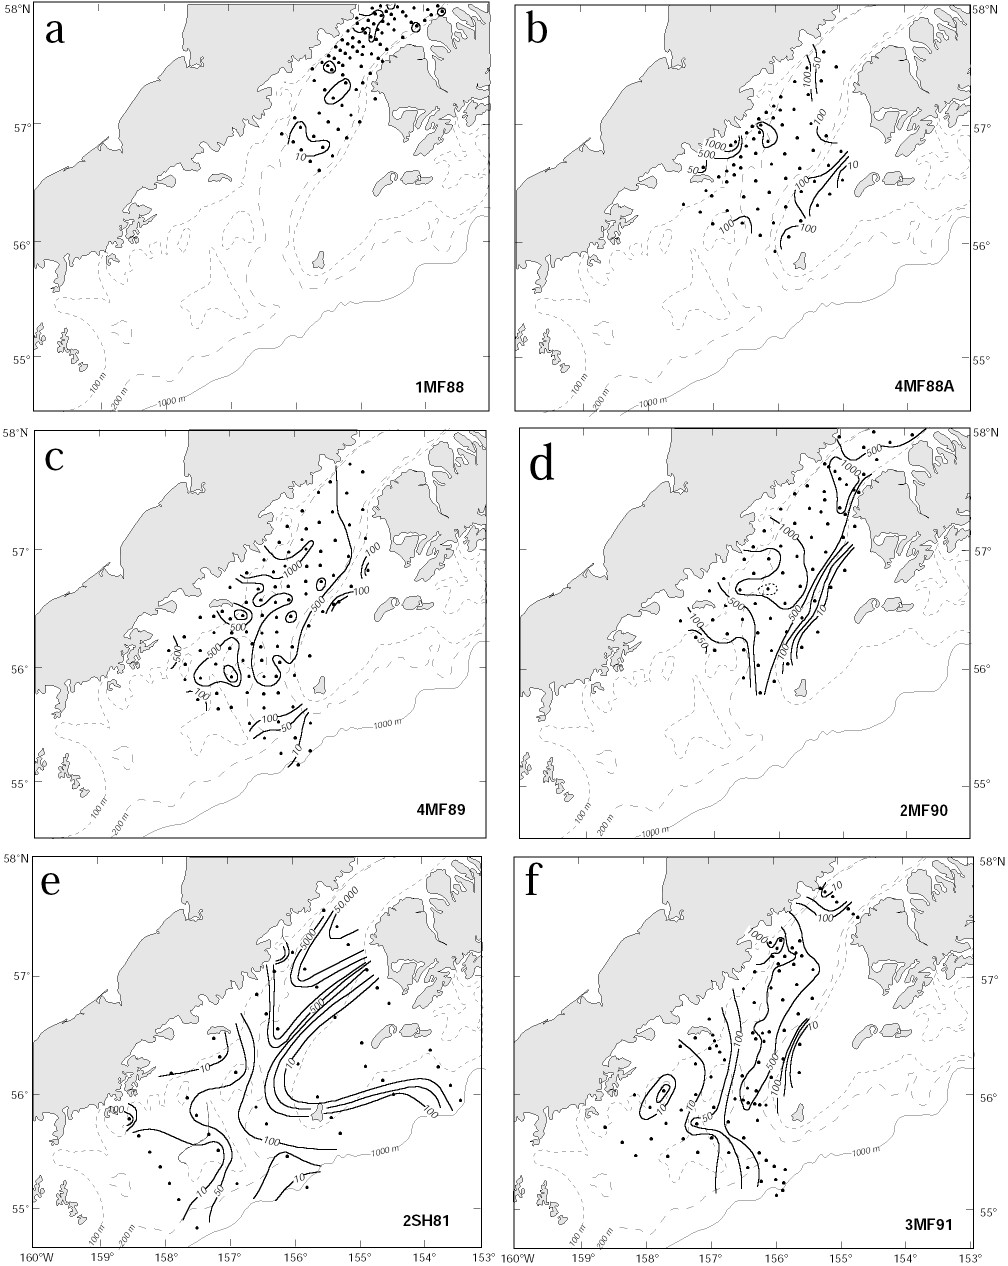
Figure 4. Contours of pollock larvae in Shelikof Strait. The three types of distributions are shown in panels: (a) transient event [1MF88], (b) and (c) Sutwik Island [4MF88A and 4MF89], and (d) eddy, 2MF90 (dotted line shows the 2,250 larvae/10 m2 contour). Panel (e) shows contours from the survey with the greatest abundance [2SH81] and an example of a high Lloyd's Index [P = 16.1]. Panel (f) shows a distribution with a low patchiness [P = 5.2; 3MF91]. Contour intervals are 10, 50, 100, 500, 1000, 5000, 10,000 and 50,000 larvae/10 m2.
The interaction of larvae shortly after hatching with the ACC, Ekman drift and eddies plays a role in creating patches. The characteristics of larval distributions suggest that these larval patches can be organized into three categories, those (i) generated by interaction with time-dependent flow, (ii) found near Sutwik Island, and (iii) associated with eddies. Representative distributions are shown in Fig. 4, and are discussed below.
Patches generated by time-dependent flow A primary mechanism generating patches is the interaction of newly hatched larvae with the vertical shear in the velocity field of the ACC. If there was no vertical shear in the current, the eggs and larvae would be moved together. With a uniform egg distribution no patches could be created. We used a simple model to explore the variability in larval concentration created by a varying baroclinic current given a constant supply of larvae. We assumed eggs hatched at a constant rate (1 egg/10 m2 each hour per kilometer at 200 m depth) along 20 km of the sea valley. Within 24 h the resulting larvae migrated to the upper 50 m; the larval population was not modified by mortality or diffusion. The resulting patchiness did not change significantly when migration time was extended to 48 h. In this model, we assumed no along-axis variation in current. Moored current observations (April-June, 1991; Stabeno et al., 1995) provided the time series of speed that was used to advect the larvae. The current was low-pass filtered and contains no tides, since the tides are largely barotropic in this region. The vertical dependence of speed was 0 at the bottom (z = 200 m), increased linearly to 50 m, and was capped by a mixed layer (z < 50 m) moving as a slab. This structure is a first order approximation to observed conditions (Schumacher et al., 1989). The resulting concentration of larvae along the axis of the ACC varied by an order of magnitude (Fig. 5), with segments of both low variability (200-500 km) and high variability (700-900 km or 0-200 km). The sections where larval concentration was relatively constant result in a low P, while the highly variable sections result in a high P. This mechanism is a likely cause of the high variability evident in P during the early larval stage (Fig. 3). Beginning with a uniform distribution of eggs, varying current regimes with a vertical shear can produce very different larval concentrations. Years when the currents are weak and relatively constant produce larval concentrations with small P. Alternately, years with strong, variable currents produce larval concentrations with large P. An example of the two-dimensional variability resulting from this process is shown in Fig. 4a.
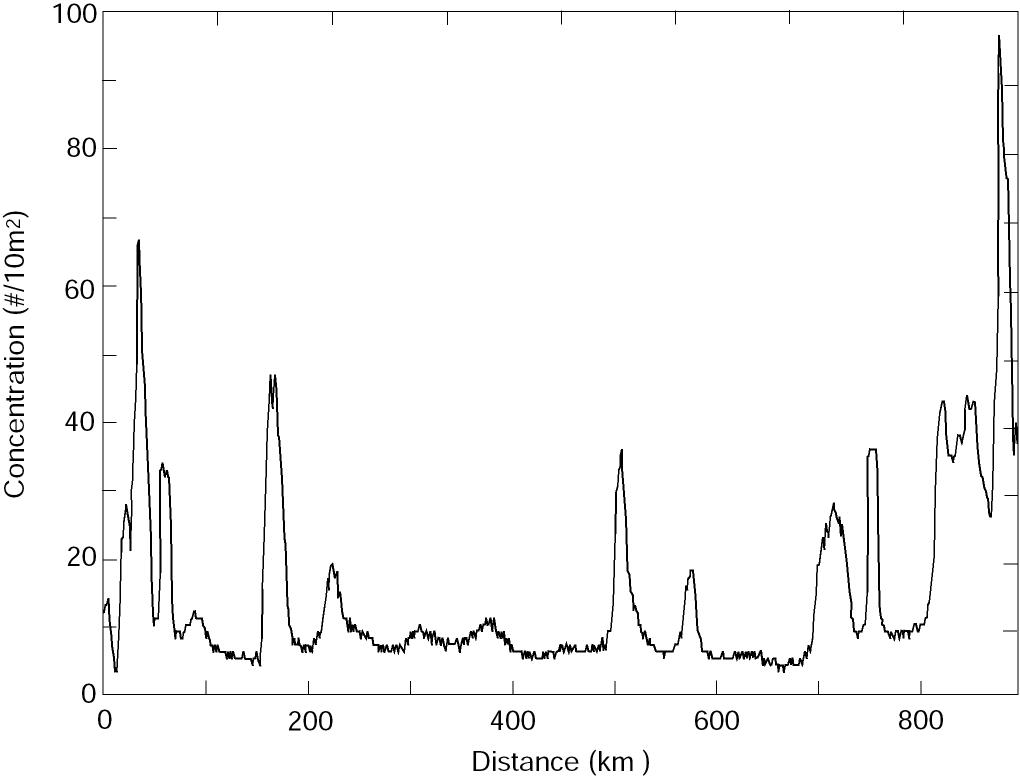
Figure 5. Concentration of newly hatched larvae as a function of distance downstream from midpoint of the hatching distribution from the advective model.
Other manifestations of time-dependent flow can form larval patches. Patches have been associated with meanders in the ACC (Incze et al., 1989; Vastano et al., 1992). Interaction of storms with the mountainous coast together with ageostrophic winds in Shelikof Strait proper results in a wind-driven flow convergence off Wide Bay (Fig. 1; Schumacher and Kendall, 1991). This mechanism can create larval patches, although such a patch has no physical dynamics that would continue to maintain it after the wind event. The contribution of either of these mechanisms to the observed distribution of larvae cannot be assessed.
Patches near Sutwik Island High concentrations of larvae are often observed in the vicinity and to the northeast of Sutwik Island (Figs 4b and 4c). Evidence of accumulation of material near the island is not limited to larval concentration from ichthyoplankton surveys. Currents from a hydrodynamic model were used to advect larvae; the resulting modeled larval distributions often showed an accumulation near Sutwik Island (Hermann and Stabeno, 1996; Hermann et al., 1996b). Further, satellite-tracked drifting buoys deployed near Cape Kekurnoi were commonly advected to the vicinity of Sutwik Island.
The Sutwik Island patches resulted from a combination of hatching location (Fig. 1), Ekman flow, mean current and topography (Hermann and Stabeno, 1996). A weak (~10 cm s-1) flow along the Alaska Peninsula has been measured by both current meters and satellite-tracked drifting buoys (Kim and Kendall, 1989; Schumacher et al., 1989). Drifting buoys usually drifted toward Sutwik Island where net speeds diminished (Schumacher and Kendall, 1995), suggesting that flow stagnates there. This is due, at least in part, to the change of water depth from the sea valley (>250 m) to plateau (<150 m). The flow onto this plateau is determined by both baroclinic structure and current strength (Spitz and Nof, 1991).
Superimposed on this mean flow are wind-driven events. Between April and June, the mean wind is toward the southwest, with nearly three-fourths of the variance occurring on this axis (Macklin et al., 1993). The passage of storms results in Ekman transport in the upper layer that fluctuates between on- and offshore flow; these were evident in a current record (1985) from a mooring south of Wide Bay (not shown). During May 1985, three events of onshore flow occurred resulting in a total of 13 days of coastal convergence. In contrast, there were only 3 days of divergent flow.
Since most spawning occurs near the Alaska Peninsula off Cape Kekurnoi, larvae are ideally situated for being transported to Sutwik Island. Flow shoreward of the sea valley carries larvae along the coast where the shelf widens and winds seasonally decrease. All along this pathway, Ekman flow events concentrate larvae near the coast (Hermann et al., 1996b). Larvae that hatch later provide a continuing supply of larvae adding to those that arrived earlier. The lifetime of a patch is dependent upon the winds. When winds reverse, the resulting offshore flow transports larvae away from the coast. In a year when these wind conditions dominate, a patch would not be expected near Sutwik Island.
Patches associated with eddies During three separate occasions high larval abundances were observed in eddies (Bograd et al., 1994; Schumacher et al., 1993; Vastano et al., 1992). The presence of larvae in an eddy (Fig. 4d) can result from their residence in the water during formation and/or from subsequent hatching and rising into the eddy. During the spring, two to three eddies are typically formed each month (Bograd et al., 1994). The fraction of water (percentage of larval population) incorporated into an eddy is small compared to that of the ACC (total larval population). For an eddy of radius 10 km and 100 m deep, the volume is 3 × 10¹⁰ m3, while volume transport in the ACC (<100 m) is ~0.4 × 10⁶ m3 s-1. The three eddies formed per month contain <10% of the water passing through the area in the ACC each month. Hatching into an eddy likely provides the majority of larvae found there. In model simulations, eddies remain stationary off Cape Kekurnoi 3-6 days, thus from 30%-60% of each month an eddy is present into which larvae may hatch.
Larval patches associated with eddies are often larger than the eddy itself (Schumacher et al., 1993), suggesting some leakage of larvae occurs. How long larvae remain within an eddy depends upon the strength, size relative to the Rossby radius, and translation speed of the eddy (Holloway et al., 1986). Leakage of larvae from an eddy is due to diffusion-like effects, interaction with background flow field, and wind. Since larvae are predominantly found in the upper 50 m, larvae may be removed from the eddy by Ekman transport.
In the Shelikof sea valley, eddies have retained drifting buoys for weeks, with the buoys escaping an eddy only when the eddy interacted with bathymetry and dissipated. The majority of dispersion occurs as an eddy spins down due to this interaction with bathymetry. The lifetime of an eddy in the sea valley is not known. The longest observed duration was 16 days (Schumacher et al., 1993). While in an eddy, larval concentration remains high, but once the eddy spins down, diffusion dominates and larvae are quickly dispersed.
We believe that the increased patchiness in the late larval and early juvenile stages resulted from an increasing ability of these animals to swim and respond to their environment (Olla et al., 1996, see pp. 167-178 in this supplement). With time, diffusion tends to equalize the concentration of larvae over space. Larvae could balance this effect by actively swimming toward the center of the patch. To evaluate this possibility, we considered an idealized analytical model of a larval patch. In polar coordinates, the change in concentration (C) of larvae with time (t) in an axisymmetric patch of constant radius is given by the advection-diffusion equation
 (4)
(4)
where r is the distance of the larvae from the center of the patch, U is the assumed constant larval swimming speed (toward the center of the patch), and KH the horizontal eddy diffusivity. Equation 4 allows a bounded steady state solution:
 (5)
(5)
where C0 is the concentration at the patch center. For
a wide range of oceanic scales and in the absence of horizontal shear, experiments
show that the eddy diffusivity coefficient can be approximated by 2 × 10⁻³ R4/3 cm2
s-1, where R is the radius of the patch (Okubo,
1980). From eqn (5), the radial swimming speed (U) required to
maintain a portion  of larvae within
a circle of radius R is
of larvae within
a circle of radius R is
U = -2 × 10⁻³ ln(1 - ) R1/3
(6)
and for = 0.99,
U = 9.2 × 10⁻³ R1/3.
The greatest change of patch radius with swimming speed occurs for U < 0.7 cm s-1 (Fig. 6). For a patch with radius comparable to observed eddies in Shelikof sea valley (~15 km), a minimum radial swimming speed of 1.0 cm s-1 would be required to maintain a patch against diffusion. (Since it is unlikely that larvae could swim exactly to patch center, this estimate only forms a minimum requirement.) Given that larvae swim one to two body lengths per second, swimming ability can be important in maintaining a patch once the larvae reach a length of 10-20 mm. This mechanism most likely explains the observed increase in P for older larvae (Fig. 3).
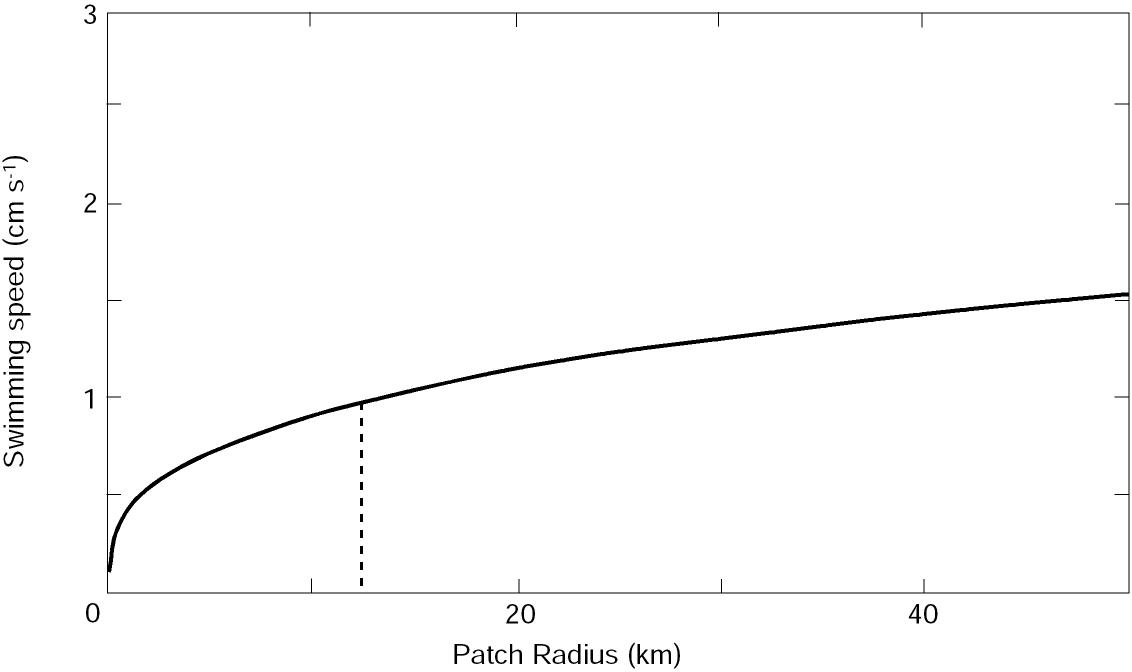
Figure 6. The relationship between larval swimming speed and the radius of a patch they are capable of maintaining in the presence of horizontal diffusion. See text for details of the model. Dashed line represents the approximate radius of eddies in Shelikof Strait and the resulting minimum radial swimming speed to maintain the larval patch against diffusion.
The patchiness of ichthyoplankton is influenced by many biological factors including spawning mode (pelagic vs. demersal), frequency of the spawning (single vs. batch), fecundity, daily mortality rates and ontogenetic changes in behavior (Frank et al., 1993; McGurk, 1986; Matsuura and Hewitt, 1995). The low patchiness values for all stages of eggs compared to early larvae was surprising, considering the nonuniformity of spawning aggregations. Apparently, the eggs diffuse quickly in the horizontal but remain layered vertically due to differences in egg buoyancy (Kendall and Kim, 1989; Kim, 1987). Our calculations for egg patchiness (3.9-6.1) were similar to those (4.3-6.8) determined from finer scale net camera observations (Brodeur et al., 1996b, see pp. 92-111 in this supplement). They are also similar to values (2.5-7.1) for different egg stages of Browns Bank haddock (Melanogrammus aeglefinus), and a demersal-spawning gadid with pelagic larvae (Koslow et al., 1985). They are, however, substantially lower than estimates for eggs (3-61) calculated for pelagic-spawning Pacific sardine (Sardinops sagax) off California (Smith, 1973). The patchiness values calculated for larvae are consistent with previous results for walleye pollock (Kim, 1987). Those calculated for larvae and early juveniles compare well to values obtained for other species (McGurk, 1986).
A U-shaped pattern in larval patchiness as a function of age is characteristic of the larvae of many marine fish (Frank et al., 1993; Matsuura and Hewitt, 1995). The high patchiness we observed in the early larval stage during some years resulted from larvae interacting with the physical environment (eddies and currents). The decrease in patchiness with age resulted from diffusion and the dissipation of the eddies. Only in the late larval and juvenile stages could swimming and schooling influence large scale (~10 km) distributions.
Patches can have important implications for predator-prey interactions of larval pollock. Given that other similar-sized zooplankton are more abundant (Napp et al., 1996), it is unlikely that patches of pollock larvae are of sufficient density to attract swarming predators. Conversely, if pollock larvae coexist in patches with more numerous zooplankton, those predators feeding within the patch may saturate quickly, reducing predation pressure on larvae.
Mechanisms that aggregate larvae may likewise aggregate their prey. To date, the evidence that it is advantageous for larvae to feed in a patch is equivocal. In late April 1989, larvae in a patch (and eddy) had higher prey concentrations, had better nutritional condition and fuller guts than larvae not found in a patch. Later that year, prey concentrations and the associated larval feeding were equivalent in or out of patches (Canino et al., 1991). A similar situation existed in 1990 (Bailey et al., 1996).
Results from modeling studies suggest that wind mixing of the upper water column can be either beneficial or detrimental to larval survival (Davis et al., 1991). A relationship between wind-mixing, stratification within an eddy and larval behavior, and their subsequent survival has been suggested for Shelikof Strait (Bailey and Macklin, 1994). Observations within an eddy revealed enhanced prey and feeding conditions together with a low-salinity core relative to surrounding waters (Canino et al., 1991). The vertical stratification of this feature suppressed wind-induced turbulence relative to that in adjacent waters. In laboratory experiments, pollock larvae avoid turbulence (Olla and Davis, 1990) by going deeper. Light intensity decreases with depth, which has detrimental effects on the ability of larvae to search for and capture prey (Heath, 1989). This coupling of biology and physics provides a potential mechanism for enhanced larval survival in a patch maintained by an eddy, or any region with enhanced stratification. Conservation of metabolic energy has also been suggested for young salmon in an eddy (Freeland, 1988). With the present observations, however, it is not possible to ascertain quantitatively the importance of patches associated with eddies to larval survival.
Larval aggregations maintained by dynamics that increase retention within the patch may convey definite advantages to larvae. The selection of pollock life history traits and spawning location would appear to be coupled to an area where eddies are common and island retention features also exist. The former coupling also occurs in the eastern Bering Sea (Schumacher and Stabeno, 1994). For those larvae associated with recurrent patches around Sutwik Island, removal from the shelf is highly unlikely and transport to nursery grounds on the shelf (Hinckley et al., 1991) assured. Furthermore, waters shoreward of the ACC may be more stratified than offshore waters and stratification is related to enhanced plankton production and vertical layering of prey (Napp et al., 1996). Both of these conditions allow the Sutwik Island patch to contribute to larval survival and later recruitment.
We wish to thank all members of FOCI who helped to collect and process the data used in this paper. Special thanks to A. Hermann for free exchange of ideas and thought-provoking conversations, W. Rugen for providing the data in a useful format, and Dr. L. Ejsymont and the staff of the Polish Plankton Sorting and Identification Center, Sczcecin, Poland who processed the ichthyoplankton data. This research is contribution FOCI-0244 to NOAA's Fisheries Oceanography Coordinated Investigations, and contribution 1646 from NOAA's Pacific Marine Environmental Laboratory.
Bailey, K.M., and Macklin, S.A. (1994) Coherent patterns of larval walleye pollock survival and wind mixing events in Shelikof Strait, Alaska. Mar. Ecol. Prog. Ser. 113:1-12.
Bailey, K.M., Brown, A.L., Yoklavich, M.M., and Mier, K.L. (1996) Interannual variability of growth of larval and juvenile walleye pollock Theragra chalcogramma in the western Gulf of Alaska, 1983-1991. Fish. Oceanogr., 5(Suppl. 1):137-147.
Bailey, K.M., Canino, M.F., Napp, J.M., Spring, S.M., and Brown, A.L. (1995) Contrasting years of prey levels, feeding conditions and mortality of larval walleye pollock Theragra chalcogramma in the western Gulf of Alaska. Mar. Ecol. Prog. Ser. 119:11-23.
Bliss, C.I., and Fisher, R. A. (1953) Fitting the negative binomial distribution to biological data and a note on efficient fitting of the negative binomial. Biometrics 9:176-200.
Bograd, S.J., Stabeno, P.J., and Schumacher, J.D. (1994) A census of mesoscale eddies in Shelikof Strait, Alaska, during 1989. J. Geophys. Res. 99:18243-18254.
Brodeur, R.D, Napp, J.M., Wilson, M.T., Bograd, S.J., Cokelet, E.D., and Schumacher, J.D. (1996a) Acoustic detection of mesoscale biophysical features in the Shelikof Sea valley and their relevance to pollock larvae in the Gulf of Alaska. Fish. Oceanogr., 5(Suppl. 1): 71-80.
Brodeur, R.D., Picquelle, S.J., Blood, D.M., and Merati, N. (1996b) Walleye pollock egg distribution and mortality in the western Gulf of Alaska. Fish. Oceanogr., 5(Suppl. 1):92-111.
Canino, M.F., Bailey, K.M., and Incze, L.S. (1991) Temporal and geographic differences in feeding and nutritional condition of walleye pollock larvae Theragra chalcogramma in Shelikof Strait, Alaska. Mar. Ecol. Prog. Ser. 79:27-36.
Coyle, K.O., and Cooney, R.T. (1993) Water column sound scattering and hydrography around the Pribilof Islands, Bering Sea. Cont. Shelf Res. 13:803-828.
Davis, C.S., Flierl, G.R., Wiebe, P.H., and Franks, P.J.S. (1991) Micropatchiness, turbulence and recruitment in plankton. J. Mar. Res. 49:109-151.
Eppley, R.W., Reid, F.M.H., and Steward, E. (1984) Length of phytoplankton species patches on the Southern California shelf. Cont. Shelf Res. 3:259-266.
Frank, K.T., Carscadden, J.E., and Leggett, W.C. (1993) Causes of spatial-temporal variations in the patchiness of larval fish distributions: differential mortality or behavior. Fish. Oceanogr. 2:114-123.
Freeland, H.J. (1988) Derived Lagrangian statistics on the Vancouver Island continental shelf and implications for salmon migration. Atmos.-Ocean. 26:267-281.
Heath, M.A. (1989) A modeling and field study of grazing by herring larvae. Rapp. P.-v Reun. Cons. int. explor. Mer. 191:233-247.
Hermann, A.J., Hinckley, S., Megrey, B.A., and Stabeno, P.J. (1996a) Interannual variability of the early life history of walleye pollock near Shelikof Strait as inferred from a spatially explicit, individual-based model. Fish. Oceanogr., 5(Suppl. 1):39-57.
Hermann, A.J., Rugen, W.C., Stabeno, P.J., and Bond, N.A. (1996b) Physical transport of young pollock larvae (Theragra chalcogramma) near Shelikof Strait as inferred from a hydrodynamic model. Fish. Oceanogr., 5(Suppl. 1):58-70.
Hermann, A.J., and Stabeno, P.J. (1996) An eddy-resolving circulation model for the western Gulf of Alaska Shelf: I. Model development and sensitivity. J. Geophys. Res., in press.
Hewitt, R. (1981) The value of pattern in the distribution of young fish. Rapp. P.-v Réun. Cons. int. explor. Mer. 178:229-236.
Hinckley, S., Bailey, K.M., Picquelle, S.J., Schumacher, J.D., and Stabeno, P.J. (1991) Transport, distribution, and abundance of larval and juvenile walleye pollock (Theragra chalcogramma) in the western Gulf of Alaska in 1987. Can. J. Fish. Aquat. Sci. 48:91-98.
Houde, E.D., and Lovdal, J.D.A. (1985) Patterns of variability in ichthyoplankton occurrence and abundance in Biscayne Bay, Florida. Est. Coast. Shelf Sci. 20:79-103.
Holloway, G., Riser, S.C., and Ramsden, D. (1986) Tracer anomaly evolution in the flow field of an isolated eddy. Dynamics Atm. Oceans 10:165-184.
Incze, L.S., Kendall, A.W., Jr., Schumacher, J.D., and Reed, R.K. (1989) Interactions of a mesoscale patch of larval fish (Theragra chalcogramma) with the Alaska Coastal Current. Cont. Shelf Res. 9:269-284.
Kendall, A.W., Jr., and Kim, S. (1989) Buoyancy of walleye pollock (Theragra chalcogramma) eggs in relation to water properties and movement in Shelikof Strait, Gulf of Alaska. Can. Spec. Publ. Fish. Aquat. Sci. 108:169-180.
Kendall, A.W., Jr., and Picquelle, S.J. (1990) Egg and larval distributions of walleye pollock Theragra chalcogramma in Shelikof Strait, Gulf of Alaska. Fish. Bull., US 88:133-154.
Kendall, A.W., Jr., Incze, L.S., Ortner, P.B., Cummings, S.R., and Brown, P.K. (1994) The vertical distribution of eggs and larvae of walleye pollock Theragra chalcogramma in Shelikof Strait, Gulf of Alaska. Fish. Bull. 92:540-554.
Kim, S. (1987) Spawning behavior and early life history of walleye pollock, Theragra chalcogramma, in Shelikof Strait, Gulf of Alaska, in relation to oceanographic factors. Ph.D. dissertation, University of Washington, 220 pp.
Kim, S., and Kendall, A.W., Jr. (1989) Distribution and transport of larval walleye pollock (Theragra chalcogramma) in Shelikof Strait, Gulf of Alaska, in relation to water movement. Rapp. P.-v. Réun. Cons. int. Explor. Mer. 191:127-136.
Kinder, T.H., Hunt, G.L., Jr., Schneider, D., and Schumacher, J.D. (1983) Correlation between seabirds and oceanic fronts around the Pribilof Islands, Alaska. Est. Coast. Shelf Sci. 16:309-319.
Koslow, J.A., Brault, S., Dugas, J., and Page, F. (1985) Anatomy of an apparent year-class failure: the early life history of the 1983 Browns Bank haddock Melanogrammus aeglefinus. Trans. Am. Fish. Soc. 114:478-489.
Levasseur, M., Therriault, J.-C., and Legendre, L. (1983) Tidal currents, winds and the morphology of phytoplankton spatial structures. J. Mar. Res. 41:655-672.
Lloyd, M. (1967) Mean crowding. J. Anim. Ecol. 36:1-30.
McGurk, M.D. (1986) Natural mortality of marine pelagic fish eggs and larvae: role of patchiness. Mar. Ecol. Prog. Ser. 34:227-242.
Macklin, S.A., Stabeno, P.J., and Schumacher, J.D. (1993) A comparison of gradient and observed over-the-water winds along a mountainous coast. J. Geophys. Res. 98:16555-16569.
Matsuura, Y., and Hewitt, R. (1995) Changes in the spatial patchiness of Pacific mackerel, Scomber japonicus, larvae with increasing age and size. Fish. Bull. 93:172-178.
Mysak, L., Muench, R.D., and Schumacher, J.D. (1981) Baroclinic instability in a downstream varying channel: Shelikof Strait, Alaska. J. Phys. Oceanogr. 11:950-969.
Napp, J. M., Incze, L.S., Ortner, P.B., Siefer, D.L.W., and Britt, L. (1996) The plankton of Shelikof Strait, Alaska: standing stock, production, mesoscale variability and their relevance to larval fish survival. Fish. Oceanogr., 5(Suppl. 1):19-38.
Okubo, A. (1980) Diffusion and Ecological Problems: Mathematical Models, Biomathematics Vol. 10, Berlin: Springer-Verlag, 254 pp.
Olla, B.L., and Davis, M.W. (1990) Effects of physical factors on the vertical distribution of larval walleye pollock Theragra chalcogramma under controlled laboratory conditions. Mar. Ecol. Prog. Ser. 63:105-112.
Olla, B.L., Davis, M.W., Ryer, C.H., and Bograd, S. (1996) Behavioral determinants of distribution and survival in early stages of walleye pollock, Theragra chalcogramma: a synthesis of experimental results. Fish. Oceanogr., 5(Suppl. 1):167-178.
Pineda, J. (1991) Predictable upwelling and the shoreward transport of planktonic larvae by internal tidal bores. Science 253:548-550.
Rossi, R.E., Mulla, D.J., Journel, A.G., and Franz, E.H. (1992) Geostatistical tools for modeling and interpreting ecological spatial dependence. Ecol. Mono. 62:277-314.
Schumacher, J.D., and Kendall, A.W., Jr. (1991) Some interactions between young walleye pollock and their environment in the western Gulf of Alaska. CalCOFI Rep. 32:22-40.
Schumacher, J.D., and Kendall, A.W., Jr. (1995) An example of fisheries oceanography: walleye pollock in Alaskan waters. Rev. Geophys. Suppl.:1153-1163.
Schumacher, J.D., and Stabeno, P.J. (1994) Ubiquitous eddies of the Eastern Bering Sea and their coincidence with concentrations of larval pollock. Fish. Oceanogr. 3:3, 182-190.
Schumacher, J.D., Stabeno, P.J., and Roach, A.T. (1989) Volume transport in the Alaska Coastal Current. Cont. Shelf Res. 9:1071-1089.
Schumacher, J.D., Stabeno, P.J., and Bograd, S.J. (1993) Characteristics of an eddy over a continental shelf: Shelikof Strait, Alaska. J. Geophys. Res. 98:8395-8404.
Smith, P.E. (1973) The mortality and dispersal of sardine eggs and larvae. Rapp. P.-v. Réun. Cons. int. Explor. Mer. 164:282-291.
Smith, S.L., and Vidal, J. (1986) Variations in the distribution, abundance, and development of copepods in the southeastern Bering Sea in 1980 and 1981. Cont. Shelf Res. 5:215-239.
Spitz, Y.M., and D. Nof (1991) Separation of boundary currents due to bottom topography. Deep-Sea Res. 38:1-20.
Stabeno, P.J., and Hermann, A.J. (1996) An eddy-resolving circulation model for the western Gulf of Alaska Shelf: 2. Comparison of results to oceanographic observations. J. Geophys. Res., 101(C1):1151-1161.
Stabeno, P.J., Schumacher, J.D., and Reed, R.K. (1995) The Alaska Coastal Current: Continuity of transport and forcing. J. Geophys. Res. 100:2477-2485.
Vastano, A.C., Incze, L.S., and Schumacher, J.D. (1992) Observation and analysis of fishery processes: larval pollock at Shelikof Strait, Alaska. Fish. Oceanogr. 1:20-31.
Willis, B.L., and Oliver, J.K. (1990) Direct tracking of coral larvae: implications for dispersal studies of planktonic larvae in topographically complex environments. Ophelia 32:145-162.
Return to Abstract