U.S. Dept. of Commerce / NOAA / OAR / PMEL / Publications
We use egg and larval abundance data from 38 ichthyoplankton cruises conducted mainly in the Shelikof sea valley and adjacent waters from May 1979 through May 1992 (Tables 1 and 2). The maximum sampling domain was from Shelikof Strait to the Shumagin Islands, and from the Alaska Peninsula to the shelf break. Generally, sampling ceased when no larvae were found. Ichthyoplankton were routinely sampled by double-oblique tows of 60-cm diameter bongo samplers equipped with 333 µm or 505 µm (in late May) mesh nets. Additional surveys of late larvae and/or early juveniles used 1 m2 Tucker trawl or 5 m2 Methot trawls. Tow depth varied according to the predominant life stage occurring at the time of sampling. During egg surveys, maximum tow depths were 200 m (before 1985) or within 10 m of the bottom (after 1985). The nominal maximum depth of each larval tow was 100 m. A pressure sensing device was used to determine the maximum sampling depth and to verify that tow trajectories were not biased. Sampled volumes were calculated from mechanical flow meters in the mouth of each net. All samples were preserved in a 5% buffered formalin/seawater solution for later analysis; pollock in the samples were sorted and enumerated. Eggs were staged according to the six age groups of Kendall and Kim (1989). A random subsample of up to 50 larvae were measured to the nearest 0.1 mm. An age/length relationship developed for larvae from the study area provided estimates of age (Bailey et al., 1996, see pp. 137-147 in this supplement).
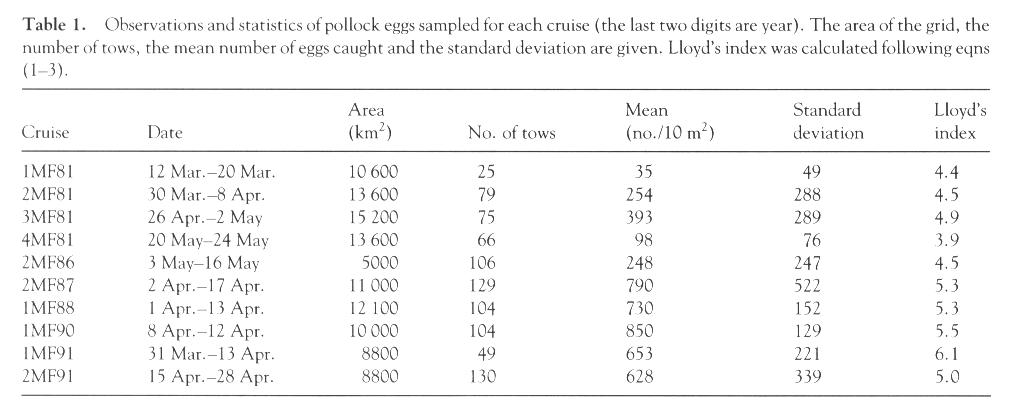
Table 1. Observations and statistics of pollock eggs sampled for each cruise (the last two digits are year). The area of the grid, the number of tows, the mean number of eggs caught and the standard deviation are given. Lloyd's index was calculated following eqns (1-3). [Graphic image of Table 1]
| Cruise | Date | Area (km2) |
No. of tows | Mean (no./10 m2) |
Standard deviation |
Lloyd's index |
| 1MF81 | 12 Mar.-20 Mar. | 10,600 | 25 | 35 | 49 | 4.4 |
| 2MF81 | 30 Mar.-8 Apr. | 13,600 | 79 | 254 | 288 | 4.5 |
| 3MF81 | 26 Apr.-2 May | 15,200 | 75 | 393 | 289 | 4.9 |
| 4MF81 | 20 May-24 May | 13,600 | 66 | 98 | 76 | 3.9 |
| 2MF86 | 3 May-16 May | 5000 | 106 | 248 | 247 | 4.5 |
| 2MF87 | 2 Apr.-17 Apr. | 11,000 | 129 | 790 | 522 | 5.3 |
| 1MF88 | 1 Apr.-13 Apr. | 12,100 | 104 | 730 | 152 | 5.3 |
| 1MF90 | 8 Apr.-12 Apr. | 10,000 | 104 | 850 | 129 | 5.5 |
| 1MF91 | 31 Mar.-13 Apr. | 8800 | 49 | 653 | 221 | 6.1 |
| 2MF91 | 15 Apr.-28 Apr. | 8800 | 130 | 628 | 339 | 5.0 |
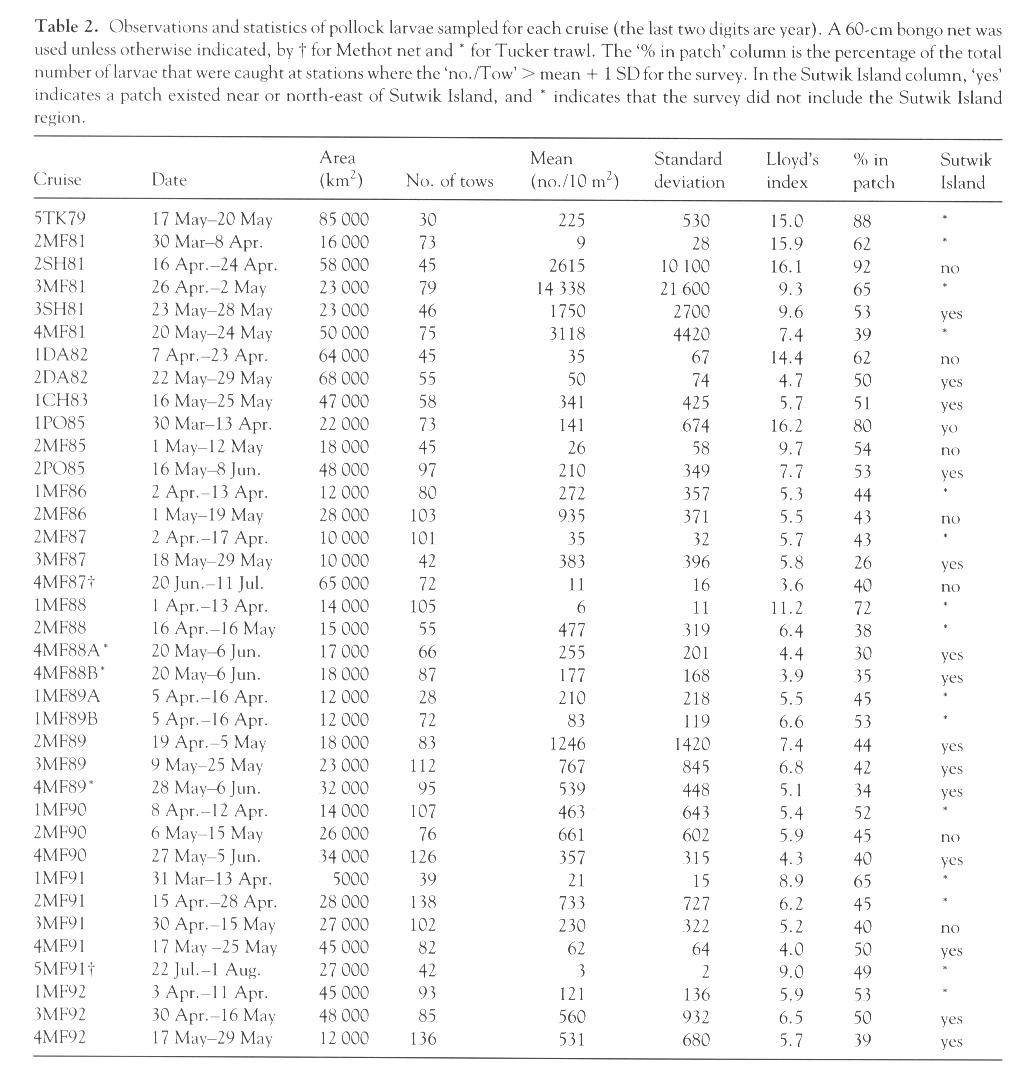
Table 2. Observations and statistics of pollock larvae sampled for each cruise (the last two digits are year). A 60-cm bongo net was used unless otherwise indicated, by † for Methot net and * for Tucker trawl. The "% in patch" column is the percentage of the total number of larvae that were caught at stations where the "no./Tow" > mean + 1 SD for the survey. In the Sutwik Island column "yes" indicates a patch existed near or northeast of Sutwik Island, and * indicates that the survey did not include the Sutwik Island region. [Graphic image of Table 2]
| Cruise | Date | Area (km2) |
No. of tows | Mean (no./10 m2) |
Standard deviation |
Lloyd's index |
% in patch |
Sutwik Island |
| 5TK79 | 17 May-20 May | 85,000 | 30 | 225 | 530 | 15.0 | 88 | * |
| 2MF81 | 30 Mar-8 Apr. | 16,000 | 73 | 9 | 28 | 15.9 | 62 | * |
| 2SH81 | 16 Apr.-24 Apr. | 58,000 | 45 | 2615 | 10,100 | 16.1 | 92 | no |
| 3MF81 | 26 Apr.-2 May | 23,000 | 79 | 14,338 | 21,600 | 9.3 | 65 | * |
| 3SH81 | 23 May-28 May | 23,000 | 46 | 1750 | 2700 | 9.6 | 53 | yes |
| 4MF81 | 20 May-24 May | 50,000 | 75 | 3118 | 4420 | 7.4 | 39 | * |
| 1DA82 | 7 Apr.-23 Apr. | 64,000 | 45 | 35 | 67 | 14.4 | 62 | no |
| 2DA82 | 22 May-29 May | 68,000 | 55 | 50 | 74 | 4.7 | 50 | yes |
| 1CH83 | 16 May-25 May | 47,000 | 58 | 341 | 425 | 5.7 | 51 | yes |
| 1PO85 | 30 Mar-13 Apr. | 22,000 | 73 | 141 | 674 | 16.2 | 80 | no |
| 2MF85 | 1 May-12 May | 18,000 | 45 | 26 | 58 | 9.7 | 54 | no |
| 2PO85 | 16 May-8 Jun. | 48,000 | 97 | 210 | 349 | 7.7 | 53 | yes |
| 1MF86 | 2 Apr.-13 Apr. | 12,000 | 80 | 272 | 357 | 5.3 | 44 | * |
| 2MF86 | 1 May-19 May | 28,000 | 103 | 935 | 371 | 5.5 | 43 | no |
| 2MF87 | 2 Apr.-17 Apr. | 10,000 | 101 | 35 | 32 | 5.7 | 43 | * |
| 3MF87 | 18 May-29 May | 10,000 | 42 | 383 | 396 | 5.8 | 26 | yes |
| 4MF87† | 20 Jun.-11 Jul. | 65,000 | 72 | 11 | 16 | 3.6 | 40 | no |
| 1MF88 | 1 Apr.-13 Apr. | 14,000 | 105 | 6 | 11 | 11.2 | 72 | * |
| 2MF88 | 16 Apr.-16 May | 15,000 | 55 | 477 | 319 | 6.4 | 38 | * |
| 4MF88A* | 20 May-6 Jun. | 17,000 | 66 | 255 | 201 | 4.4 | 30 | yes |
| 4MF88B* | 20 May-6 Jun. | 18,000 | 87 | 177 | 168 | 3.9 | 35 | yes |
| 1MF89A | 5 Apr.-16 Apr. | 12,000 | 28 | 210 | 218 | 5.5 | 45 | * |
| 1MF89B | 5 Apr.-16 Apr. | 12,000 | 72 | 83 | 119 | 6.6 | 53 | * |
| 2MF89 | 19 Apr.-5 May | 18,000 | 83 | 1246 | 1420 | 7.4 | 44 | yes |
| 3MF89 | 9 May-25 May | 23,000 | 112 | 767 | 845 | 6.8 | 42 | yes |
| 4MF89* | 28 May-6 Jun. | 32,000 | 95 | 539 | 448 | 5.1 | 34 | yes |
| 1MF90 | 8 Apr.-12 Apr. | 14,000 | 107 | 463 | 643 | 5.4 | 52 | * |
| 2MF90 | 6 May-15 May | 26,000 | 76 | 661 | 602 | 5.9 | 45 | no |
| 4MF90 | 27 May-5 Jun. | 34,000 | 126 | 357 | 315 | 4.3 | 40 | yes |
| 1MF91 | 31 Mar-13 Apr. | 5000 | 39 | 21 | 15 | 8.9 | 65 | * |
| 2MF91 | 15 Apr.-28 Apr. | 28,000 | 138 | 733 | 727 | 6.2 | 45 | * |
| 3MF91 | 30 Apr.-15 May | 27,000 | 102 | 230 | 322 | 5.2 | 40 | no |
| 4MF91 | 17 May-25 May | 45,000 | 82 | 62 | 64 | 4.0 | 50 | yes |
| 5MF91† | 22 Jul.-1 Aug. | 27,000 | 42 | 3 | 2 | 9.0 | 49 | * |
| 1MF92 | 3 Apr.-11 Apr. | 45,000 | 93 | 121 | 136 | 5.9 | 53 | * |
| 3MF92 | 30 Apr.-16 May | 48,000 | 85 | 560 | 932 | 6.5 | 50 | yes |
| 4MF92 | 17 May-29 May | 12,000 | 136 | 531 | 680 | 5.7 | 39 | yes |
Return to previous section or go to next section