U.S. Dept. of Commerce / NOAA / OAR / PMEL / Publications
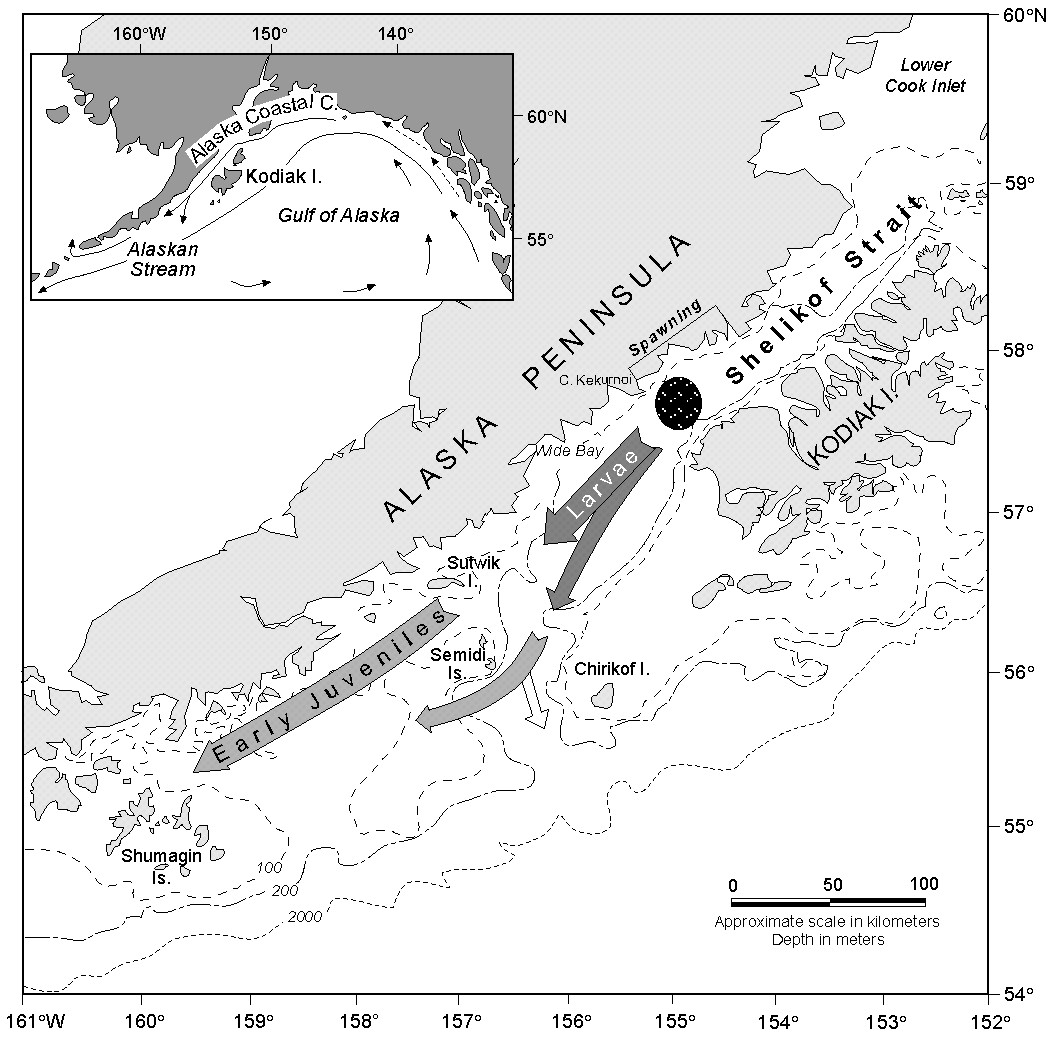
Figure 1. The study area in the western Gulf of Alaska with a schematic of pollock location as a function of life history stage. The sea valley extends southwestward from the northern end of Kodiak Island to the vicinity of Sutwik Island where it turns south toward the continental slope. The insert shows the location of the Alaska Coastal Current and the Alaskan Stream.
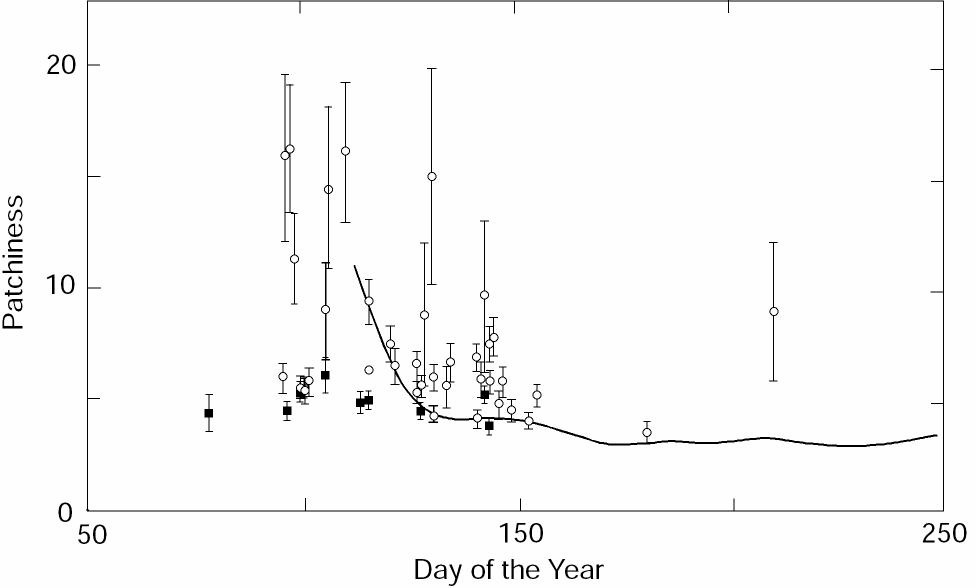
Figure 2. Estimates of Lloyd's index of patchiness for eggs (solid box) and larvae (open circle). Results from a given survey, regardless of egg or larval size (age), are shown as a function of the mean survey date. The error bars show the standard error of the index estimates. The heavy line shows the mean index for larvae from model results (Hermann et al., 1996a).
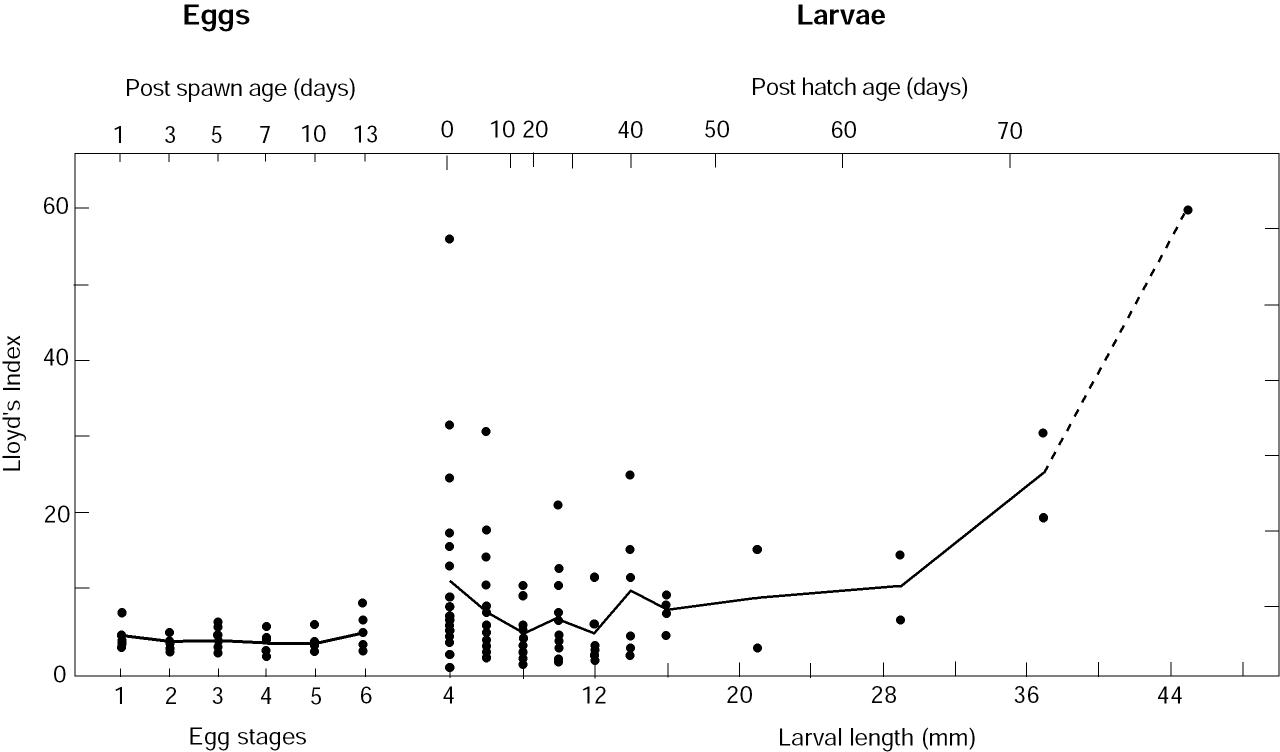
Figure 3. Lloyd's index of patchiness as a function of egg stages and larval length (age). Age was estimated using results from Bailey et al. (1996). Larvae were grouped by 2-mm bins for lengths <17 mm and by 8-mm bins for larger animals. Data sets that consisted of >90% zeros were not used. A line connects the mean values of P for each stage (eggs) and for each length bin (larvae).
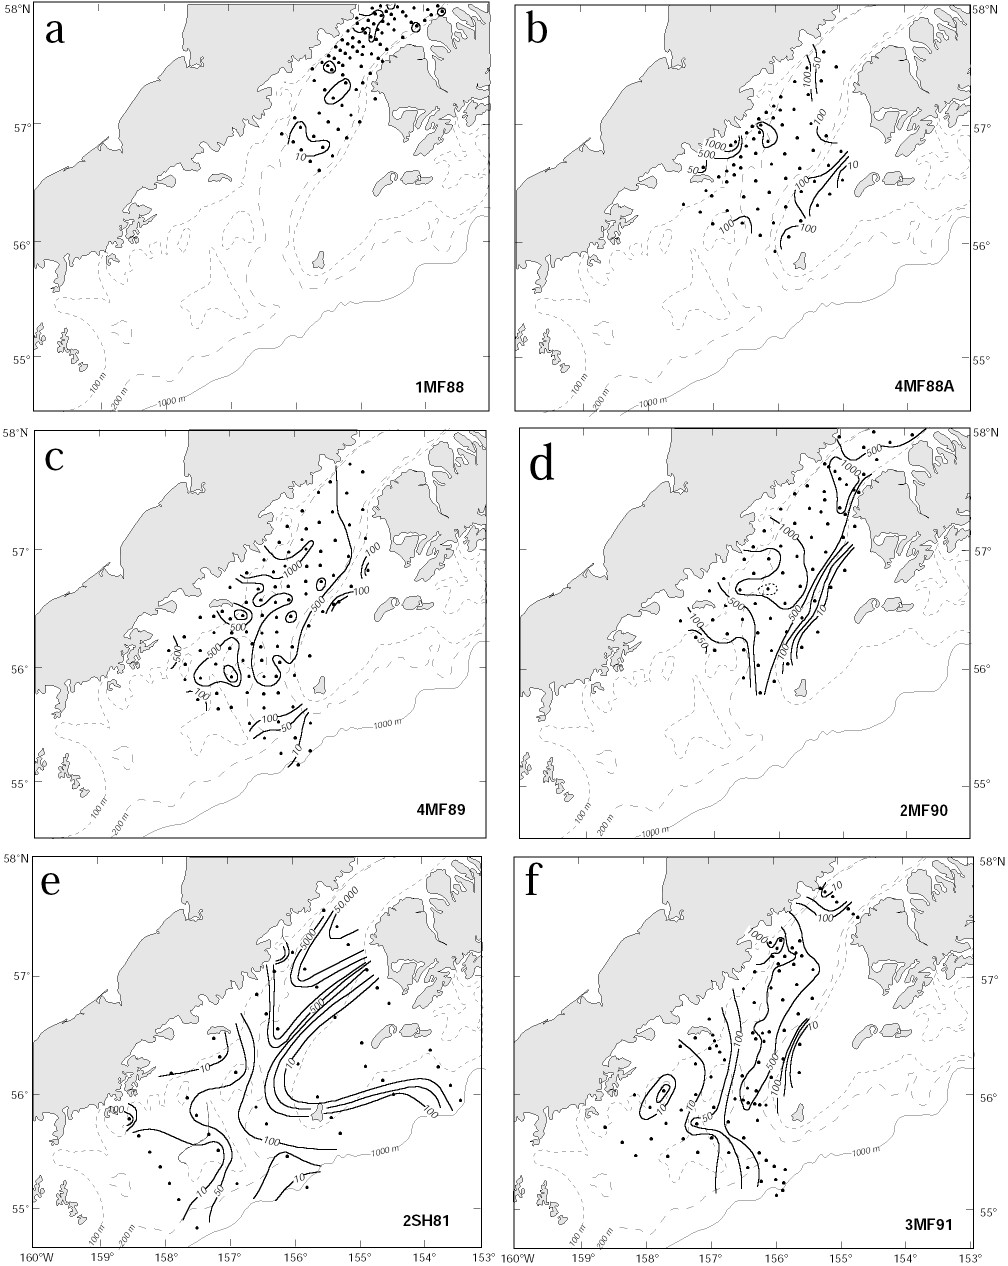
Figure 4. Contours of pollock larvae in Shelikof Strait. The three types of distributions are shown in panels: (a) transient event [1MF88], (b) and (c) Sutwik Island [4MF88A and 4MF89], and (d) eddy, 2MF90 (dotted line shows the 2,250 larvae/10 m2 contour). Panel (e) shows contours from the survey with the greatest abundance [2SH81] and an example of a high Lloyd's Index [P = 16.1]. Panel (f) shows a distribution with a low patchiness [P = 5.2; 3MF91]. Contour intervals are 10, 50, 100, 500, 1000, 5000, 10,000 and 50,000 larvae/10 m2.
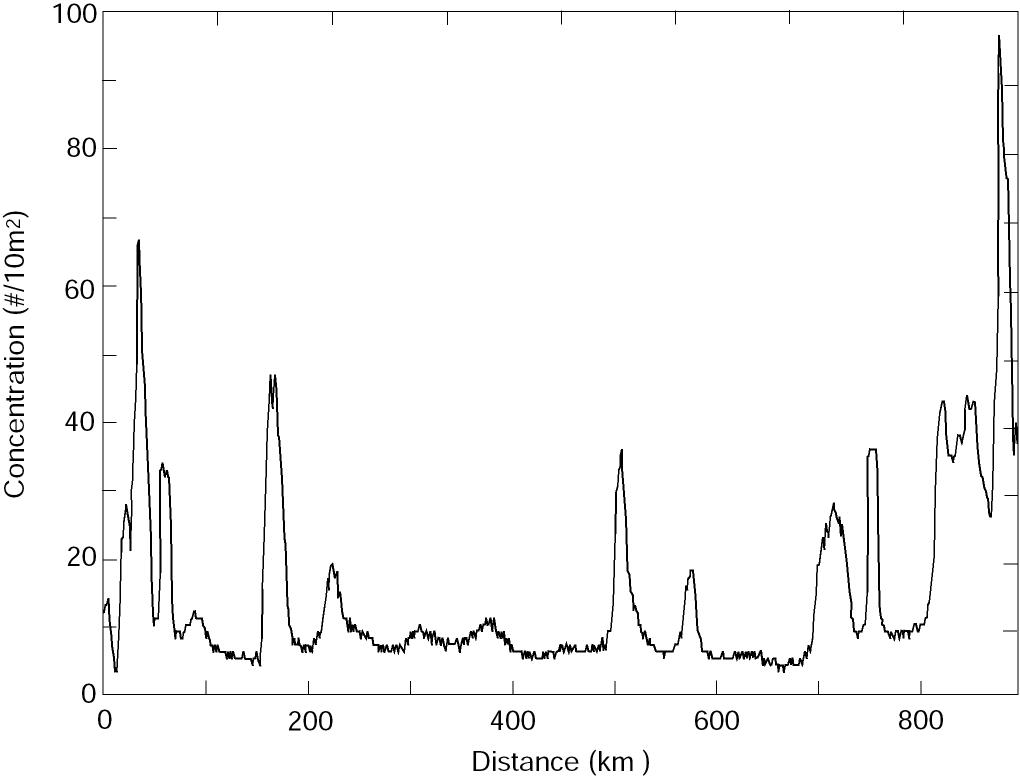
Figure 5. Concentration of newly hatched larvae as a function of distance downstream from midpoint of the hatching distribution from the advective model.
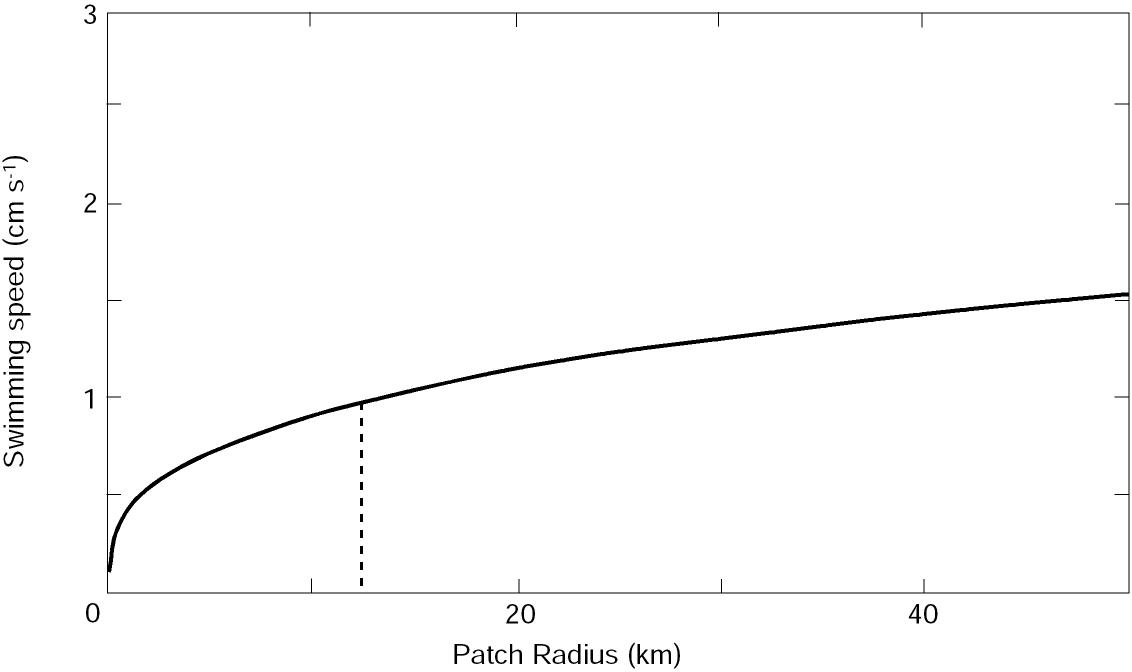
Figure 6. The relationship between larval swimming speed and the radius of a patch they are capable of maintaining in the presence of horizontal diffusion. See text for details of the model. Dashed line represents the approximate radius of eddies in Shelikof Strait and the resulting minimum radial swimming speed to maintain the larval patch against diffusion.
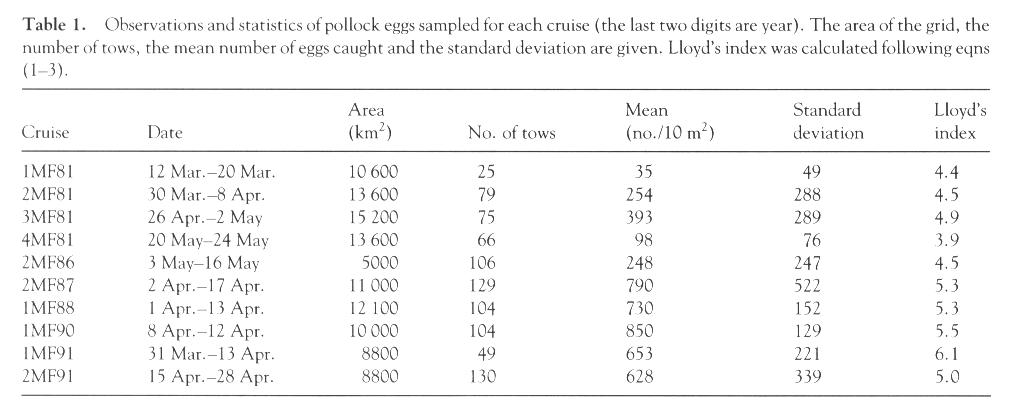
Table 1. Observations and statistics of pollock eggs sampled for each cruise (the last two digits are year). The area of the grid, the number of tows, the mean number of eggs caught and the standard deviation are given. Lloyd's index was calculated following eqns (1-3).
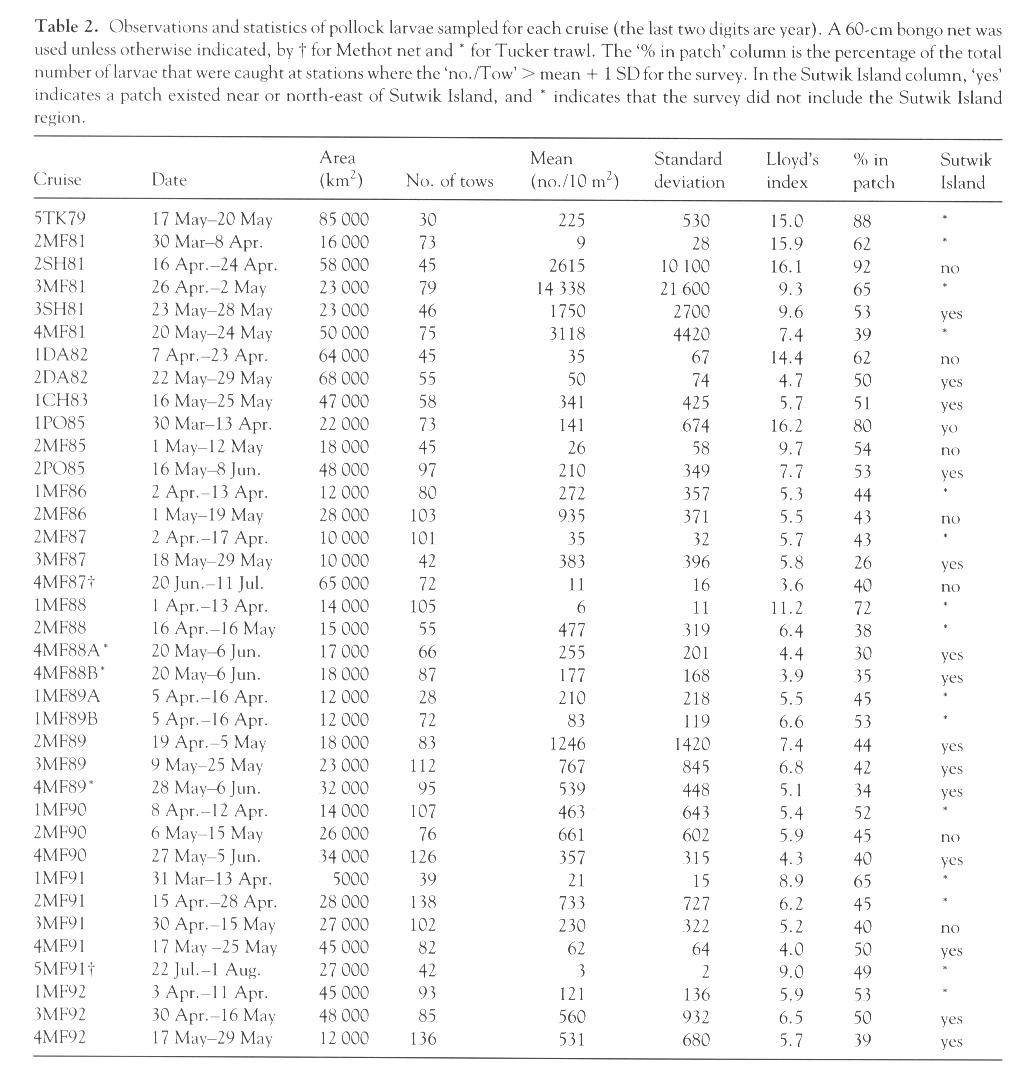
Table 2. Observations and statistics of pollock larvae sampled for each cruise (the last two digits are year). A 60-cm bongo net was used unless otherwise indicated, by † for Methot net and * for Tucker trawl. The "% in patch" column is the percentage of the total number of larvae that were caught at stations where the "no./Tow" > mean + 1 SD for the survey. In the Sutwik Island column "yes" indicates a patch existed near or northeast of Sutwik Island, and * indicates that the survey did not include the Sutwik Island region.
Return to previous section or go back to Abstract