High-quality temperature observations of the global deep ocean originate mostly from ship-based conductivity- temperature-depth (CTD) instruments. The international World Ocean Circulation Experiment (WOCE) Hydrographic Programme accomplished a full-depth high-resolution, high-accuracy, hydrographic survey of the global ocean in the 1990s, with coast-to-coast zonal and meridional sections crossing all major ocean basins. A key subset of these sections is being reoccupied in support of the Climate Variability and Predictibility (CLIVAR) and Carbon Cycle Science Programs, now coordinated by the international Global Ocean Ship-based Hydrographic Investigations Program (GO-SHIP). All occupations of the repeat sections that had publicly available CTD data posted online (at http://cchdo.ucsd. edu) as of July 2010 are considered here. Thus, the dataset used for this study is an aggregate of 28 full-depth, high-quality hydrographic sections that have been occupied two or more times between 1981 and 2010 (Figs. 1, 2). Throughout this study sections are referred to by their WOCE identification.
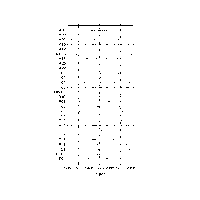
The first occupation of most sections was in the 1990s during WOCE with subsequent occupations, mostly during the 2000s, in support of the CLIVAR and Carbon Cycle Science Programs (Fig. 2). The nine sections with occupations prior to 1990 were sampled during the ramp-up to WOCE with the earliest occupation considered here being the 1981 occupation of A05. The most recent occupation included in this study is also of A05, completed in February 2010. Sections have a minimum of one occupation during WOCE followed by a second occupation 6–12 years later, with the exceptions of A01, A02, P03, and A13.5 (Fig. 2). Both A01 and A02 have multiple occupations available, but only in the 1990s. P03 and A13.5 were occupied in the 1980s and 2000s but have no occupations in the 1990s. The shortest time interval between the first and last occupation of a section is 3 years, for A02, from 1994 to 1997; the longest interval is 29 years, for A05, from 1981 to 2010. The mean and median time differences between first and last occupations for repeat sections are 12.9 and 11.9 yr, respectively.
Fig. 2. Occupation dates for each of the 28 repeated sections analyzed here listed by their WOCE designators (see Fig. 1 for locations). Lines extend over the entire period over which data were collected for a given occupation of a section. Longer lines indicate where multiple legs of sections taken over the course of up to a year or more are joined.
Data collected along each section are highly accurate and well sampled in the vertical and horizontal. Vertical profiles of temperature, conductivity, and pressure were collected at each station from the surface to a depth of 10–20 m from the bottom using a CTD. Horizontal station spacing was nominally 55 km, often less over rapidly changing bathymetry. Salinity was calculated from CTD conductivity, temperature, and pressure data and calibrated to bottle samples standardized with International Association for the Physical Sciences of the Oceans (IAPSO) standard seawater using the 1978 practical salinity scale (PSS-78). All temperature analysis here uses the 1968 international practical temperature scale (IPTS-68), applicable to the 1980 equation of state (EOS-80). WOCE (and GO-SHIP) CTD accuracy standards are 0.002 PSS-78 for salinity, 0.002°C for temperature, and 3 dbar for pressure (Joyce 1991). Some GO-SHIP cruises may achieve 0.001°C temperature accuracy.
We screen data prior to analysis based on two criteria: first, only data with good quality flags are used, and, second, each section is visually inspected to determine if the trackline of any given occupation was close enough to those of other occupations for comparison. Here trackline refers to the zonal or meridional line along which the sampling stations fell (as opposed to the locations of the stations themselves), typically following a nominal latitude or longitude (Fig. 1). Tracklines of reoccupations of most sections used here lie within 10 km of the original, with four exceptions: First, at the west end of A05 between 69° and 76°W the 1998, 2004, and 2010 occupations lie ∼220 km to the north of the 1981 and 1992 occupations. Second, the tracklines of the 1993 and 2003 occupations of A16 diverge by up to 88 km between 2° and 12°N. Third, south of 20°S along P16 the tracklines are consistently ∼40 km apart. Finally, between 85° and 91°W along I05 the trackline of the 1995 occupation reaches distances as much as 55 km from the tracklines of the 2002 and 2009 occupations. These variations are deemed useable because they occur in areas of small deep horizontal density gradients. However, in other areas where tracklines diverge by less than 200 km the data are not used here because the divergences occur in regions of large deep horizontal density gradients, such as the Southern Ocean. In addition, any data from tracklines falling on opposite sides of deep ridges are not used in this study.
The sections analyzed here were not necessarily occupied in a single leg by one ship (Fig. 2). Many of them were broken into multiple segments that sometimes span more than a single calendar year. These segments are aggregated into a single section for this analysis. Sections with more than one occupation in a single calendar year are treated as if all stations measured in that year were from one occupation. This aggregation applies to 14 sections: the 1990, 1991, 1992, 1994, 1995, 1996, and 1997 occupations of A01; the 1988/89 occupation of A16; the 1994/95 and 2007 occupations of I08/I09; the 1995 occupation of I09S; the 1999 and 2007 occupations of P01; the 1993/94 occupation of P02; the 2005/06 occupation of P03; the 1992 and 2003 occupations of P06; the 1992/93 and 2007 occupations of P14; the 1992 and 2005 occupations of P16; the 1991–93 occupation of P17; the 1994 and 2008 occupations of P18; the 1994 and 2009 occupations of P21; and the 1995 occupation of SR03.
Return to Introduction
Go to Next section