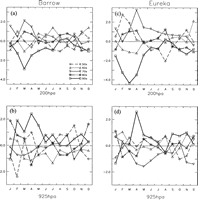
The decadal-scale variability in western Arctic temperatures is illustrated in Fig. 1 using data from the reanalysis at a grid point near Barrow, Alaska (72.5°N, 157.5°W), and Eureka, Canada (80°N, 85°W). Values are anomalies from the 1948–99 monthly means. Our base decade is 1989–98 because of a prominent shift in the AO in 1989, so that 1989 groups with the 1990s. We are most interested in documenting the changes accompanying the 1989 shift, rather than the more general problem of detecting shifts. Figures 1b and 1d show the decadal-averaged temperature anomalies for each month at the 925-hPa level for the 1950s through the 1990s. Figures 1a and 1c show their counterparts at the 200-hPa level in the lower stratosphere. Values at 200 hPa are qualitatively similar to other stratospheric levels. Values at 925 hPa are similar, but stronger than anomalies at higher-tropospheric levels.
FIG. 1. The monthly temperature anomaly averaged over each decade from the 1950s to 1990s at the closest grid point from (a), (b) Barrow, Alaska, and (c), (d) Eureka, Canada based on NCEP-NCAR reanalysis at (a), (c) 200 and (b), (d) 925 hPa.
At the 925-hPa level (Figs. 1b and 1d), prominent warm anomalies occurred during the 1990s at Barrow through the entire spring and at Eureka during April. The magnitudes of these anomalies for April in the 1990s are greater than the magnitude of the anomalies in any other month and any other decade. The springs of the 1960s through 1980s tended to be relatively cold at both stations. More detailed comparisons between the cool period of the 1980s and the warm period of the 1990s are presented in section 5. Note that the 925-hPa temperature records indicate that the western Arctic experienced a stronger response in spring than in winter to the 1989 shift in the AO (Thompson and Wallace 1998). In particular, the 925-hPa temperature anomalies at Barrow in the middle of winter (December–February), on the whole, were actually positive in the 1980s and near zero in the 1990s.
Lower-stratospheric temperatures, as indicated by the 200-hPa temperature anomalies in Figs. 1a and 1c, were relatively cool during spring in the 1990s, especially in March. Spring temperatures were relatively warm in the 1970s, and to a lesser extent, in the 1980s. In the lower stratosphere, at least at these two stations, the signature of the 1989 shift in the AO appears most prominent in March. This time of year is also when the zonal winds at Barrow had their greatest positive (westerly) anomalies at 200 and 925 hPa during the 1990s (not shown). Our results are consistent with the analysis of North American tropospheric and stratospheric temperature trends from radiosondes by Angell (1999) for the period of 1975–94.
It is clear that spring, on the whole, was colder aloft and warmer near the surface in the 1990s than in previous decades. It is instructive to consider how individual years contribute to these composites. Figure 2 shows March and April temperature anomalies at 200 and 925 hPa for Barrow as a function of year beginning in 1948. Prominent cold anomalies occurred at 200 hPa in March of 1990, 1993, 1995, and 1997. The magnitudes of these anomalies are roughly equivalent to their counterparts in earlier cold years (1956, 1960, 1967). The 1990s were cold as a whole because of the increased frequency of cold years. Similarly, the warm period of the 1970s through the mid-1980s is largely due to a preponderance of warm years, rather than due to an increase in the magnitudes of the anomalies in the warm years. The interannual fluctuations at 925 hPa have the same nature as those aloft. In particular, in April during most years in the 1980s (1990s) the 925-hPa temperature anomalies were negative (positive). Again it is the frequencies of these anomalies of like sign, rather than their magnitudes, that account for the decadal signal in 925-hPa temperature. There is a tendency for recent years with significant 200-hPa temperature anomalies in March to be followed by 925-hPa temperature anomalies of opposite sign in April. The year of 1984 had the coldest April of record at 925 hPa, and a substantial warm anomaly at 200 hPa in March. Of the six years in the 1990s with substantial warm anomalies at 925 hPa in April (1990, 1991, 1993, 1995, 1997, and 1998), four years had corresponding cold anomalies at 200 hPa in March (1990, 1993, 1995, and 1997).
FIG. 2. The monthly temperature anomaly at Barrow for Mar (solid line with square) and Apr (gray line with triangle) at (a) 200 and (b) 925 hPa.
Return to previous section or go to next section