U.S. Dept. of Commerce / NOAA / OAR / PMEL / Publications
Variability in the Eastern Equatorial Pacific Ocean During 1986-1988
Michael J. McPhaden and Stanley P. Hayes
NOAA/Pacific Marine Environmental Laboratory, Seattle, Washington
Journal of Geophysical Research, 95(C8), 13,195-13,208 (1990)
Not subject to U.S. copyright. Published in 1990 by the American Geophysical Union.
4. Temporal Variations at 110°W and 140°W
4.1 Winds
Figure 2 shows time series of winds, SST, dynamic
height 0/250 dbar, and 20°C isotherm depth at 110°W and 140°W. The zonal winds
at both locations tend to follow the normal seasonal cycle of strong southeasterlies
in the latter half of the year and weak southeasterlies in boreal spring. However,
easterly winds were weaker by about 1 m s at 140°W in 1987 and stronger by a similar amount at 110°W from January to July
1987. Meridional winds also tend to be stronger from the south in 1986-1987
during the ENSO and weaker from the south during 1988. The variations in local
meridional wind component may be due in part to enhanced (reduced) vertical
mixing in the atmospheric boundary layer during periods of warm (cold) equatorial
SST anomalies. As Wallace
et al. [1989] have shown, northward wind speed just 100 m above sea
level in the eastern equatorial Pacific are more than twice as strong as at
the surface. Wallace
et al. and Hayes
et al. [1989] have argued that SST variations near the equator affect
the stability of the atmospheric boundary layer and therefore the efficiency
with which momentum aloft is mixed down to the surface.
4.2 Sea Surface Temperature
SST at both locations was near normal for the first 4 months of 1986, followed
by a weak anomalous warming during May-July. Persistent anomalies of >1°C
then developed in September 1986 at both 110°W and 140°W and lasted until January-February
1988. The warmest SST anomalies occurred at 110°W in September 1987 (+3.4°C)
and at 140°W in June 1987 (+3.0°C). Cold anomalies developed abruptly in early
1988 following the ENSO. From March to May 1988, SST dropped nearly 8°C at 110°W,
and in April 1988, SST dropped 4°C at 140°W. Subsequently, 2°-3°C cold anomalies
persisted throughout 1988, with the coldest anomalies at 110°W in December 1988
(-3.7°C) and at 140°W in November 1988 (-4.0°C).
The development of these anomalies is not obviously related to the local zonal
winds. Coincident with the warm SST anomalies in 1986 and 1987, the zonal wind
component was either close to or weaker than normal at 140°W, whereas it was
close to or stronger than normal at 110°W. A consistent argument in terms of
anomalous Ekman divergence and local upwelling is not possible for both locations.
Also, the precipitous drop in SST in the spring of 1988 occurred at a time when
the local zonal winds were near normal, again ruling out anomalous local Ekman
divergence as the causative mechanism.
4.3 Dynamic Height and 20°C Isotherm Depths
Surface dynamic height and the depth of the 20°C isotherm (which is an index
for the depth of the thermocline) tend to be mirror images of one another at
110°W and 140°W, similar to what Rebert
et al. [1985] found throughout the equatorial Pacific. The mean seasonal
cycle in both variables is dominated by the annual and semiannual harmonics
with an annual range in dynamic height of 5 dyn. cm (110°W) and 13 dyn. cm (140°W)
and an annual range in 20°C isotherm depth of 19 m (110°W) and 42 m (140°W).
In contrast, we note that during 1986-1988, variability is dominated by an interannual
rise in the dynamic height from 1986 to 1987 and subsequent drop into 1988,
and an intraseasonal variation with periods of 2-3 months. The amplitude range
of both these time scales is larger than the annual range. The 20°C isotherm
depth, for example, shoaled by over 100 m at 110°W from January 1987 to June
1988 when it broke the surface; similarly, the 20°C depth ranged between 180
m and 0 m at 140°W from 1987 to 1988. These changes and similar ones in dynamic
height are large enough to obscure the mean seasonal cycle in these variables
during 1986-1988.
On interannual time scales there is a tendency for warm SST anomalies to correspond
to high surface height and depressed thermocline, and vice versa. This is most
evident at 110°W, where the mooring climatologies (and therefore anomalies)
are better defined. For example, persistent warm anomalies, elevated dynamic
heights, and depressed 20°C isotherm depths develop in September 1986 and last
until late 1987 to early 1988. Similarly, cold SSTs in March-May 1988 set in
with a 40-m rise in the depth of the 20°C isotherm and a 10 dyn. cm drop in
dynamic height. As with SST, the interannual changes in dynamic height and 20°C
isotherm depths cannot be simply related to local zonal wind variations.
Much of the intraseasonal variability with periods of 2-3 months in Figure
2 is due to the excitation of first baroclinic mode Kelvin waves. McPhaden
and Taft [1988] discussed these wave time series spanning 110°-140°W
for the period November 1983 to June 1986, the last 5 months of which overlaps
with the present study. They found a nearly in-phase relationship of zonal velocity,
thermocline temperature, and dynamic height which propagated eastward at approximately
210 cm s . The eastward phase propagation
can be seen visually in Figure 3a for
dynamic height 0/250 dbar and in Figure 3b
for dynamic height 80/250 dbar (in the thermocline near the mean position of
the Equatorial Undercurrent core). Well-defined peaks and troughs at 140°W lead
those at 110°W by about 2 weeks, implying phase speeds in approximate agreement
with those reported by McPhaden
and Taft [1988]. One can also see the expected Kelvin wave relationship
between zonal currents and 20°C isotherm depths by comparing Figures
2a and 4. The 2- to 3-month periodicity
is most apparent in zonal currents in the thermocline at depths below the Undercurrent
core where the seasonal cycle and the 20- to 30-day instability waves are of
diminished amplitude. By overlaying the 20°C isotherm depth time series in Figure
2a and the zonal currents at, say, 120 m in Figure
4, one would find that on intraseasonal time scales a depression of the
thermocline corresponds to enhanced eastward velocity and vice versa. This is
also evident in the decadal time series shown in Plate
2. There is no obvious evidence in the local winds for the energetic 2-
to 3-month periods observed in the oceanic data sets (Figure
2), implying that the variability must be nonlocally forced as previously
inferred by Enfield
[1987] and McPhaden
and Taft [1988].
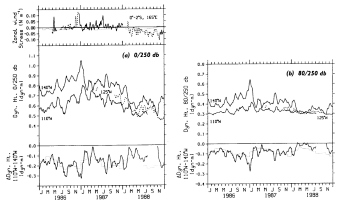
Figure 3. Time series of dynamic height (a) at the surface relative
to 250 dbar and (b) at 80 dbar relative to 250 dbar. The 0°, 125°W time
series is indicated by a dashed line for clarity. Also shown are the dynamic
height differences over 110°-140°W superimposed on the mean seasonal cycle of
dynamic height difference. Wind stress at 0°, 165°E (solid line) and 2°, 165°E
(dashed line) appear in Figure 3a superimposed
on the Wyrtki
and Meyers [1975] stress climatology. Daily data have been smoothed
with an 11-day Hanning filter.
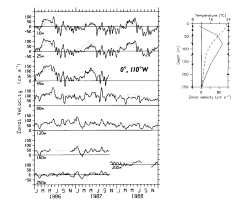
Figure 4. Time series of zonal velocity in the upper 250 m superimposed
on estimates of the monthly mean seasonal cycle. Daily data have been smoothed
with an 11-day Hanning filter. Shown at night are the depths of the velocity
measurements relative to the 5-year mean profile of zonal velocity (solid line)
and temperature (dashed line). Depths on the ordinates are for January 1986
to October 1987 (left) and October 1987 to October 1988 (right).
Figure 3 also shows the difference between dynamic
height at 110°W and 140°W, which is proportional to the zonally averaged zonal
pressure gradient across these longitudes. The mean seasonal cycle indicates
dynamic height differences at the surface (0/250 dbar) and in the thermocline
(80/250 dbar) that are weakest in the spring and strongest in the fall, in approximate
balance with the mean seasonal cycle of zonal wind stress [McPhaden
and Taft, 1988]. During 1986-1988, dynamic height differences are modulated
by intraseasonal wave activity with peak-to-peak amplitudes larger than the
annual range. There are in fact a few occasions of  1 month duration when the height difference across 110°W-140°W nearly vanishes
because of these waves. Height differences vary interannually as well across
110°W-140°W: magnitudes are larger than normal in 1986 and smaller than normal
in 1988, during which near-zero values are observed for several consecutive
months in the thermocline in the early part of the year.
Dynamic height differences on a smaller zonal scale can be inferred from additional
data at 0°, 125°W during 1987-1988. Differences are generally smaller between
110°W and 125°W than between 125°W and 140°W, and there are periods of  1
month when the 0-/250-dbar and 80-/250-dbar surfaces are 1-2 dyn. cm higher
at 110°W than at 125°W. This is consistent with the zonal variations in thermocline
slope along the equator in 1988 as seen in Plate
4 and implies a weaker driving force for the Equatorial Undercurrent at
110°W as compared to 140°W.
1
month when the 0-/250-dbar and 80-/250-dbar surfaces are 1-2 dyn. cm higher
at 110°W than at 125°W. This is consistent with the zonal variations in thermocline
slope along the equator in 1988 as seen in Plate
4 and implies a weaker driving force for the Equatorial Undercurrent at
110°W as compared to 140°W.
4.4 Undercurrent Variations
Figure 4 shows time series of zonal velocity
in the upper 200-250 m at 110°W. The location of the current meters relative
to the mean current and temperature structure at 110°W is shown at night. There
is a significant amount of 20- to 30-day instability wave energy in these time
series which tends to obscure lower-frequency fluctuations. However, two periods
of pronounced Equatorial Undercurrent weakening are evident. The first is February-March
1987 in the upper 250 m when flow is on average 25-50 cm s weaker than normal; the second is December 1987 to December 1988 at 80-120 m
(in and below the mean depth of the Undercurrent core) when flow is 20-25 cm
s
 weaker than normal. In part these reductions
in eastward flow at fixed levels are due to vertical excursions of the thermocline
in which the Undercurrent is embedded (compare the upper and lower panels of
Plate 2). Depression of the thermocline in
early 1987 leads to anomalously westward flow above the Undercurrent core, whereas
elevation of the thermocline in 1988 leads to anomalously westward flow below
the Undercurrent core. However, these westward flow anomalies are not entirely
compensated by eastward flow anomalies below the Undercurrent core in early
1987 or above the Undercurrent core in 1988, as would be expected if vertical
displacements were the only influence on the velocity records. Thus there is
a large net reduction in transport per unit width during February-March 1987
and during 1988 relative to the normal seasonal cycle at 110°W (Figure
5a). The prolonged reduction in 1988 moreover is consistent with
diminished isothermal spreading in the thermocline near the equator (Plate
3), and diminished zonal pressure gradient at the surface and in the thermocline
(Figure 3). At 140°W in contrast, the transport
per unit width is near normal during most of 1988 (Figure
5b), possibly due to the presence of stronger zonal pressure gradients
in the thermocline between 140°W and 125°W vis-à-vis between 125°W and 110°W,
as suggested by Plate 4 and Figure
3b.
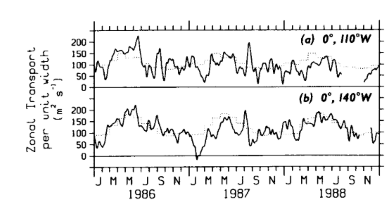
Figure 5. Zonal transport per unit width (10-200 m) at (a) 0°, 110°W
and (b) 0°, 140°W superimposed on estimates of the monthlv mean seasonal
cycle. Daily data have been smoothed with an 11-day Hanning filter.
The reduction in Equatorial Undercurrent speed and eastward transport at 110°W
in February-March 1987 is mirrored in an even more dramatic collapse of eastward
transport in the upper 200 m at 140°W about 1 month earlier (Figure
5b). This collapse roughly coincides with the dynamic height trough
associated with the strongest cycle of intraseasonal wave variability during
1986-1988. Figures 6 and 7
show the vertical profiles of velocity and temperature for February 1987, which
is the period bracketed by the minimum transports at 110°W and 140°W. Also plotted
are February profiles for 1983-1988 at 110°W and 1984-1988 at 140°W. It is clear
that February 1987 zonal currents are the weakest of the 5 to 6-year period
shown in Figures 6 and 7,
with the exception of February 1983 at 110°W during the previous ENSO when the
Undercurrent disappeared [Halpern,
1987a]. The Undercurrent does not disappear during the 1986-1987
ENSO, but in February 1987 it is significantly reduced in speed especially at
140°W, where its core velocity is only 45 cm s . It is also evident that this reduction is not due to a meridional advection
of the Undercurrent off the equator. Average meridional velocities in February
1987 are near zero in the thermocline and are not significantly different from
the meridional velocities during other years.
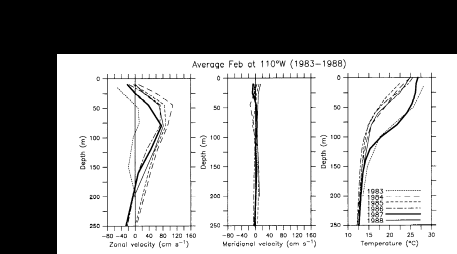
Figure 6. Profiles of monthly mean zonal velocity, meridional velocity,
and temperature in the upper 250 m for each February from 1983 to 1988 at 0°,
110°W.
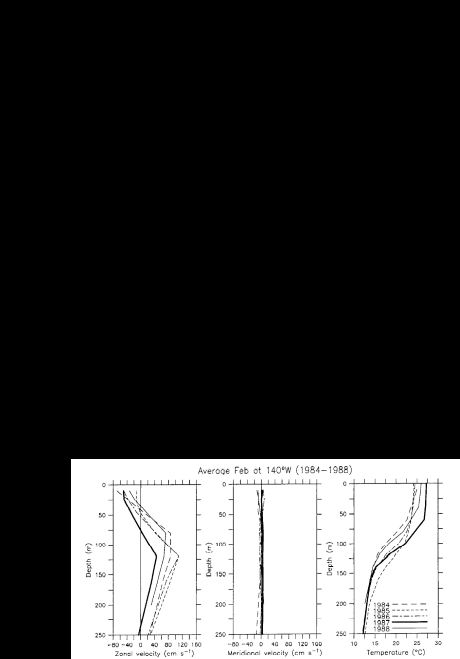
Figure 7. Profiles of monthly mean zonal velocity, meridional velocity,
and temperature in the upper 250 m for each February from 1984 to 1988 at 0°,
140°W.
4.5 Relationship of Zonal Currents to Surface Temperature
Typically at 110°W, flow at 10 m is eastward from March to June (the springtime
reversal of the South Equatorial Current) and westward the remainder of the
year ( Figure 4). However, in 1986 the springtime
reversal in March-June is 31 cm s stronger
to the east, and the South Equatorial Current in September-November is 32 cm
s
 weaker to the west. (See Figure
10 for low-pass versions of 10-m zonal currents and SST at 110°W.) Both
these periods correspond to periods of enhanced eastward transport as well (
Figure 5a).
The stronger than normal springtime reversal occurs when the magnitude of the
zonal SST gradient is typically weakest along the equator (e.g., - T/
T/ x
~ 0.2-0.3 × 10
 °C m
°C m during boreal spring between 110°W and 140°W based on Reynolds'
[1988] climatology), so that one might expect anomalous advective warming
during this time of <1°C. Consistent with this, the observed SST anomaly
was 0.5°C during March-June 1986 at 110°W; allowing for a 1-month lag in response
to changing zonal currents, the anomaly was 0.7°C during April-July 1986. These
are of questionable significance given the uncertainties in estimating anomalies
as discussed in section 2 and Appendix B. Conversely, during the boreal fall,
SST gradients along the equator between 110°W and 140°W are typically strongest
(i.e., -
 T/
T/ x
~ 0.8-1.0 × 10
 °C m
°C m ).
At 32 cm s
 zonal current anomaly acting
on a gradient of this magnitude for 3 months would produce a warm SST anomaly
of approximately 2°C, comparable to the average 1.4°C (1.3°C) anomaly actually
observed in September-November (October-December) 1986. These observations are
consistent with the model results of Harrison
and Schopf [1984], who argued that advective warming in the eastem Pacific
by anomalous currents should be more pronounced in boreal fall than in boreal
spring because of the relative strength of the zonal SST gradients during these
seasons. Note also that in boreal fall 1986, anomalously weak westward flow
was accompanied by a thermocline depression of 20-40 m at 110°W (Figure
2a). Hence local upwelling, which would continue unabated because
of near-normal local easterlies, would bring warmer water to the surface and
contribute to the development of SST anomalies. A similar sequence of events
occurred at 140°W in 1986 (not shown), with weaker than normal westward flow
in the South Equatorial Current and a deeper than normal thermocline associated
with the development of SST anomalies of >1°C.
Zonal current anomalies at 10 m are less obviously related to SST anomalies
at other times during 1986-1988. In particular, rapid cooling that occurs during
the termination of the warm event in early 1988 coincides with a near-normal
eastward springtime reversal at 110°W and 140°W (Figures
4 and 10). At 110°W the reversal starts late
but finishes strong such that the eastward flow from March to June 1988 is within
1 cm s of the mean seasonal average. Thus
SST cooling of nearly 8°C from March to May at 110°W cannot be due to surface
zonal advection, which would tend to produce weak warming. It is more likely
that uplift and entrainment of thermocline waters into the surface layer as
suggested by the rapid coincidental shoaling 20°C isotherm in Figure
2 is the mechanism generating anomalously cold SSTs in early 1988. This
upwelling may in part be related to the anomalous zonal convergence in eastward
mass transport that develops in early 1988 between 110°W and 140°W (Figure
5). In the mean, the equatorial SST minimum is maintained by eastward transport
of cold thermocline water which is continuously upwelled and transported poleward
in the surface layer [Bryden
and Brady, 1985]. Mass continuity requires that anomalous zonal convergence
be balanced by enhanced divergence on the meridional plane, which could intensify
this upwelling circulation and lead to additional surface cooling. Consistent
with this hypothesis, the coldest SST anomalies in 1988 were found between 110°W
and 140°W as, for example, can be seen in the June 1988 chart shown in Plate
1.
Go back to previous section or
forward to next section
PMEL Outstanding Papers
PMEL Publications Search
PMEL Homepage
 at 140°W in 1987 and stronger by a similar amount at 110°W from January to July
1987. Meridional winds also tend to be stronger from the south in 1986-1987
during the ENSO and weaker from the south during 1988. The variations in local
meridional wind component may be due in part to enhanced (reduced) vertical
mixing in the atmospheric boundary layer during periods of warm (cold) equatorial
SST anomalies. As Wallace
et al. [1989] have shown, northward wind speed just 100 m above sea
level in the eastern equatorial Pacific are more than twice as strong as at
the surface. Wallace
et al. and Hayes
et al. [1989] have argued that SST variations near the equator affect
the stability of the atmospheric boundary layer and therefore the efficiency
with which momentum aloft is mixed down to the surface.

 1
month when the 0-/250-dbar and 80-/250-dbar surfaces are 1-2 dyn. cm higher
at 110°W than at 125°W. This is consistent with the zonal variations in thermocline
slope along the equator in 1988 as seen in


 T/
T/ °C m
°C m