 [Large
and Pond, 1981] and air density of 1.2 kg m.
The mooring wind time series have been adjusted to 10 m anemometer height assuming
a neutral stability, constant stress layer.
[Large
and Pond, 1981] and air density of 1.2 kg m.
The mooring wind time series have been adjusted to 10 m anemometer height assuming
a neutral stability, constant stress layer.U.S. Dept. of Commerce / NOAA / OAR / PMEL / Publications
In the preceding section it was suggested that much of the variability observed
in the eastern equatorial Pacific during 1986-1988 could not be explained solely
in terms of local wind forcing. We explore this issue in more detail by examining
time series of wind stress from six locations along the equator spanning 110°W
to 165°E. Stress has been calculated assuming a drag coefficient of 1.2 × 10
[Large
and Pond, 1981] and air density of 1.2 kg m.
The mooring wind time series have been adjusted to 10 m anemometer height assuming
a neutral stability, constant stress layer.
Figure 8 shows the zonal wind stress component
overplotted on the mooring climatologies (110°W and 140°W) and the Wyrtki
and Meyers [1975] stress climatology (165°E, Nauru, Baker, and Christmas
islands). The 165°E time series (which is also plotted in Figure
3) shows westerly or anomalously weak easterly winds for most of mid-1986
to early 1988. This is followed by anomalously strong easterly wind stresses
of up to 0.05 N m during March-December
1988. The winds in 1986-1987 are also frequently punctuated by episodes of strong
westerlies lasting 10 days to 2 months, most notably in May 1986, November-December
1986, and June-July 1987. Variations on both these intraseasonal time scales
and on interannual time scales exceed those for the mean seasonal cycle, which
has a range of only 0.03 N m at this location.
during March-December
1988. The winds in 1986-1987 are also frequently punctuated by episodes of strong
westerlies lasting 10 days to 2 months, most notably in May 1986, November-December
1986, and June-July 1987. Variations on both these intraseasonal time scales
and on interannual time scales exceed those for the mean seasonal cycle, which
has a range of only 0.03 N m at this location.
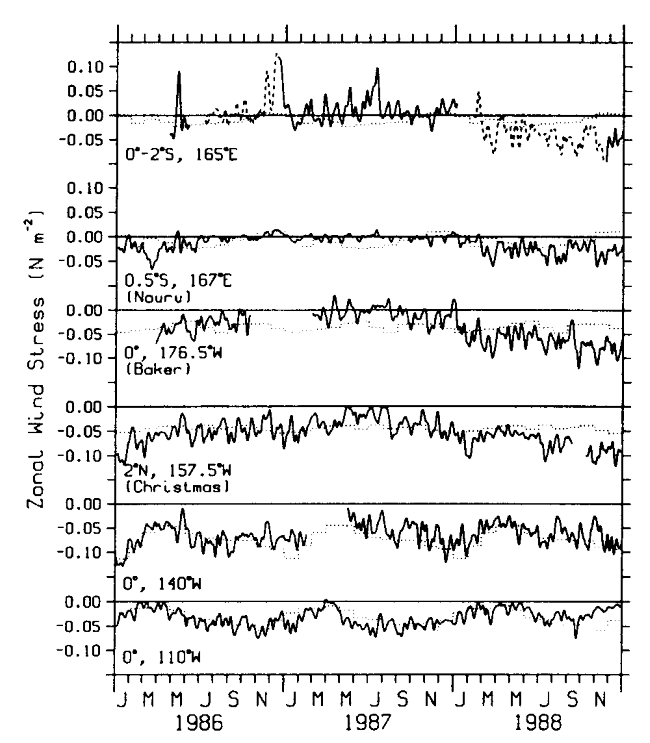
Figure 8. Time series of zonal wind stress at various locations in the equatorial Pacific. Data at 165°E are from 0° (solid line) and 2°S (dashed line). Superimposed are estimates of the monthly mean seasonal cycle from Wyrtki atid Meyers [1975] for Nauru, the moorings at 165°E, Baker, and Christmas. Mooring mean seasonal cycles are overplotted on the 140°W and 110°W time series. Daily data have been smoothed with an 11-day Hanning filter.
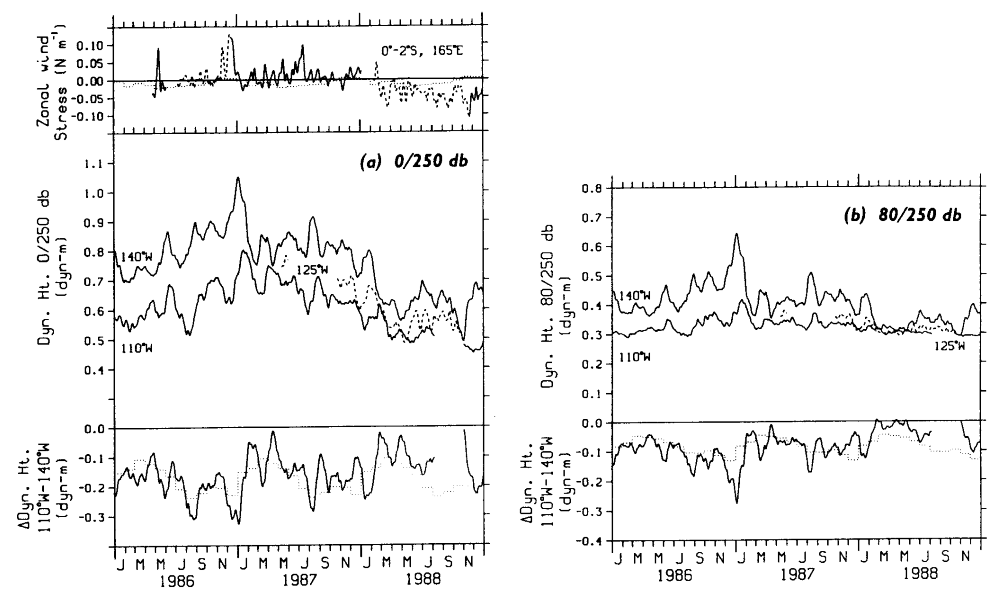
The remote response to the May 1986 wind burst has been discussed by Miller
et al. [1988], McPhaden
et al. [1988, 1989],
and Harrison
and Giese [1989]. The May westerly wind burst excited a Kelvin wave
which could be traced all the way to the South American coast. Its signature
may be seen in the dynamic height time series in Figure
3, in the current time series in Figure 4,
and in the transport time series in Figure 5.
Eastward propagating pulses in dynamic height appear at other times as well,
as, for example, following the November-December 1986 and June-July 1987 westerly
wind events. In each case the time lag between the maximum wind stress and maximum
dynamic height at 140°W implies a zonal phase speed of approximately 2-3 m s ,
comparable to first baroclinic mode Kelvin wave phase speeds along the equator.
,
comparable to first baroclinic mode Kelvin wave phase speeds along the equator.
Figure 8 shows that pronounced westerly wind events are confined to west of the date line. However, lower-frequency interannual variations are not. In particular, a weakening of the easterlies can be seen as far west as 140°W in 1987, and stronger than normal easterlies prevail between 165°E and 157°W in 1988. To highlight the large-scale interannual variations, we computed monthly averaged wind anomalies in both the meridional and zonal directions and then smoothed them with a 1-2-1 filter in time. The results are shown in Figure 9. As discussed in Appendix B, the Wyrtki and Meyers [1975] climatology is weaker at 110°W and 140°W than the mooring climatologies. Hence, if Figure 9 were plotted using the Wyrtki and Meyers stress climatology at all locations, 110°W and 140°W would show stronger easterly anomalies and weaker westerly anomalies. Also recall that westerly winds are underestimated at Nauru because of topographic shielding.
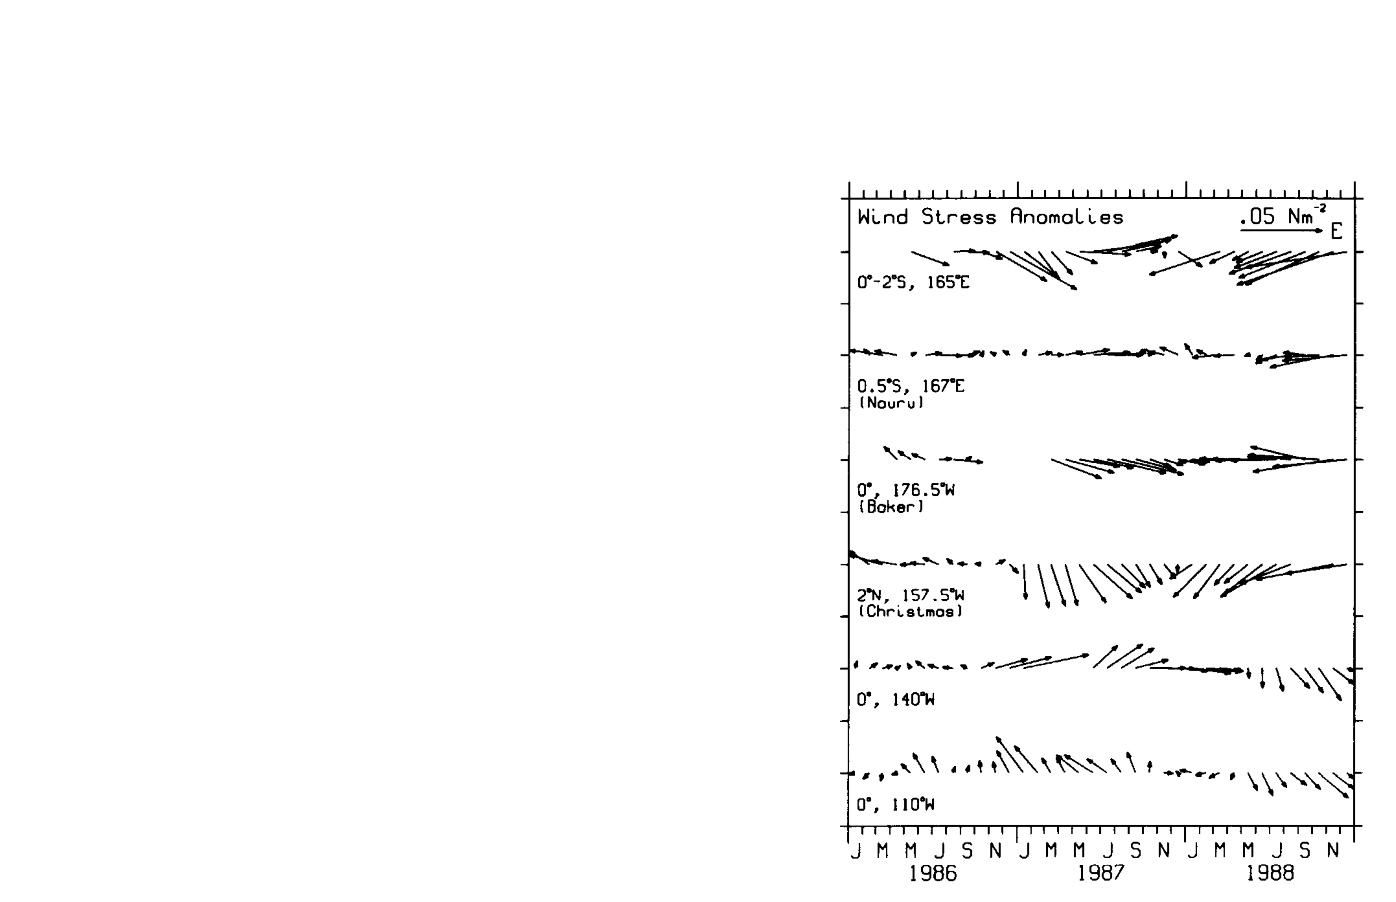
Figure 9. Monthly mean vector wind stress anomalies corresponding to the time series in Figure 8.
Figure 9 shows that easterlies were stronger
than normal by about 0.01-0.02 N m between
167°E and 157°W in early 1986. Then in mid-1986, westerly anomalies of similar
magnitude developed at 165°E, Nauru, and Baker islands; at 165°E these anomalies
intensified to nearly 0.05 N m during the
November-December 1986 westerly wind event. During 1987, westerly anomalies
of  0.02 N m
could be found between 165°E and 140°W, the largest of which (0.05 N m)
occurred between 165°E and 176°W. Westerly anomalies diminished in late 1987
and were replaced by easterly anomalies which persisted until the end of 1988
between 165°E and 157°W.
0.02 N m
could be found between 165°E and 140°W, the largest of which (0.05 N m)
occurred between 165°E and 176°W. Westerly anomalies diminished in late 1987
and were replaced by easterly anomalies which persisted until the end of 1988
between 165°E and 157°W.
It is interesting that the largest zonal wind stress anomalies at 110°W tend to be directed opposite to those in the central Pacific during 1987-1988. Specifically, when the winds are anomalously westerly (easterly) in 1987 (1988) at Nauru, Christmas, and Baker islands, the winds at 110°W are anomalously easterly (westerly). The distribution of zonal winds along the equator in 1987 is similar to that documented by Rasmusson and Carpenter [1982] during the mature phase of their composite El Nińo. These zonal variations in this wind field may be related to east-west displacements of the "Walker cell," a thermally direct atmospheric circulation on the equatorial place driven by SST-induced heating [Gill, 1982]. A detailed analysis of the relationship between surface winds, SST, and atmospheric heating is beyond the scope of this study, however.
Go back to previous section or forward to next section