U.S. Dept. of Commerce / NOAA / OAR / PMEL / Publications
Kousky and Leetmaa [1989] have described the planetary scale evolution of the 1986-1987 El Niño/Southern Oscillation (ENSO) event using satellite data and general circulation model analyses. Warm sea surface temperature (SST) anomalies began to develop in the equatorial Pacific Ocean in mid-1986, indicating the onset of the event. These anomalies persisted throughout 1987, during which the trade winds weakened in the central and western Pacific and anomalous deep atmospheric convection developed near the date line. The southern oscillation index (SOI), which is a measure of the driving force for the Pacific trade winds, reached its second lowest value in nearly 20 years in mid-1987. (The SOI was lower only in 1982-1983 during the most intense ENSO of the century.) The 1986-1987 ENSO was over by early 1988, after which the ocean-atmosphere system rebounded with the coldest equatorial SST anomalies and the highest SOI values since the mid-1970s [Climate Analysis Center, 1988].
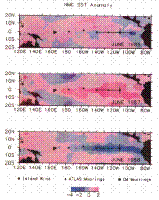
Plate 1 illustrates the interannual changes in SST in the tropical Pacific from near-normal conditions in the central and eastern Pacific in June 1986 (patchy SST anomalies along the equator typically <1°C in magnitude) to warm ENSO conditions in June 1987 (basin scale warm SST anomalies of >1°C) to colder than normal conditions in June 1988 (SST anomalies of -3°C in the eastern equatorial Pacific). The occurrence of warm ENSO SST anomalies in the equatorial Pacific is associated with a characteristic global pattern of climatic variability [Ropelewski and Halpert, 1986, 1987], and in many respects the global effects of the 1986-1987 ENSO fit this pattern [Kousky and Leetmaa, 1989]. In addition, the cold equatorial SST anomalies following the 1986-1987 ENSO were believed to contribute in part to the severe North American drought during the summer of 1988 [Trenberth et al., 1988; Palmer and Brankovic, 1989]. Understanding the mechanisms responsible for equatorial SST anomalies is therefore one of the central themes of the Equatorial Pacific Ocean Climate Studies (EPOCS) program [Hayes et al., 1986] and the Tropical Ocean-Global Atmosphere (TOGA) program [National Academy of Sciences, 1988].
Plate 1. Sea surface temperature anomalies for June 1986, June 1987, and June 1988 based on analyses from the National Meteorological Center Climate Analysis Center [Reynolds, 1988]. Superimposed are the locations of time series measurements from current meter moorings (squares), ATLAS moorings (diamonds), and island wind stations (circles). Also shown are the locations of CTD sections along the equator and along 110°W.
The purpose of this study is to describe oceanic variability in the eastern equatorial Pacific during 1986-1988 using in situ measurements of wind, current, temperature, and salinity from moored buoys, islands, and research vessels. It is possible from this description to provide a preliminary, qualitative evaluation of processes responsible for some of the interannual changes in the current and hydrographic structure of the eastern equatorial Pacific. A complementary study [McPhaden et al., 1990a] discusses variability in the western equatorial Pacific during 1986-1988.
The paper is organized as follows. Data sources and processing are described in section 2. Some details dealing with data gaps, gridding, and the estimation of mean seasonal cycles are relegated to appendices for the sake of brevity. Section 3 discusses the regional scale hydrography of the eastern equatorial Pacific during 1986-1988. Time series variability at 110°W and 140°W is then described in section 4, and the extent to which this variability may be remotely versus locally forced is discussed in section 5. Section 6 compares variability in the eastern equatorial Pacific during the 1982-1983 ENSO and the 1986-1987 ENSO, using long time series from 0°, 110°W (Plate 2). The paper concludes with a summary and discussion of the most relevant results in section 7.
Plate 2. Contour plots of temperature (in degrees Celsius) and zonal velocity (in centimeters per second) for 1980-1989. Daily data have been gridded according to procedures described in Appendix A and smoothed to approximately monthly means using a 51-day filter [Bendat and Piersol, 1971].
Go back to Abstract or forward to next section