U.S. Dept. of Commerce / NOAA / OAR / PMEL / Publications
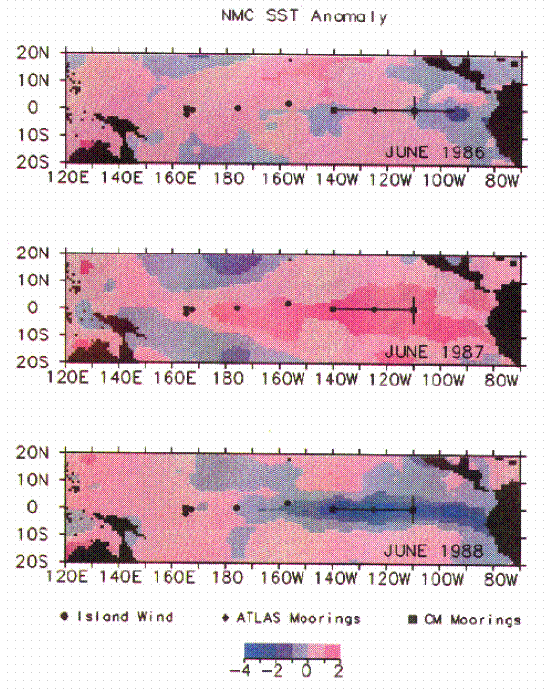
Plate 1. Sea surface temperature anomalies for June 1986, June 1987, and June 1988 based on analyses from the National Meteorological Center Climate Analysis Center [Reynolds, 1988]. Superimposed are the locations of time series measurements from current meter moorings (squares), ATLAS moorings (diamonds), and island wind stations (circles). Also shown are the locations of CTD sections along the equator and along 110°W.
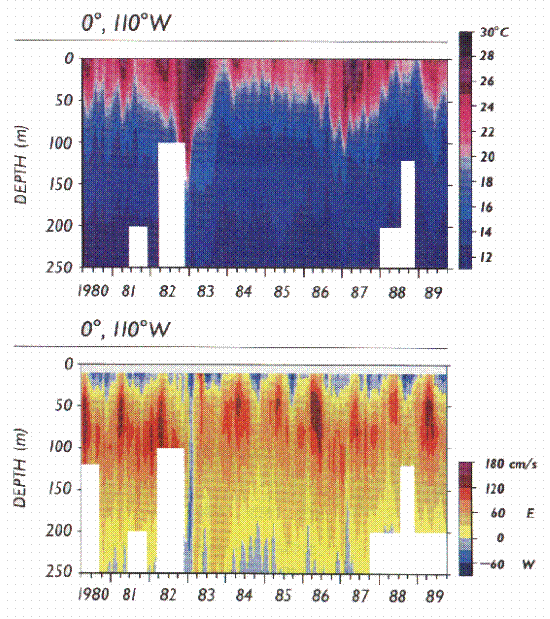
Plate 2. Contour plots of temperature (in degrees Celsius) and zonal velocity (in centimeters per second) for 1980-1989. Daily data have been gridded according to procedures described in Appendix A and smoothed to approximately monthly means using a 51-day filter [Bendat and Piersol, 1971].
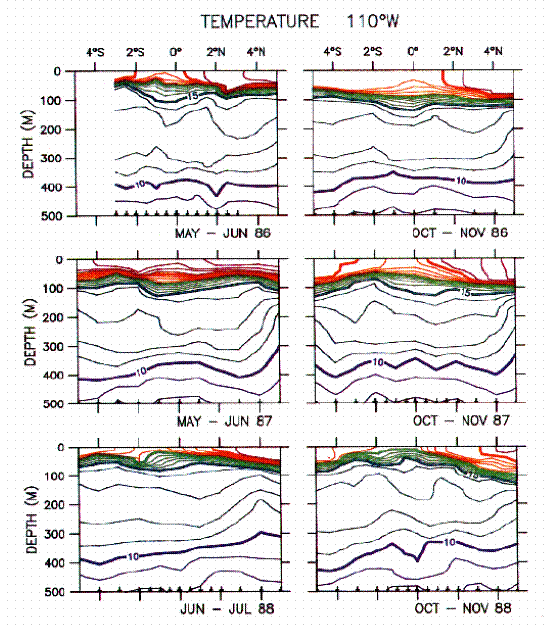
Plate 3. Meridional CTD temperature sections along 110°W during 1986-1988.
Contour interval is 1°C. Warmest temperatures are in magenta (>25°C); coldest
temperatures are in blue ( 10°C). Intermediate
temperatures are in orange (21°-25°C), green (16°-20°C), and aquamarine (11°-15°C).
10°C). Intermediate
temperatures are in orange (21°-25°C), green (16°-20°C), and aquamarine (11°-15°C).
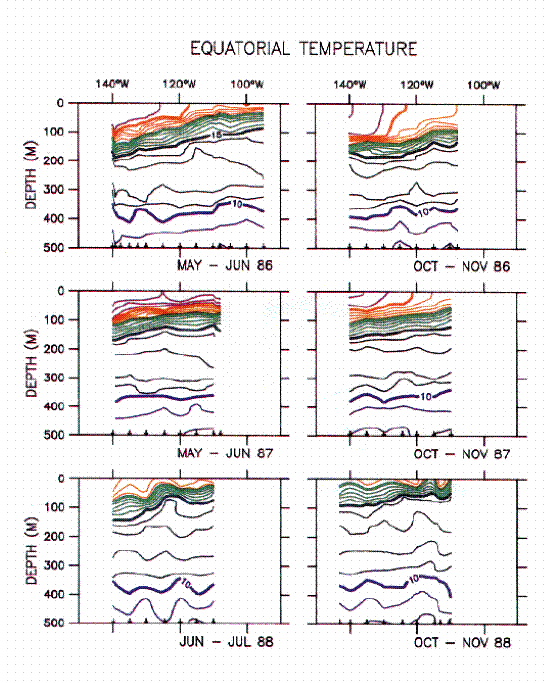
Plate 4. Equatorial CTD temperature sections during 1986-1988. Contours are as in Plate 3.
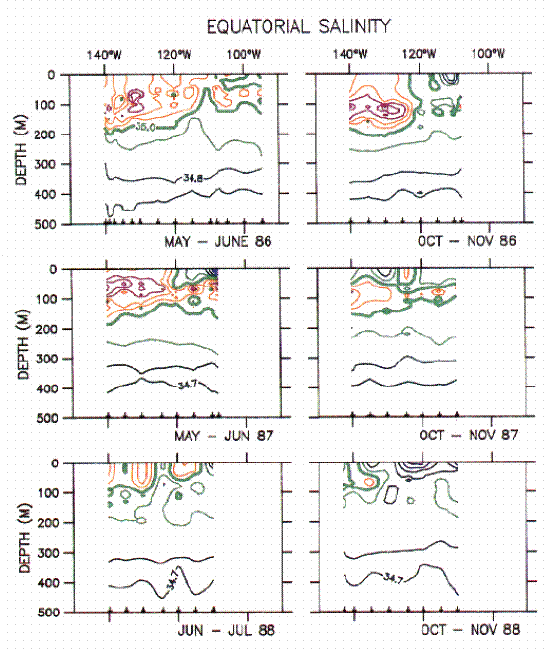
Plate 5. Equatorial CTD salinity sections during 1986-1988. Contour interval is 0.1
psu. Saltiest water is in magenta (35.3 psu); freshest
water is in blue (
34.6 psu). Intermediate salinities are
in orange (35.1-35.2 psu), green (34.9-35.0 psu), and aquamarine (34.7-34.8 psu).
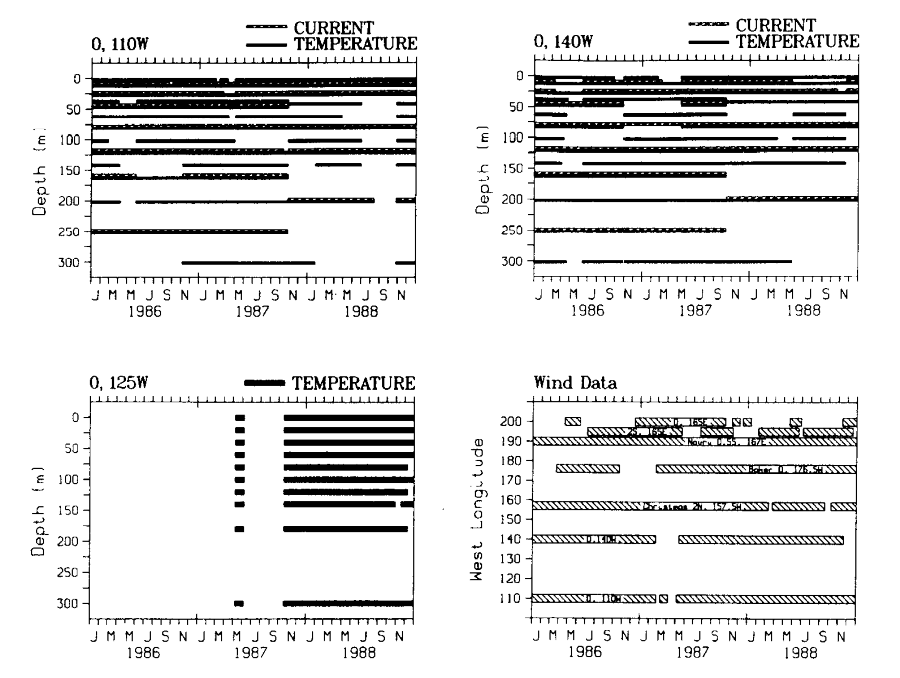
Figure 1. Record lengths of daily time series from moorings and island wind stations.
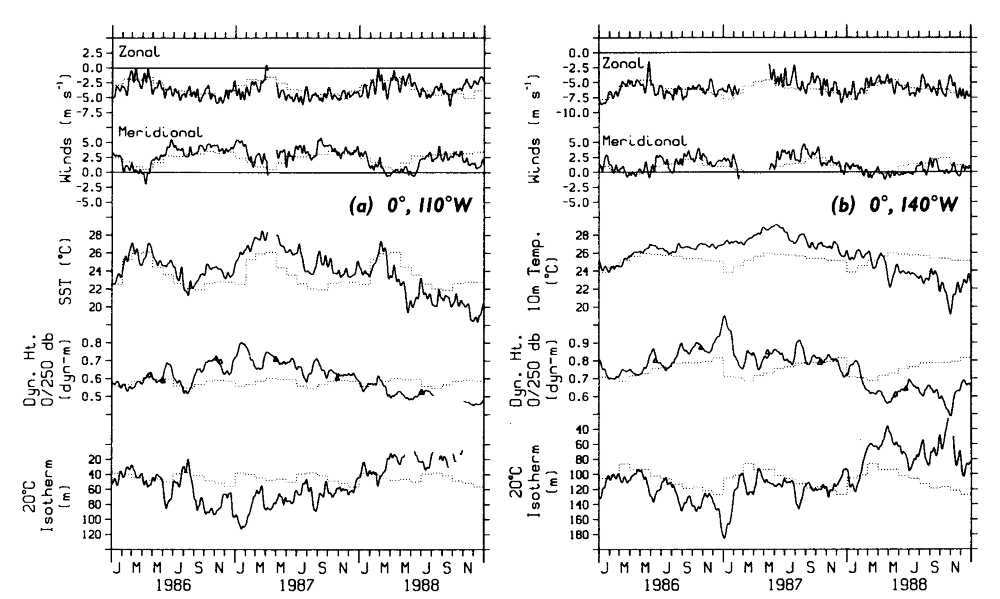
Figure 2. Zonal wind, meridional wind, sea surface temperature, dynamic height 0/250 dbar, and 20°C isotherm depth at (a)0°, 110°W and (b) 0°, 140°W. Temperature at 10 m has seen substituted for the more gappy sea surface temperature record at 140°W, since the two time series typically agree with one another to within about 0.1°C. Daily data have been smoothed with an 11-day Hanning filter. Superimposed on the time series are estimates of the monthly mean seasonal cycle based on mooring data. Dynamic heights of 0/250 dbar from CTD casts are also indicated (triangles).
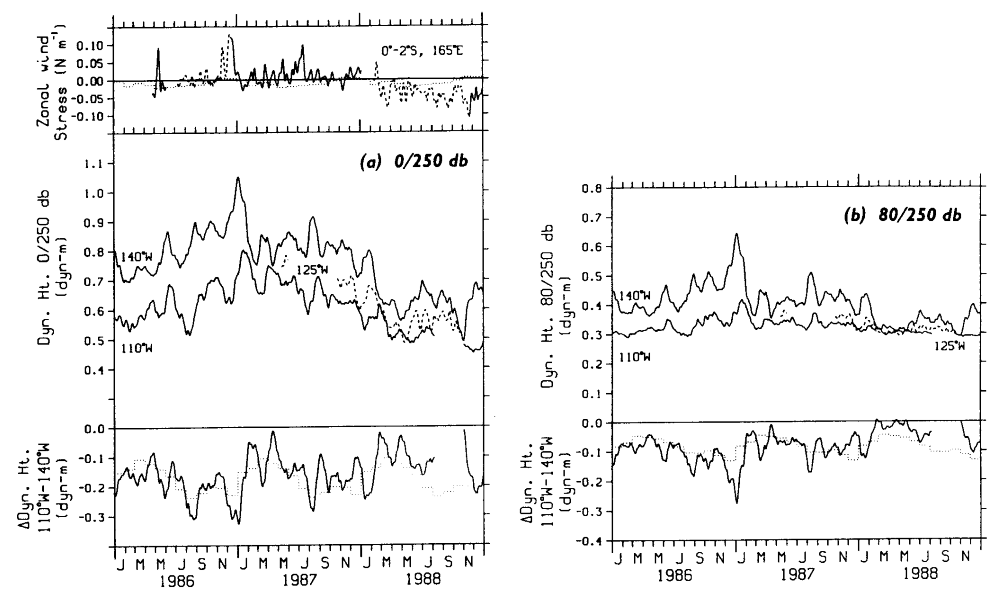
Figure 3. Time series of dynamic height (a) at the surface relative to 250 dbar and (b) at 80 dbar relative to 250 dbar. The 0°, 125°W time series is indicated by a dashed line for clarity. Also shown are the dynamic height differences over 110°-140°W superimposed on the mean seasonal cycle of dynamic height difference. Wind stress at 0°, 165°E (solid line) and 2°, 165°E (dashed line) appear in Figure 3a superimposed on the Wyrtki and Meyers [1975] stress climatology. Daily data have been smoothed with an 11-day Hanning filter.
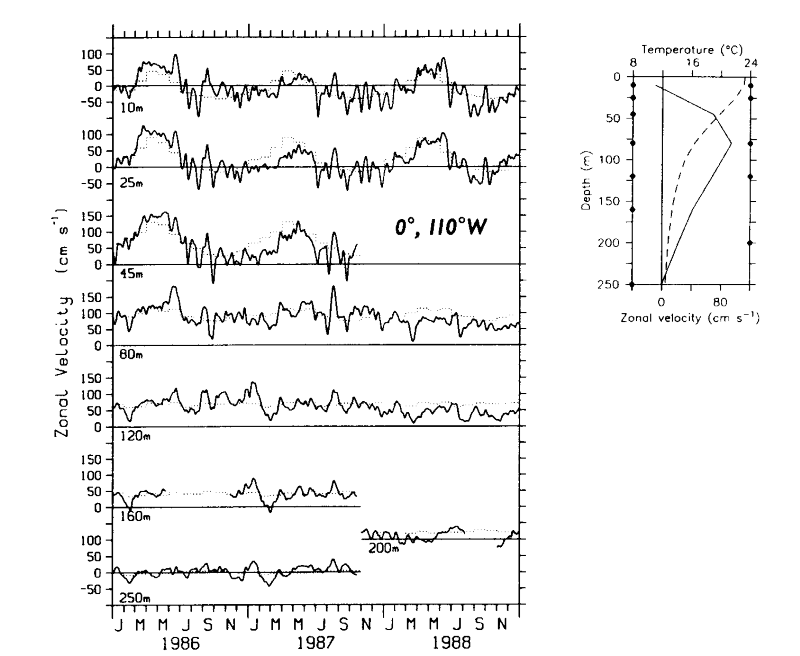
Figure 4. Time series of zonal velocity in the upper 250 m superimposed on estimates of the monthly mean seasonal cycle. Daily data have been smoothed with an 11-day Hanning filter. Shown at night are the depths of the velocity measurements relative to the 5-year mean profile of zonal velocity (solid line) and temperature (dashed line). Depths on the ordinates are for January 1986 to October 1987 (left) and October 1987 to October 1988 (right).
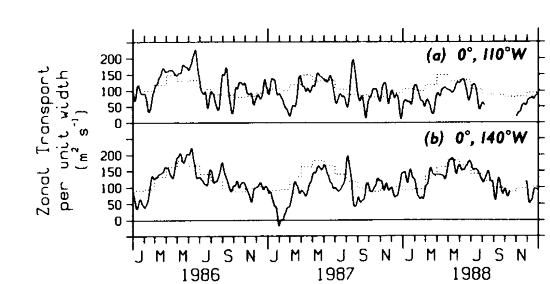
Figure 5. Zonal transport per unit width (10-200 m) at (a) 0°, 110°W and (b) 0°, 140°W superimposed on estimates of the monthlv mean seasonal cycle. Daily data have been smoothed with an 11-day Hanning filter.
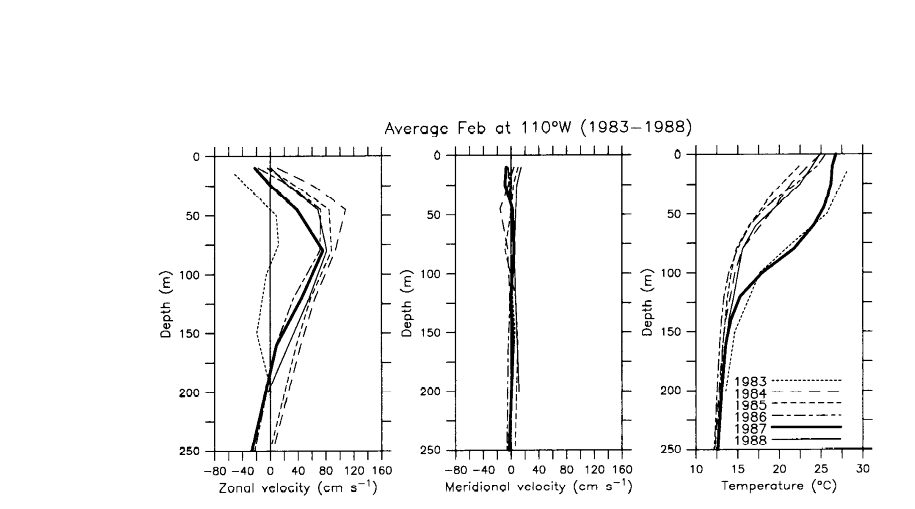
Figure 6. Profiles of monthly mean zonal velocity, meridional velocity, and temperature in the upper 250 m for each February from 1983 to 1988 at 0°, 110°W.
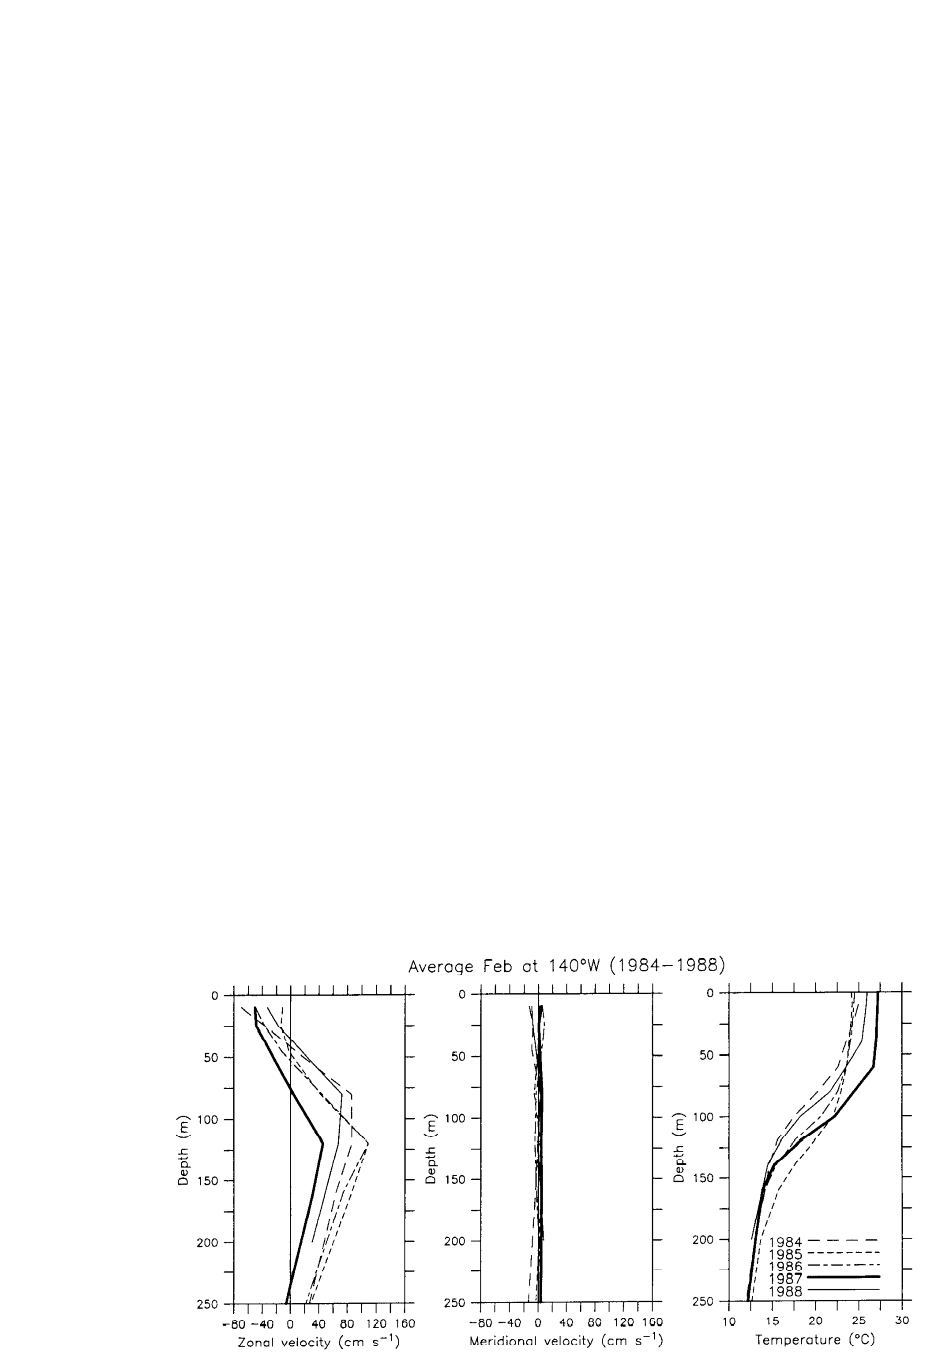
Figure 7. Profiles of monthly mean zonal velocity, meridional velocity, and temperature in the upper 250 m for each February from 1984 to 1988 at 0°, 140°W.
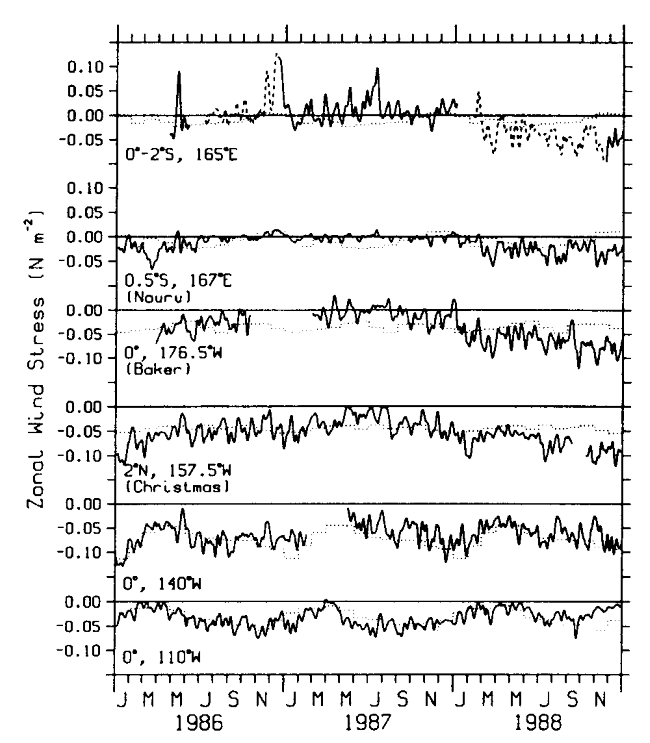
Figure 8. Time series of zonal wind stress at various locations in the equatorial Pacific. Data at 165°E are from 0° (solid line) and 2°S (dashed line). Superimposed are estimates of the monthly mean seasonal cycle from Wyrtki atid Meyers [1975] for Nauru, the moorings at 165°E, Baker, and Christmas. Mooring mean seasonal cycles are overplotted on the 140°W and 110°W time series. Daily data have been smoothed with an 11-day Hanning filter.
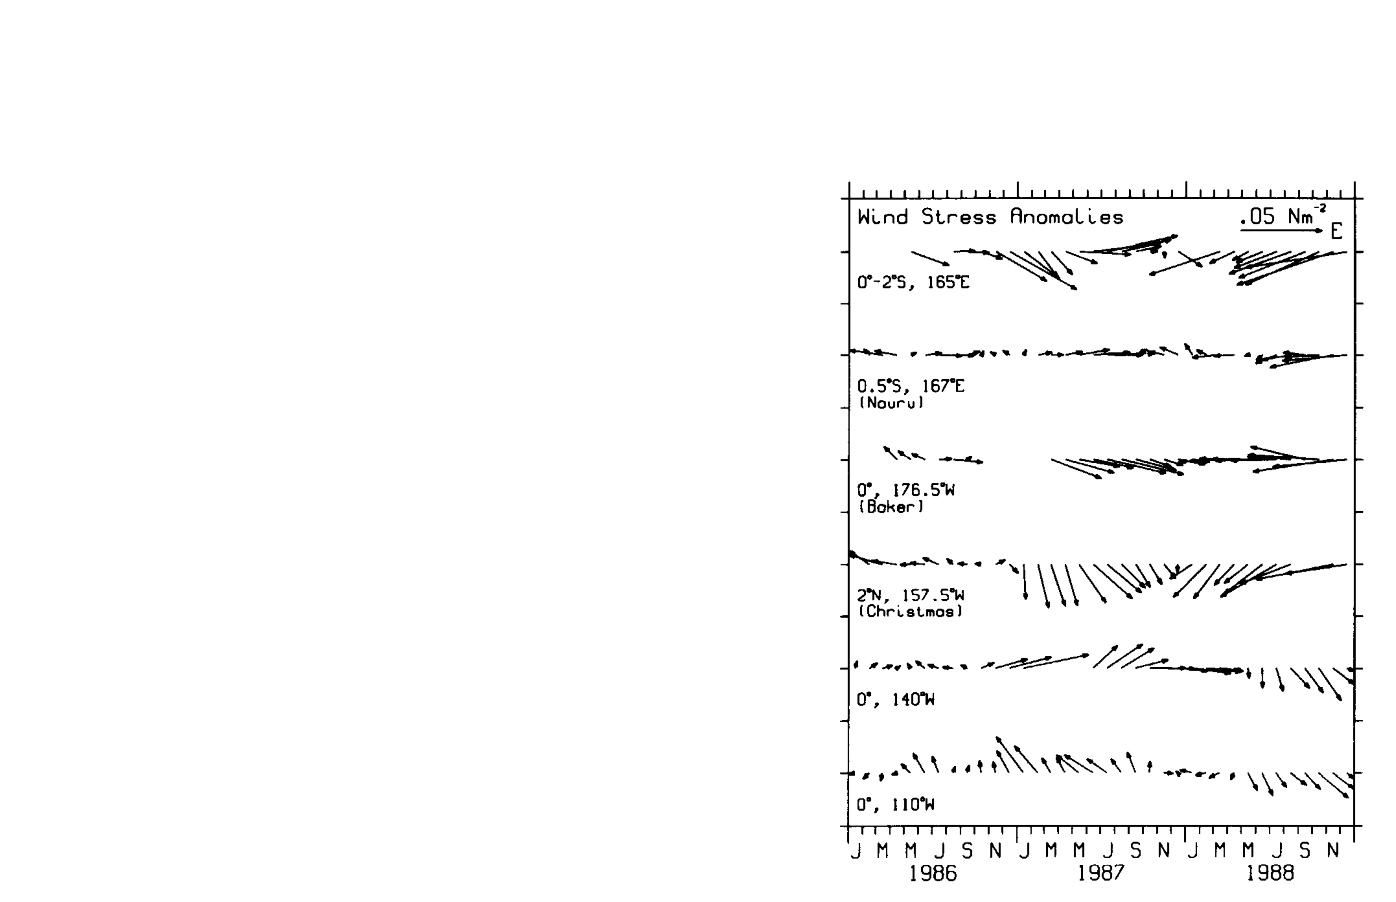
Figure 9. Monthly mean vector wind stress anomalies corresponding to the time series in Figure 8.
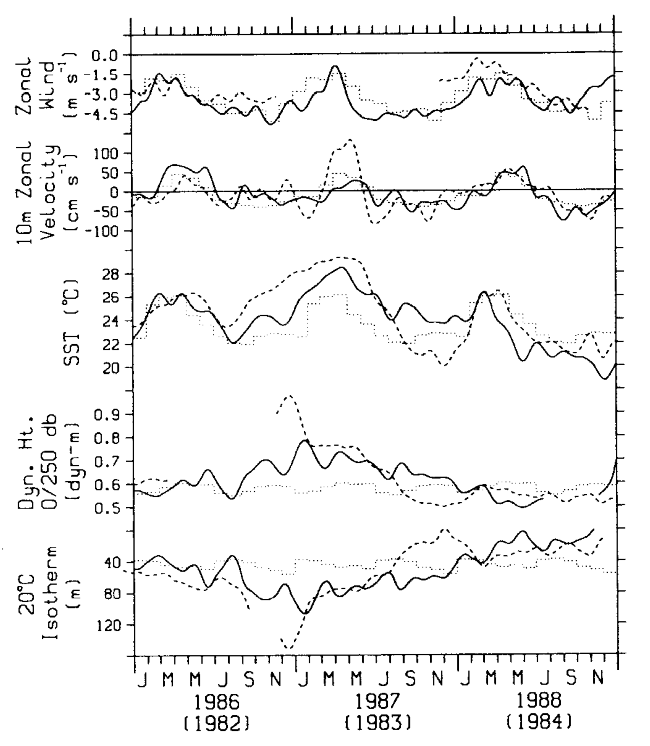
Figure 10. Time series of zonal winds, 10-m zonal velocity, SST, dynamic height 0/250 dbar, and 20°C isotherm depth for 1986-1988 (solid curves) and 1982-1984 (dashed curves). Daily data have been smoothed with a 51-day Hanning filter to remove variability at periods shorter than about 1 month. SST, 20°C isotherm depths, and 10-m zonal velocities are identical to those plotted in Plate 2. Monthly mean mooring climatologies are indicated by dotted lines.
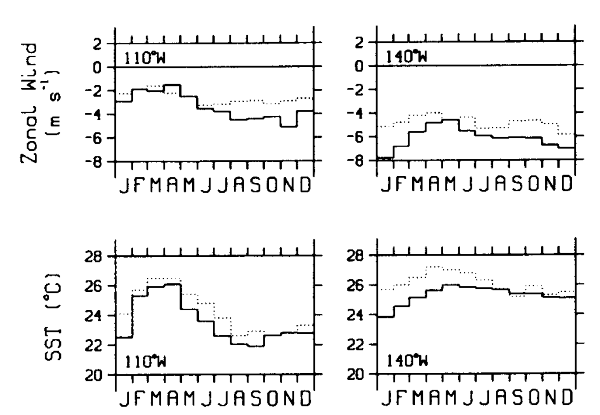
Figure B1. Monthly mean climatologies of sea surface temperature and zonal winds at 0°, 110°W and 0°, 140°W (solid lines). Superimposed are monthly means from the Reynolds [1988] sea surface temperature climatology and Wyrtki and Meyers [1975] wind climatology (dotted lines).
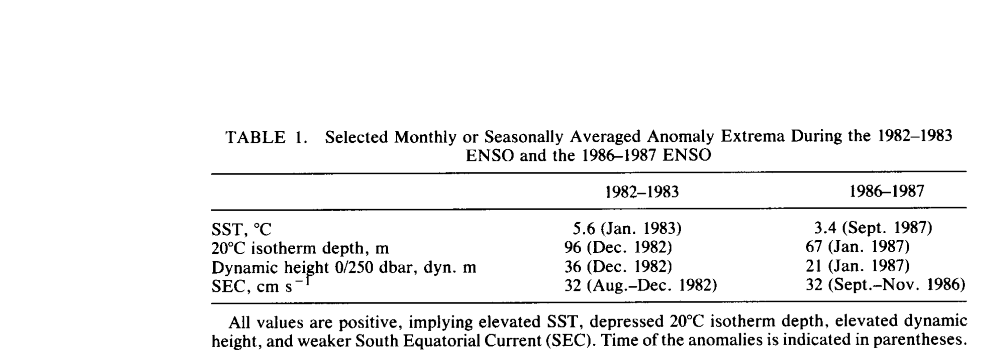
Table 1. Select monthly of seasonally averaged anomaly extrema during the 1982-1983 ENSO and the 1986-1987 ENSO.
Go back to References
Go back to Abstract