U.S. Dept. of Commerce / NOAA / OAR / PMEL
/ Publications
The Pacific Subsurface Countercurrents and an Inertial Model
Gregory C. Johnson and Dennis W. Moore
National Oceanic and Atmospheric Administration/Pacific Marine Environmental
Laboratory, Seattle, Washington
Journal of Physical Oceanography, 27, 2448-2459
Not subject to U.S. copyright. Published in 1997 by the American Meterological Society.
3. Mean meridional sections of properties and transports
Mean meridional potential temperature,  , sections
show that the thermocline (roughly from 15° to 25°C, centered near the 20°C
isotherm) shoals and strengthens from west to east (Fig.
1). This feature is deep (120-200 m) and relatively weak at 165°E,
intermediate in depth (80-200 m) and strength at 155°W, and shallow (50-120 m)
and strong at 110°W. The poleward deepening of the thermocline south of the
equator, and north of the equator to 4°-5°N, is associated with the southern
and northern components of the westward-flowing South Equatorial Current (SEC),
respectively. The poleward shoaling of the thermocline north of 4°-5°N is associated
with the eastward-flowing NECC. The spreading of the thermocline around the
equator marks the eastward flowing EUC. This spreading is discernable at 165°E
and stronger at 155°W. At 110°W the EUC is shallow and south of the equator,
where isotherms dip near 1°S. This southern displacement from the equator has
been shown to be the result of meridional wind forcing (Philander
and Delecluse 1983). Most relevant to this study is a poleward shoaling
of isotherms below the thermocline centered near ±2.5° latitude at 165°E, ±3.5°
at 155°W, and ±4.5°-5.5° at 110°W. This shoaling shifts poleward and upward
to the east under the thermocline, marking the Tsuchiya jets. By 110°W, the
thermostad near 13°C between the SSCCs is very pronounced.
, sections
show that the thermocline (roughly from 15° to 25°C, centered near the 20°C
isotherm) shoals and strengthens from west to east (Fig.
1). This feature is deep (120-200 m) and relatively weak at 165°E,
intermediate in depth (80-200 m) and strength at 155°W, and shallow (50-120 m)
and strong at 110°W. The poleward deepening of the thermocline south of the
equator, and north of the equator to 4°-5°N, is associated with the southern
and northern components of the westward-flowing South Equatorial Current (SEC),
respectively. The poleward shoaling of the thermocline north of 4°-5°N is associated
with the eastward-flowing NECC. The spreading of the thermocline around the
equator marks the eastward flowing EUC. This spreading is discernable at 165°E
and stronger at 155°W. At 110°W the EUC is shallow and south of the equator,
where isotherms dip near 1°S. This southern displacement from the equator has
been shown to be the result of meridional wind forcing (Philander
and Delecluse 1983). Most relevant to this study is a poleward shoaling
of isotherms below the thermocline centered near ±2.5° latitude at 165°E, ±3.5°
at 155°W, and ±4.5°-5.5° at 110°W. This shoaling shifts poleward and upward
to the east under the thermocline, marking the Tsuchiya jets. By 110°W, the
thermostad near 13°C between the SSCCs is very pronounced.
Fig. 1. Mean meridional
and S sections in the top 500 m of the ocean from 10°S to 10°N
along 165°E, 155°W, and 110°W. Contour intervals are 1°C (thick lines 5°C) for
and 0.1 PSS-78 (thick lines 0.5 PSS-78) for S. Vertical exaggeration
is 4000:1.
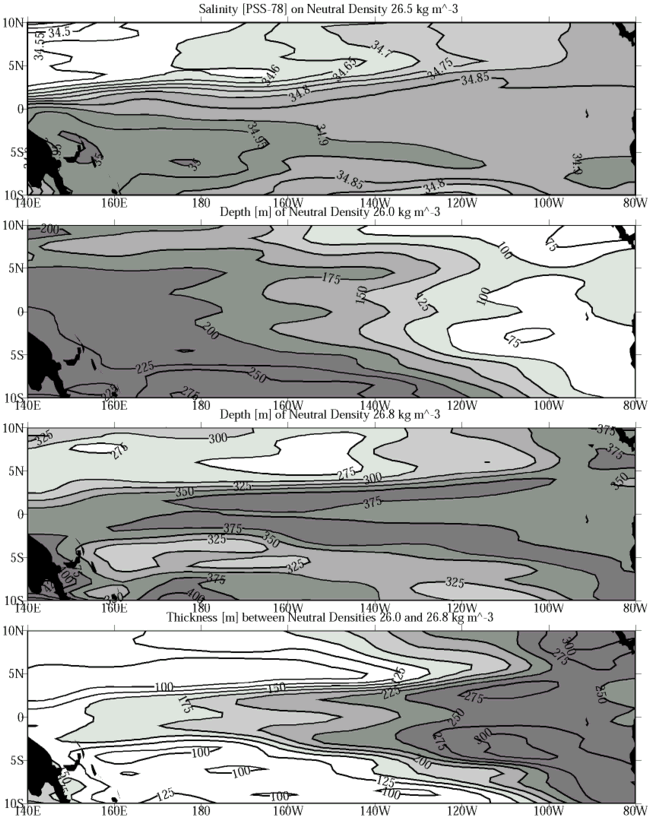
Mean meridional S sections show a subsurface convergence of tongues
toward the EUC (Fig. 1). The southern subsurface
S maximum, water subducted in the southern subtropics where evaporation
dominates over precipitation, is prominent in all three sections and strongest
at 155°W. North of the equator, surface S decreases to the east under
the intertropical convergence zone, a region of high precipitation (Ando
and McPhaden 1997). Salinity distributions on isopycnal surfaces around
 n = 25.5 kg m-3,
the core density of the EUC, suggests that the subsurface S minimum
is almost certainly a remnant of the North Pacific Intermediate Water (Talley
1993). This fresh tongue appears to be converging along isopycnals toward
the EUC, especially at 155°W, but almost certainly takes an indirect route involving
the nearly zonal interior currents and nearly meridional western boundary currents.
At 110°W the core of the EUC is marked by an isolated S maximum advected
from the west (Hayes
et al. 1983; Lukas
1986), here found at 1°S, 65 m. Most relevant to this study, isohalines
are nearly vertical in the region of the north SSCC. The resulting strong deep
S gradient near 2°-3°N at 165°E, 2°-4°N at 155°W, and 4°-5°N at 110°W
suggests a front there and reinforces the assertion that the Tsuchiya jets are
a barrier to meridional flow (Gouriou
and Toole 1993). In addition, there is a well-defined S minimum
just north of the front, just hinted at in the sections by a pinching of isohalines
at 4°N, 5°N, and 6°N going from 165°E to 155°W to 110°W, but very apparent in
an isopycnal map discussed in the next section (Fig.
3, top panel). Since S increases from west to east, this feature
is probably fresher water being advected eastward on the northern edge of the
north SSCC.
n = 25.5 kg m-3,
the core density of the EUC, suggests that the subsurface S minimum
is almost certainly a remnant of the North Pacific Intermediate Water (Talley
1993). This fresh tongue appears to be converging along isopycnals toward
the EUC, especially at 155°W, but almost certainly takes an indirect route involving
the nearly zonal interior currents and nearly meridional western boundary currents.
At 110°W the core of the EUC is marked by an isolated S maximum advected
from the west (Hayes
et al. 1983; Lukas
1986), here found at 1°S, 65 m. Most relevant to this study, isohalines
are nearly vertical in the region of the north SSCC. The resulting strong deep
S gradient near 2°-3°N at 165°E, 2°-4°N at 155°W, and 4°-5°N at 110°W
suggests a front there and reinforces the assertion that the Tsuchiya jets are
a barrier to meridional flow (Gouriou
and Toole 1993). In addition, there is a well-defined S minimum
just north of the front, just hinted at in the sections by a pinching of isohalines
at 4°N, 5°N, and 6°N going from 165°E to 155°W to 110°W, but very apparent in
an isopycnal map discussed in the next section (Fig.
3, top panel). Since S increases from west to east, this feature
is probably fresher water being advected eastward on the northern edge of the
north SSCC.
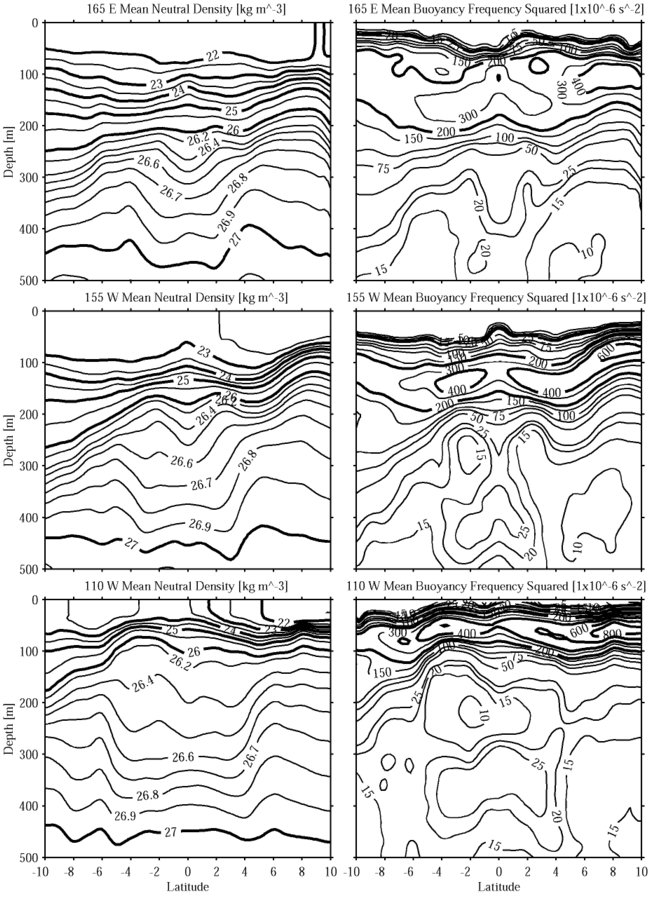
Mean meridional n sections
(Fig. 2) are similar in appearance to those of
(Fig. 1) and
are shown primarily for reference to the isopycnal maps and the model. The previous
discussion of the thermocline and thermostad applies equally to the pycnocline
and pycnostad, with S modifying the structure slightly. However, the
mean meridional N2 sections (Fig.
2) are worthy of more discussion. The surface mixed layer is characterized
by very low N2 and shoals from 165°E to 110°W. The pycnocline,
a vertical maximum in N2, is relatively thick, deep, and
weak at 165°E. By 110°W it has thinned, nearly doubled in strength, and shoaled.
Below the pycnocline, N2 generally weakens with increasing
depth, but a very distinct equatorial pycnostad associated with the SSCCs develops,
here described as it strengthens from west to east. At 165°E, the 20 and 25 × 10-6 s-2
contours rise up at ±2° from the equator, marking a weak pycnostad centered
near n = 26.74
kg m-3 at these latitudes. By 155°W a well-developed
stability minimum is evident on both sides of the equator, with values near
12 × 10-6 s-2 at n = 26.62
kg m-3, again most extreme ±2° from the equator, but broader
in the horizontal. By 110°W the minimum is less than 10 × 10-6
s-2 near n = 26.47
kg m-3. The latitudinal distribution shows a slight increase
in stability on the equator, but the pycnostad extends from 5°S to 4°N. Thus,
as the pycnostad builds in strength and expands in area to the east, it also
shoals and its core n values
decreases by 0.27 kg m-3.
Fig. 2. As in Fig. 1 but for n
and N2. Contour intervals vary for both quantities, but
thick lines are at 1.0 kg m-3 intervals for n
and 200 × 10-6 s-2 intervals for N2.
Geostrophic volume transport and velocity calculations are made using a reference
surface of 700 dbar, near n = 27.3
kg m-3. This surface is deep enough to capture the Tsuchiya
jets and is the mean of those used in three previous quantitative works in the
region: 600 dbar at 165°E (Gouriou
and Toole 1993), 1000 dbar at 155°W (Wyrtki
and Kilonsky 1984), and 500 dbar at 110°W (Tsuchiya
1975). Table 1 lists the volume transport estimates of eastward flow between
n = 25.5 and
27.3 kg m-3. The lower limit is near the reference surface and
the upper limit is imposed to isolate the north SSCC from the eastward-flowing
NECC. Only eastward flow between the bounding latitudes contributes to the transports
in Table 1; these horizontal limits are based on a subjective examination of
the mean meridional n and
N2 sections so as to capture the eastward flow just poleward
of the equatorial pycnostad. These horizontal limits are also well defined in
that there is westward flow to either side. The SSCCs volume transports are
relatively constant, except at 165°E where the north SSCC value may be high
because some NECC flow is included in the estimate. The transport-weighted n
of the SSCCs (Table 1) are near the pycnostad core values discussed above, since
the SSCCs reside in the pycnostad, but show only a 0.09 kg m-3
decrease in n to the east,
a third of the decrease in those core values. The peak velocities shift poleward
and shoal in both hemispheres (Table 1). Peak velocities remain strong across
the Pacific except at 155°W, where the south SSCC peak velocity is weak, mostly
owing to a shift in longitude of the mean station positions (Fig. 3,
solid dots). At any rate, peak velocities from the mean sections are most likely
lower than those in synoptic sections because of the relatively large latitudinal
bin widths and temporal variability of the SSCCs core latitudes. The volume
transport estimates and peak velocity statistics are in rough accord with the
studies discussed in the introduction. However, the estimates presented here
are improved by uniform analysis of an expanded data set.
If your browser cannot view the following table correctly,
click this link for a GIF image of Table
1
Table 1. Geostrophic volume transport
and velocity calculations made for the Pacific SSCCs using the mean meridional
sections at each longitude, referenced to 700-dbar pressure. Only eastward flow
between n = 25.5
and 27.3 kg m-3 within the latitude bounds given is used in
the transport calculations. Volume transport and transport-weighted n
remain roughly constant from west to east. Peak velocity latitudes, depths,
and magnitudes show the Tsuchiya jet cores shifting poleward, shoaling, and
maintaining speed from west to east.
|
|
Transport
calculations |
Peak velocities |
|
|
|
Section
(long) |
Latitude
bounds |
Volume
Transport
(106 m3 s-1) |
Transport
weighted n
(kg m-3) |
Peak
latitude |
Peak depth
(m) |
Peak magnitude
(m s-1) |
|
| South SSCC |
| 165°E |
5°-2°S |
6.6 |
26.62 |
2.5°S |
250 |
0.17 |
| 155°W |
8°-3°S |
4.1 |
26.67 |
3.5°S |
250 |
0.07 |
| 110°W |
6°-3°S |
6.2 |
26.57 |
5.5°S |
160 |
0.16 |
| North SSCC |
| 165°E |
2°-5°N |
10.3 |
26.58 |
2.5°N |
240 |
0.26 |
| 155°W |
2°-5°N |
7.0 |
26.63 |
3.5°N |
220 |
0.21 |
| 110°W |
3°-6°N |
7.4 |
26.45 |
4.5°N |
130 |
0.21 |
|
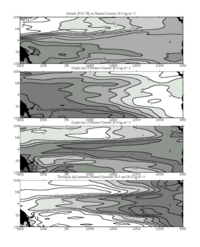
Fig. 3. Salinity on n = 26.5
kg m-3, with contour intervals of 0.05 PSS-78 and saltier
values increasingly shaded (top panel). Depth of n = 26.0
kg m-3, with contour intervals of 25 m and deeper values
increasingly shaded (second panel from top). Depth of n = 26.8
kg m-3, with contour intervals of 25 m and deeper values
increasingly shaded (third panel from top). Thickness between n = 26.0
and 26.8 kg m-3, with contour intervals of 25 m and thicker
values increasingly shaded (bottom panel). All panels are objectively mapped
from the values at each mean hydrographic profile location as described in the
text. The mapping uses the Peters projection.
Return to previous section or go to next
section
PMEL Outstanding Papers
PMEL Publications Search
PMEL Homepage