U.S. Dept. of Commerce / NOAA/ OAR / PMEL / Publications
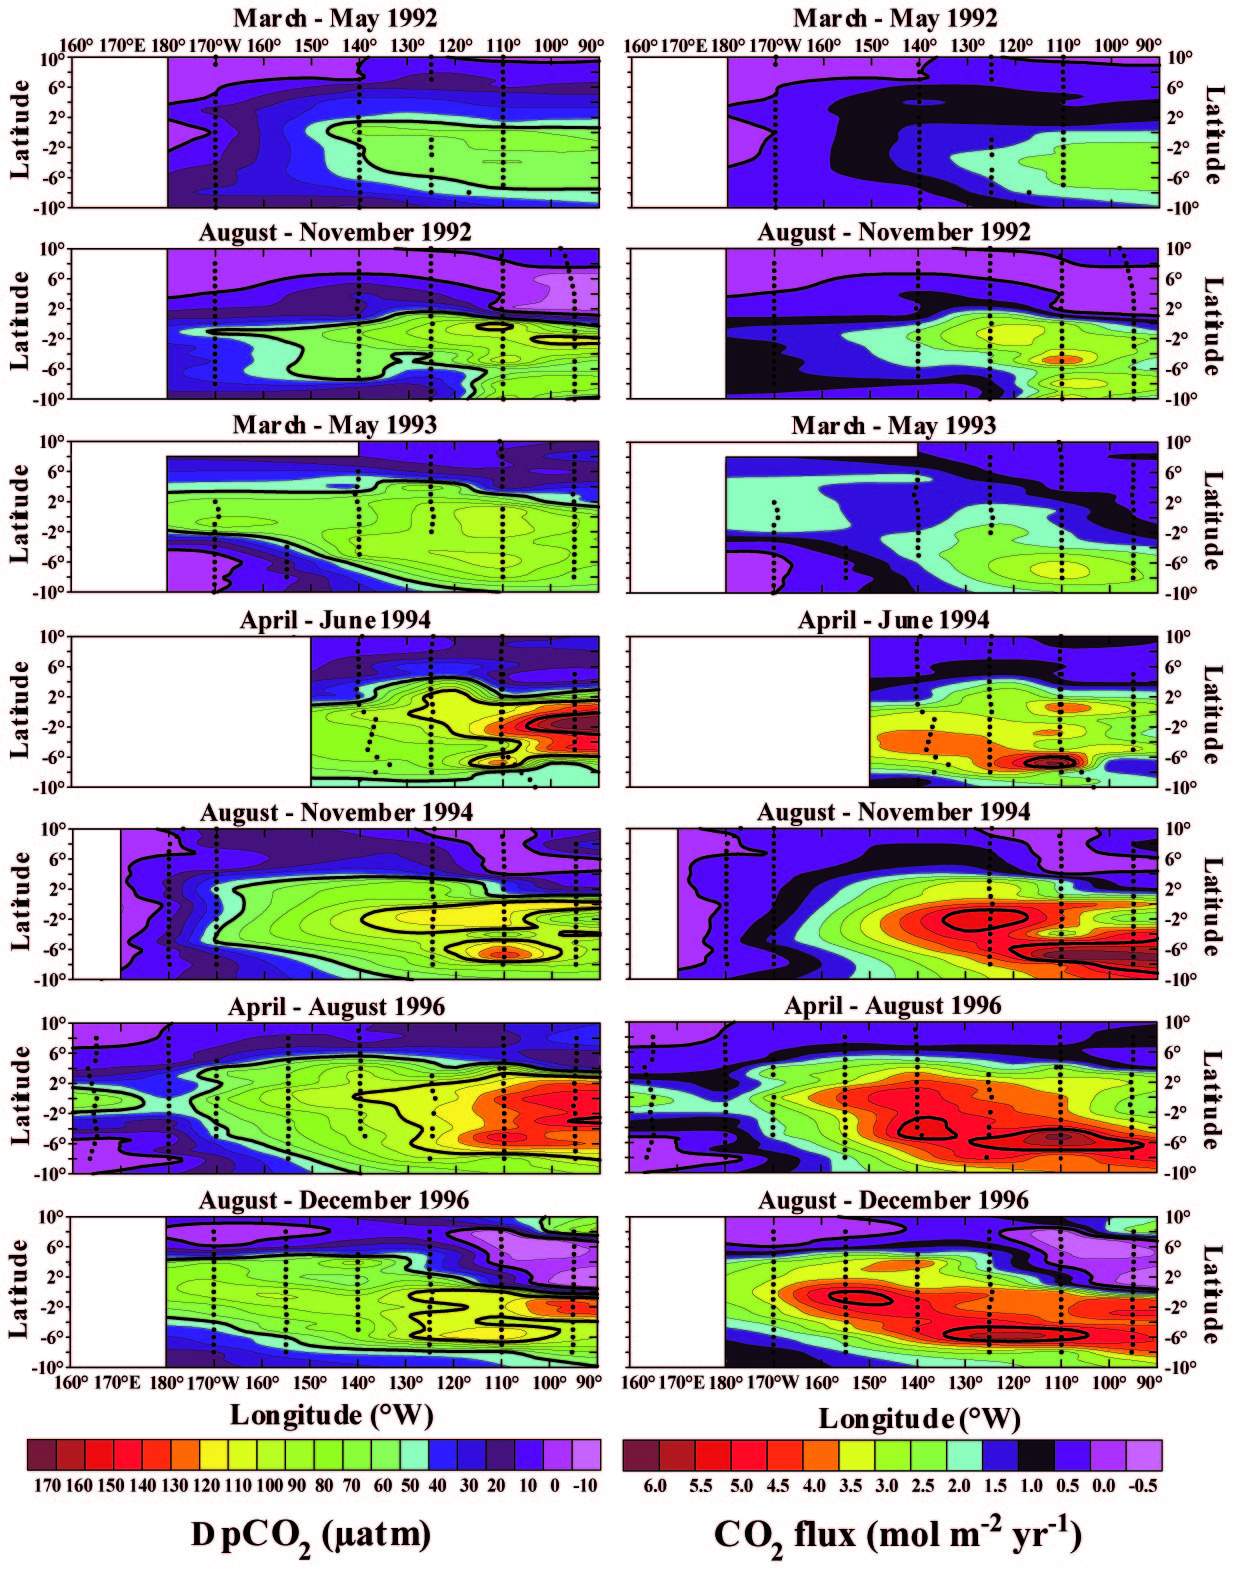
Figure 1. CO2 disequilibria and sea-to-air fluxes
in the equatorial Pacific. The distributions of  pCO2
(see text) in
pCO2
(see text) in  atm (left) and CO2
flux in mol m-2 yr-1 (right)
in the central and eastern equatorial Pacific are for two field seasons in the
boreal spring and autumn of 1992; the spring of 1993; the spring and autumn
of 1994; and spring/summer and autumn/winter of 1996. The lower pCO2
values during 1992–94 ENSO event, combined with lower wind speeds, resulted
in a significant decrease in the CO2 flux compared
with the 1996 non-El Niño year. 'Under' atmospheric and surface ocean
pCO2 measurements and supporting hydrographic
data were obtained during these cruises on board the NOAA Ships Discoverer,
Malcolm Baldrige and Ka'imimoana. The 'underway' measurements
of CO2 mixing ratios in dry air were made with a
Li-Cor (Model 6251) non-dispersive infrared analyser linked to the shipboard
equilibrator following the methods described in ref. 29. The system runs on
an hourly cycle during which standards, a headspace sample from the equilibrator,
and an ambient air sample are analysed. Standards were obtained from NOAA's
Climate Monitoring Diagnostics Laboratory (CMDL) at Boulder. All reference standards
undergo a pre- and post-cruise calibration at CMDL against standards certified
by the World Meteorological Organization (WMO).
atm (left) and CO2
flux in mol m-2 yr-1 (right)
in the central and eastern equatorial Pacific are for two field seasons in the
boreal spring and autumn of 1992; the spring of 1993; the spring and autumn
of 1994; and spring/summer and autumn/winter of 1996. The lower pCO2
values during 1992–94 ENSO event, combined with lower wind speeds, resulted
in a significant decrease in the CO2 flux compared
with the 1996 non-El Niño year. 'Under' atmospheric and surface ocean
pCO2 measurements and supporting hydrographic
data were obtained during these cruises on board the NOAA Ships Discoverer,
Malcolm Baldrige and Ka'imimoana. The 'underway' measurements
of CO2 mixing ratios in dry air were made with a
Li-Cor (Model 6251) non-dispersive infrared analyser linked to the shipboard
equilibrator following the methods described in ref. 29. The system runs on
an hourly cycle during which standards, a headspace sample from the equilibrator,
and an ambient air sample are analysed. Standards were obtained from NOAA's
Climate Monitoring Diagnostics Laboratory (CMDL) at Boulder. All reference standards
undergo a pre- and post-cruise calibration at CMDL against standards certified
by the World Meteorological Organization (WMO).
Figure 2. Time series of pCO2 .
The data are from cruises during the boreal spring between 1992–1994 and
1996 (SST, sea surface temperature). The month of observations is listed in
the key. a, Time series along 110°W. b, The pCO2
versus the temperature at the temperature minimum along 110°W.
.
The data are from cruises during the boreal spring between 1992–1994 and
1996 (SST, sea surface temperature). The month of observations is listed in
the key. a, Time series along 110°W. b, The pCO2
versus the temperature at the temperature minimum along 110°W.
Figure 3. Long time series of seawater and atmospheric pCO2. The region of coverage is the central equatorial Pacific between 140°W and 160°W. The seawater values have been corrected to a constant temperature of 25°C to remove the effect of temperature on CO2 solubility. Data Sources: 1961, Keeling et al. (1965); 1984, Feely et al. (1987); 1988, Murphy et al. (1994); 1989, Murphy et al. (1994); 1989, Inoue and Sugimura (1992); 1996, Feely et al. (this work).
Table 1. Estimates of the equatorial Pacific sea-air CO2 flux.
|
|
||||
|
Annual equatorial Pacific
|
Annual equatorial Pacific
|
Annual atmospheric
|
Per cent of atmospheric
|
|
|
flux
|
flux anomaly*
|
flux anomaly**
|
anomaly due to the
|
|
| Year |
(Pg C)
|
(Pg C)
|
(Pg C)
|
equatorial Pacific ENSO
|
|
|
||||
| 1992 |
0.3 ± 0.2
|
–0.6 ± 0.4
|
–1.69
|
36
|
| 1993 |
0.6 ± 0.4
|
–0.3 ± 0.3
|
–1.84
|
16
|
| 1994 |
0.7 ± 0.5
|
–0.2 ± 0.3
|
0.09
|
NA
|
| 1996 |
0.9 ± 0.6
|
0.0
|
–0.03
|
NA
|
|
|
||||
NA, Not applied.
*Equatorial Pacific flux — 1996 equatorial Pacific flux. From an analysis of seasonal and interannual datasets. The uncertainties are composed of the seasonal variations of pCO2w (28%), wind speed variability (28%), and the wind-speed dependence of gas exchange (44%). The region of coverage for the equatorial Pacific flux estimates is from 10°S to 10°N and from 80°W to 135°E.
** Difference between measured atmospheric annual CO2 increase and a long-term average annual increase of 3.18 PgC (ref. 19).