U.S. Dept. of Commerce / NOAA/ OAR / PMEL / Publications
The influence of El Niño on the equatorial Pacific contribution to
atmospheric CO2 accumulation
Richard A. Feely
Pacific Marine Environmental Laboratory, National Oceanic and Atmospheric
Administration, Seattle, Washington
Rik Wanninkhof
Atlantic Oceanographic and Meteorological Laboratory, National Oceanic and
Atmospheric Administration, Miami, Florida
Taro Takahashi
Lamont-Doherty Earth Observatory, Columbia University, Palisades, New York
Pieter Tans
Climate Monitoring and Diagnostics Laboratory, Boulder, Colorado
Nature, 398, 597–601 (1999)
Copyright ©1999 Macmillan Publishers Ltd. Further electronic distribution is
not allowed.
The equatorial oceans are the dominant oceanic source of CO2 to
the atmosphere, annually amounting to a net flux of 0.7–1.5 Pg (1015
g) of carbon, up to 72% of which emanates from the equatorial Pacific Ocean (Houghton
et al., 1994; Tans
et al., 1990; Takahashi
et al., 1997). Limited observations indicate that the size of the equatorial
Pacific source is significantly influenced by El Niño events (Feely
et al., 1995; Wanninkhof
et al., 1996; Murray
et al., 1994; Feely
et al., 1987; Inoue
and Sugimura, 1992; Goyet
and Peltzer, 1994; Archer
et al., 1996), but the effect has not been well quantified. Here we
report spring and autumn multiannual measurements of the partial pressure of CO2
in the surface ocean and atmosphere in the equatorial Pacific region. During the
1991–94 El Niño period, the derived net annual sea-to-air flux of
CO2 was 0.3 Pg C from autumn 1991 to autumn 1992, 0.6 Pg C in 1993,
and 0.7 Pg C in 1994. These annual fluxes are 30–80% of that of 1996, a non-El-Niño
year. The total reduction of the regional sea-to-air CO2 flux during
the 1991–94 El Niño period is estimated to account for up to one-third
of the atmospheric anomaly (the difference between the annual and long-term-average
increases in global atmospheric CO2 content) observed over the same
period.
A comprehensive set of atmospheric and surface ocean pCO
2
partial-pressure (p
CO2
) measurements and supporting hydrographic data were obtained during
two field seasons in the boreal spring and autumn of 1992, the spring of 1993,
the spring and autumn of 1994, and the spring and autumn of 1996. The spring
cruises from 1992 to 1994 occurred during the well developed warm El Niño/Southern
Oscillation (ENSO) event, and the autumn cruises took place during "cold-tongue"
conditions11.
The eastern equatorial Pacific Ocean is characterized by high seawater p
CO2
and high nutrient concentrations driven by upwelling of the Equatorial
Undercurrent. This water mass mixes with a combination of the westward-flowing
South Equatorial Current and upwelled subtropical water, which is transported
poleward by Ekman divergence along the equator (McPhaden,
1993; Harrison,
1996; Toggweiler
and Carson, 1995). As a consequence of these processes, this region is an
important site for exchange of carbon between the ocean interior and the atmosphere.
Although previous field studies of seawater p
CO2
in this region have emphasized the high degree of interannual variability
caused by the decline of upwelling during ENSO events (Feely
et al., 1995; Wanninkhof
et al., 1996; Murray
et al., 1994; Feely
et al., 1987; Inoue
and Sugimura, 1992; Goyet
and Peltzer, 1994; Archer
et al., 1996), the observations were limited in their spatial and
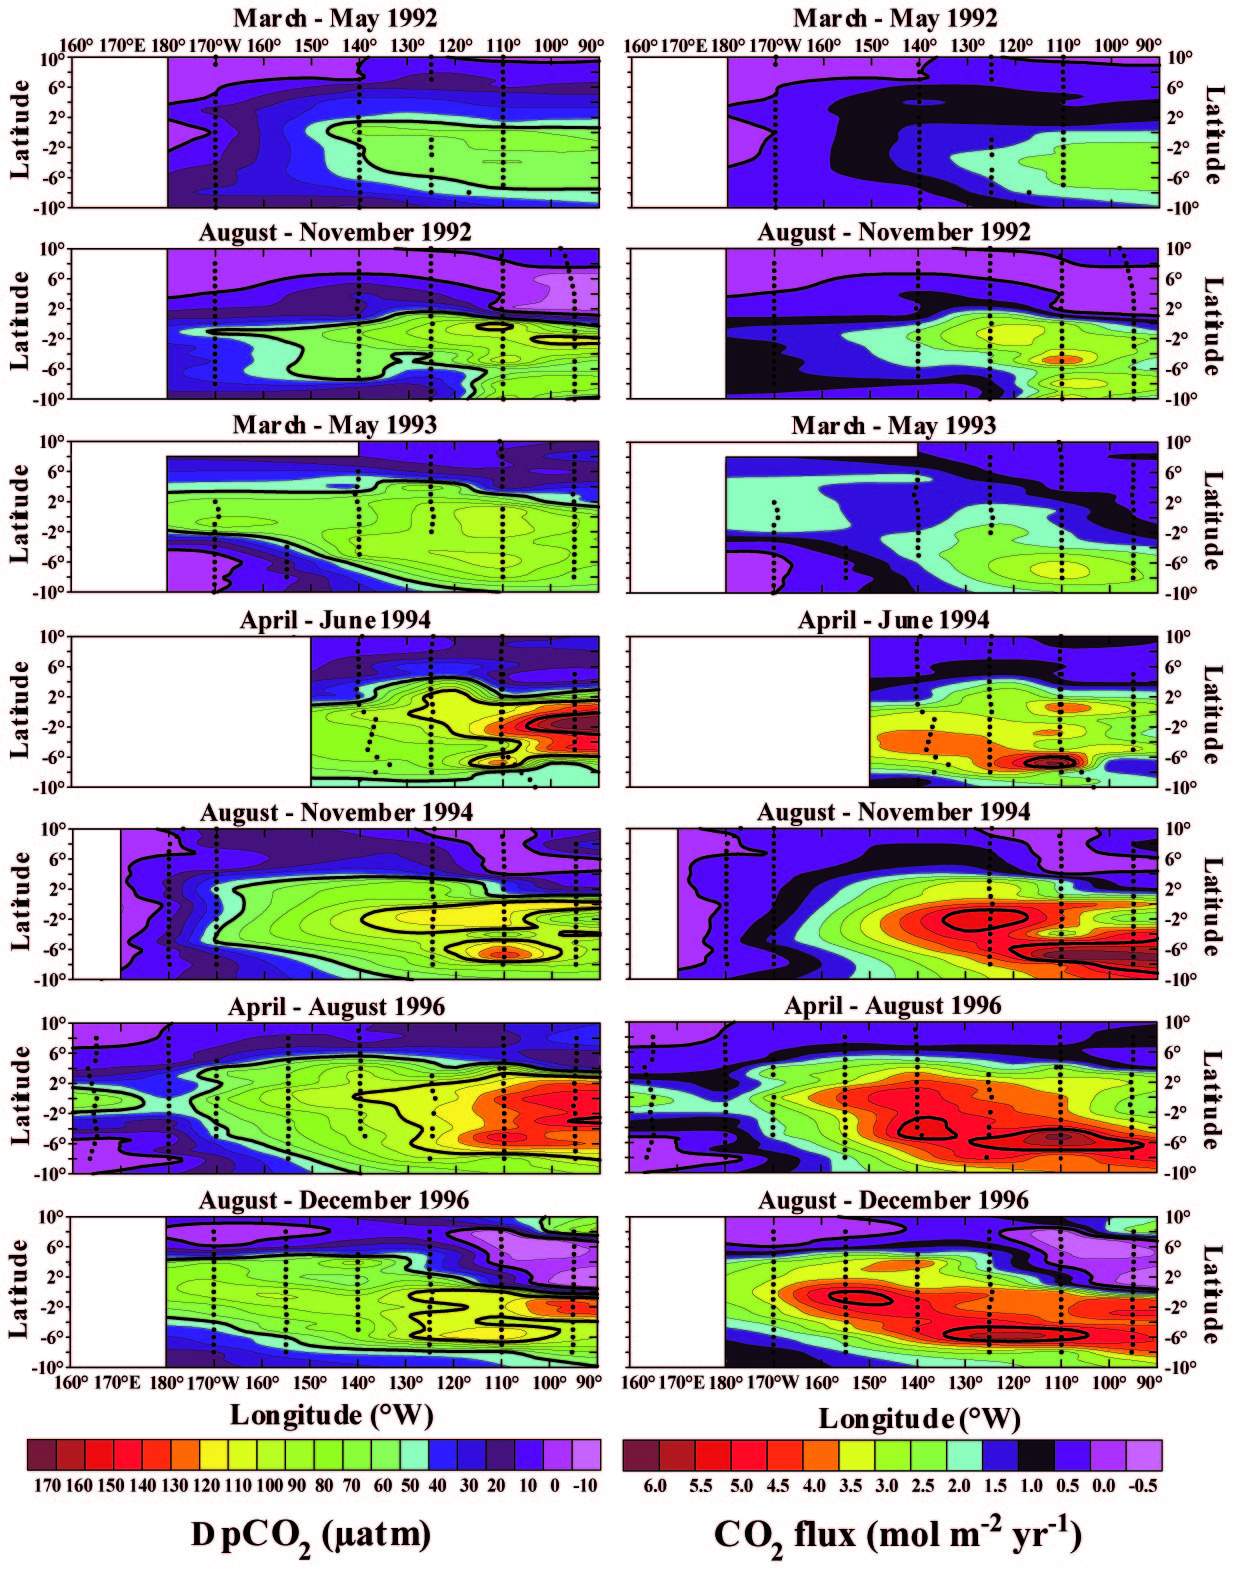
temporal coverage. Our 1996 data set clearly indicates higher  p
CO2
(seawater p
CO2
– air p
CO2
) values than 1992 and also that the region covered by positive p
CO2
extends farther in both the north-south and east-west directions (Fig.
1). Whereas values close to equilibrium are observed north and south of the
Equator in the western part of the study region, the region between 7°N
and 6°S has a large positive p
CO2
centered on the Equator at 165°E in 1996. In contrast, the data for
spring 1992 indicate near-equilibrium p
CO2
values in the region of 170°W. Both the seasonal and interannual distributions
of seawater p
CO2
(p
CO2w
) in the eastern Pacific show decreasing trends from east to west, while
the largest interannual variability is observed in the eastern Pacific along
95°W and 110°W.
p
CO2
(seawater p
CO2
– air p
CO2
) values than 1992 and also that the region covered by positive p
CO2
extends farther in both the north-south and east-west directions (Fig.
1). Whereas values close to equilibrium are observed north and south of the
Equator in the western part of the study region, the region between 7°N
and 6°S has a large positive p
CO2
centered on the Equator at 165°E in 1996. In contrast, the data for
spring 1992 indicate near-equilibrium p
CO2
values in the region of 170°W. Both the seasonal and interannual distributions
of seawater p
CO2
(p
CO2w
) in the eastern Pacific show decreasing trends from east to west, while
the largest interannual variability is observed in the eastern Pacific along
95°W and 110°W.
Figure 1. CO
2
disequilibria and sea-to-air fluxes in the equatorial Pacific. The distributions
of p
CO2
(see text) in  atm (left) and CO
2
flux in mol m
-2
yr
-1
(right) in the central and eastern equatorial Pacific are for two field seasons
in the boreal spring and autumn of 1992; the spring of 1993; the spring and
autumn of 1994; and spring/summer and autumn/winter of 1996. The lower p
CO2
values during 1992–94 ENSO event, combined with lower wind speeds,
resulted in a significant decrease in the CO
2
flux compared with the 1996 non-El Niño year. 'Under' atmospheric and
surface ocean p
CO2
measurements and supporting hydrographic data were obtained during these
cruises on board the NOAA Ships Discoverer, Malcolm Baldrige and
Ka'imimoana. The 'underway' measurements of CO
2
mixing ratios in dry air were made with a Li-Cor (Model 6251) non-dispersive
infrared analyser linked to the shipboard equilibrator following the methods
described in ref. 29. The system runs on an hourly cycle during which standards,
a headspace sample from the equilibrator, and an ambient air sample are analysed.
Standards were obtained from NOAA's Climate Monitoring Diagnostics Laboratory
(CMDL) at Boulder. All reference standards undergo a pre- and post-cruise calibration
at CMDL against standards certified by the World Meteorological Organization
(WMO).
atm (left) and CO
2
flux in mol m
-2
yr
-1
(right) in the central and eastern equatorial Pacific are for two field seasons
in the boreal spring and autumn of 1992; the spring of 1993; the spring and
autumn of 1994; and spring/summer and autumn/winter of 1996. The lower p
CO2
values during 1992–94 ENSO event, combined with lower wind speeds,
resulted in a significant decrease in the CO
2
flux compared with the 1996 non-El Niño year. 'Under' atmospheric and
surface ocean p
CO2
measurements and supporting hydrographic data were obtained during these
cruises on board the NOAA Ships Discoverer, Malcolm Baldrige and
Ka'imimoana. The 'underway' measurements of CO
2
mixing ratios in dry air were made with a Li-Cor (Model 6251) non-dispersive
infrared analyser linked to the shipboard equilibrator following the methods
described in ref. 29. The system runs on an hourly cycle during which standards,
a headspace sample from the equilibrator, and an ambient air sample are analysed.
Standards were obtained from NOAA's Climate Monitoring Diagnostics Laboratory
(CMDL) at Boulder. All reference standards undergo a pre- and post-cruise calibration
at CMDL against standards certified by the World Meteorological Organization
(WMO).
Near the Equator there is a general inverse relationship between the p
CO2w
maximum and temperature minimum (Fig. 2). This is caused by enhanced upwelling
and advection of CO2-enriched waters during non-El Niño periods
(Feely
et al., 1995; Wanninkhof
et al., 1996). Sea surface p
CO2
is primarily affected by subsurface upwelling processes, which are controlled
by local and remotely forced wind events (McPhaden,
1993; Harrison,
1996; Toggweiler
and Carson, 1995). When the winds are strongest during the cold cycle of
ENSO deep upwelling occurs and p
CO2w
values are at a maximum (Feely
et al., 1995).
Figure 2. Time series of p
CO2
 . The data are from cruises during the
boreal spring between 1992–1994 and 1996 (SST, sea surface temperature).
The month of observations is listed in the key. a, Time series along 110°W.
b, The p
CO2
versus the temperature at the temperature
minimum along 110°W.
. The data are from cruises during the
boreal spring between 1992–1994 and 1996 (SST, sea surface temperature).
The month of observations is listed in the key. a, Time series along 110°W.
b, The p
CO2
versus the temperature at the temperature
minimum along 110°W.
The net flux of CO
2
across the sea–air interface is the product of the gas transfer velocity,
k, the solubility of CO
2
, s, and the p
CO2
difference between the ocean and atmosphere (p
CO2w
– p
CO2a
), according to the following the equation:
F = ks (p
CO2w
– p
CO2a
) (1)
In order to provide a simple relationship for the wind-speed dependence that
provided non-zero gas fluxes at low wind speeds, as well as considering the
long-term variability of the winds over the open ocean, one of us (R.W.) developed
(Wanninkhof,
1992) a quadratic equation for the wind speed dependence that was fitted
through the mean gas exchange based upon the oceanic bomb
14
C data in which
k = 0.39 w
2
10
(Sc/660)
–0.5
(2)
where Sc is the Schmidt number for CO
2
and w
10
is the wind speed at 10 m height in (m s
–1
). We used this relationship for the CO
2
flux calculations. One-month averaged re-analysis wind speeds were acquired
from the European Centre for Medium Range Weather Forecasts.
Spring flux data show large interannual effects of El Niño on CO
2
exchange in the equatorial Pacific (Fig. 1). From the peak El Niño period
during spring of 1992 to the normal conditions in spring of 1996, the average
CO
2
fluxes from 10°S to 10°N and 90°W to 140°W increased from
approximately 1.2 to 3.1 mol m
-2
yr
-1
. The increased CO
2
fluxes in 1994 and 1996 are due to increased surface water p
CO2
values and higher winds, resulting in stronger upwelling of CO
2
-enriched water from depths of about 70–100 m within the upper portion
of the Equatorial Undercurrent. Figure 1 also shows a springtime north–south
asymmetry, with the highest fluxes occurring in the southeastern portion of
the study area due to the stronger southeasterly winds which enhance localized
upwelling. These results indicate that the CO
2
flux to the atmosphere over the region south of the Equator is nearly twice
as large as that north of it during spring. The 1992 fall fluxes were also significantly
lower in the eastern Pacific as compared with the fall of 1996. Thus, the 1991–94
ENSO event was a period when the net sea-to-air flux was significantly lower
than the non-El Niño period in 1996.
The CO
2
fluxes during the 1992 period were very similar to those observed during the
peak of the 1986–87 ENSO event in the equatorial Pacific (Inoue
and Sugimura, 1992). But the significant feature of the 1991–94 ENSO
event was that it extended from the autumn of 1991 to the beginning of 1994.
Table 1 gives a summary of estimates of annual CO
2
fluxes from the equatorial Pacific for the period 1992–1994 and 1996 over
the regions from 10°S to 10°N and from 80°W to 135°E. For
the data from 1992 through 1994, we used the data from this study for the central
and eastern Pacific. For the western Pacific we used the p
CO2w
gradients given in Inoue
et al.(1996). The results show that for the 1-year period from the autumn
of 1991 until the autumn of 1992, approximately 0.3 Pg C was released to the
atmosphere. During the 12-month period of 1993 approximately 0.6 Pg C was released
to the atmosphere, in 1994 0.7 Pg C, and in 1996 0.9 Pg C. The total decrease
of CO
2
outgassing from the equatorial oceans during the prolonged 1991–94 El Niño
period (that is, 0.8–1.2 Pg C) was larger than during the severe El Niño
of 1982–83.
Table 1. Estimates of the equatorial Pacific sea-air CO
2
flux.
|
| |
Annual equatorial Pacific |
Annual equatorial Pacific |
Annual atmospheric |
Per cent of atmospheric |
| |
flux |
flux anomaly* |
flux anomaly** |
anomaly due to the |
| Year |
(Pg C) |
(Pg C) |
(Pg C) |
equatorial Pacific ENSO |
|
| 1992 |
0.3 ± 0.2 |
–0.6 ± 0.4 |
–1.69 |
36 |
| 1993 |
0.6 ± 0.4 |
–0.3 ± 0.3 |
–1.84 |
16 |
| 1994 |
0.7 ± 0.5 |
–0.2 ± 0.3 |
0.09 |
NA |
| 1996 |
0.9 ± 0.6 |
0.0 |
–0.03 |
NA |
|
NA, Not applied.
*Equatorial Pacific flux — 1996 equatorial Pacific flux. From an analysis
of seasonal and interannual datasets. The uncertainties are composed of the
seasonal variations of p
CO2w
(28%), wind speed variability (28%), and the wind-speed dependence of gas
exchange (44%). The region of coverage for the equatorial Pacific flux estimates
is from 10°S to 10°N and from 80°W to 135°E.
** Difference between measured atmospheric annual CO
2
increase and a long-term average annual increase of 3.18 PgC (ref. 19).
Recently, atmospheric chemists have reported a significant decrease in the
annual atmospheric growth rate of CO
2
between 1991 and 1993, from a mean value of 1.5 parts per million per year (p.p.m.
yr-1) throughout the 1980s to ~0.7 p.p.m. yr-1 in 1992
(Francey
et al., 1995; Ciais
et al., 1995; Keeling
et al., 1995; Ciais
et al., 1995). This was followed by normal values during the 1994–1996
period (average growth rate, 1.65 p.p.m. yr-1). Although all groups
have indicated that the slowdown of the atmospheric CO2 growth rate
must be the result of an enhanced uptake of CO2 in the oceans and
the terrestrial biosphere, there are considerable differences about the role
of the oceans in this process. Francey et al. (1995) used atmospheric
pCO2 and 13C/12C isotope ratio data
to estimate temporal variations of terrestrial and oceanic sinks for CO2
from 1982 through 1992. Compared to earlier years, their 1992 global oceanic
sink is about 2 Pg C yr-1 larger than average. Keeling et al.
(1995), using a similar global CO2 and isotopic mass balance based
on different data sets, found the ocean sink to be 0.6 Pg C yr-1
larger than average in 1992 and 0.9 Pg C yr-1 smaller in 1993. Our
data for the equatorial Pacific suggests that this region plays a significant
role in the decreased sea-to-air flux of CO2 during an ENSO event.
The decreased amount of CO2 released to the atmosphere in the equatorial
Pacific during the 1991–94 El Niño period (that is, 0.8–1.2 Pg
C) was approximately 16–36% of the atmospheric anomaly observed over the
same period (Table 1). Other oceanic regions could have contributed to the enhanced
atmospheric anomaly (Ciais et al., 1995). However, the results of this
study represent the largest documented interannual change in the oceanic CO2
source flux observed to date.
Model predictions of pCO2
in the equatorial Pacific have suggested a decrease over time because the pCO2a
is increasing much faster from anthropogenic inputs than is the pCO2
of the upwelled water (Maier-Reimer
and Hasselmann, 1987). This decrease would seem to be reasonable if the
main source of the upwelled water is the deep core of the Equatorial Undercurrent
which originates in the deep (>300 m) waters of the western South Pacific
(Tsuchiya
et al., 1990; Toggweiler
et al., 1991). The time lag for ventilation of anthropogenic CO2
into the formation waters and its transport to the equatorial Pacific would
cause a slower rate of CO2 increase in the upwelled water. However,
other models and tracer observations of equatorial upwelling indicate that a
significant fraction of the upwelled water is either recycled surface water
or entrained water from shallow subtropics north and south of the Equator (Quay
and Stuiver, 1983; Gu
and Philander, 1997). Under these conditions, surface ocean water pCO2
should have been nearly equilibrated with atmospheric CO2 and increased
at nearly the same rate as atmospheric CO2. To validate these models,
we evaluated seven data sets from the eastern equatorial Pacific collected between
140°W and 160°W in the spring during non-El-Niño years. All data
were converted to in situ pCO2 using the equations
outlined in Murphy
et al. (1994). For each cruise, we constructed a plot of pCO2w
versus sea surface temperature for the core of the upwelled water in the region
of the temperature minimum near the Equator, nominally between 0.5°N and
0.5°S. We then made a linear extrapolation of the data to a constant temperature
of 25°C to remove the effects of solubility changes due to differences
in seawater temperature. The results are plotted as a function of time in Fig.
3. The atmospheric data show a rate of increase of about 1.25 atm
yr-1 between 1961 and 1996, with a standard error of ±0.06
atm yr-1. The oceanic data also show
a similar rate of increase (~1.27 atm yr-1),
although the uncertainty is higher (standard error ±0.18 atm
yr-1). A similar constancy of pCO2
near 150°W was observed by Goyet
and Peltzer (1994) for two cruises in the autumn of 1979 and 1991. As the
total range of the pCO2w difference (~50 atm)
over the 35-year interval in Fig. 3 exceeds the normal local short-term variations
of temperature-corrected pCO2
in this region (Feely
et al., 1997), we conclude that the long-term pCO2
increases are due to anthropogenic inputs. For this data set, it appears that
pCO2 normalized to 25°C
has remained constant at about 100 ± 3 atm
over the period of the observations, providing further support for the shallow
recycling mechanism. It appears that only a portion of the upwelled water at
the surface originates from the core of the Equatorial Undercurent, but that
this is sufficient to supply a significant fraction of the nutrient concentrations
observed at the surface.
Figure 3. Long time series of seawater and atmospheric p
CO2
. The region of coverage is the central equatorial Pacific between 140°W
and 160°W. The seawater values have been corrected to a constant temperature
of 25°C to remove the effect of temperature on CO
2
solubility. Data Sources: 1961, Keeling
et al. (1965); 1984, Feely
et al. (1987); 1988, Murphy
et al. (1994); 1989, Murphy
et al. (1994); 1989, Inoue
and Sugimura (1992); 1996, Feely et al. (this work).
The oceanic increase of pCO2
in the equatorial Pacific agrees reasonably well with other time-series measurements
for the subtropical waters. From time-series measurements of pCO2
in the western subtropical Pacific between 3°N and 30°N from 1984
to 1993, Inoue
et al. (1995) obtained an average growth rate of 1.2 ± 0.9
atm yr-1. Similarly, the increase
with time of oceanic CO2 of approximately 1.5
yr-1 has been observed at the HOT times-series station off Hawaii
(Winn
et al., 1998). These results support our belief that the entrained
subtropical water which is injected into the upwelled water at the Equator has
been recently exposed to, and equilibrated with, the atmosphere.
Acknowledgements. The assistance of the officers and crew of NOAA ships
Discoverer, Malcolm Baldrige, and Ka'imimoana is acknowledged.
We thank D.E. Harrison for wind data, and C. Cosca, M. Steckley and D. Ho for
the pCO
2
measurements and data reduction. We also thank the NOAA TAO Project Office (director
M. McPhaden) for support. This work was supported by the NOAA Climate and Global
Change Program as part of the Ocean-Atmosphere Carbon Exchange Study.
Correspondence and requests for materials should be addressed to R.A.F. (e-mail:
Richard.A.Feely@noaa.gov).
Go back to abstract or forward to references
PMEL Outstanding Papers
PMEL Publications Search
PMEL Homepage