U.S. Dept. of Commerce / NOAA / OAR / PMEL / Publications
On the Global Distribution of Hydrothermal Vent Fields
Edward T. Baker
NOAA/Pacific Marine Environmental Laboratory, Seattle, WA
Christopher R. German
Southampton Oceanography Centre, Southampton, UK
In Mid-Ocean Ridges: Hydrothermal Interactions Between the Lithosphere
and Oceans, Geophysical Monograph Series 148, C.R. German, J. Lin, and
L.M. Parson (eds.), 245–266 (2004)
Copyright ©2004 by the American Geophysical Union. Further electronic
distribution is not allowed.
2. THE GLOBAL VENT FIELD DISTRIBUTION
2.1 Vent Field Locations
Large-scale, systematic searches for undiscovered vent sites have been organized with increasing frequency since the early 1990s [Baker et al., 1995; German et al., 1995] and now span the global range of spreading rates. The practical difficulty of comprehensively imaging vent fields means that the most efficient searches rely on inferring their presence from water column observations, a technique that carries varying levels of uncertainty. The enrichment of hydrothermal fluids in several key chemical tracers (e.g., Mn, Fe, CH , H
, H ,
,  He) relative to deep ocean waters offers an unambiguous method for detecting hydrothermal discharge even kilometers away from seafloor vent sites. As early as 1985 it became clear that optical properties (light transmission or backscattering) could be effective proxies for chemical anomalies in plumes [Baker et al., 1985; Klinkhammer et al., 1986; Nelsen et al., 1986/87]. This conformity validates many recent plume surveys, which are often ancillary projects combined with geophysical or rock-sampling operations that do not include plume water sampling. These projects almost uniformly measure only optical properties of the water column, because these data are sensitive, economical, simple to collect, and almost invariably provide a reliable indicator of underlying hydrothermal activity. Interpretative difficulties can arise, however, especially on slow-spreading ridges, which generally exhibit greater relief and thicker sediment accumulation than fast ridges. Under these conditions, the potential for a false positive (as from sediment resuspension around complex bathymetry) is increased.
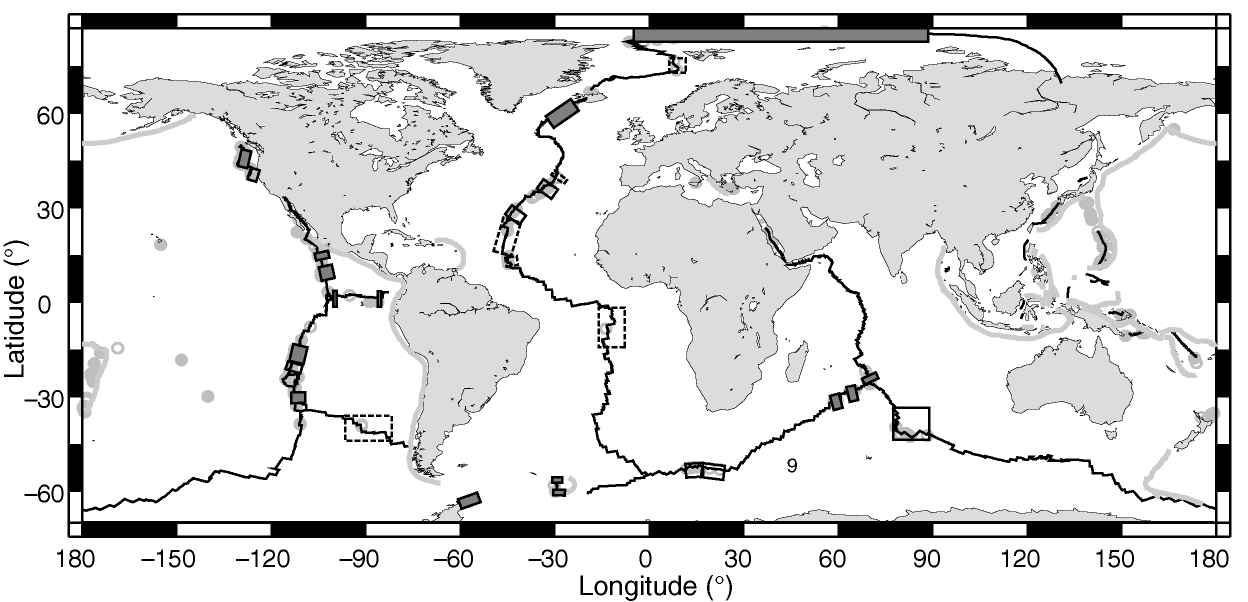
A review of the literature, existing vent-field databases, and unpublished sources enumerates ~280 sites of active hydrothermal venting on spreading ridges (including back-arc spreading centers), volcanic arcs, and intraplate volcanoes (Figure 1a). Details of each site including (where available) location, water depth, ridge spreading rate at the site location, and literature reference are available on the InterRIDGE web site (http://www.interridge.org). Some 145 of these sites have been confirmed by visual observation or imagery, while another ~130 are inferred solely from water-column observations. Confirmed vent sites range from isolated patches of low-temperature diffuse flow to enormous sulfide constructs hosting multiple high-temperature chimneys. Precise enumeration of these vent sites is necessarily subjective in the absence of any clear definition of a "vent field." Discharge along fast- and intermediate-rate ridges can be common for kilometers along axis, and investigators sometimes give unique names to vent sites only 10s or 100s of meters apart. In this paper, we have aggregated some of these crowded areas into single sites. Vent sites inferred from plume observations range from plumes unequivocally identified as hydrothermal from a combination of optical, hydrographic, and diagnostic chemical measurements, to minor optical anomalies that may ultimately prove unrelated to hydrothermal discharge. As with seafloor enumerations, a single plume observation reported here may arise from a single isolated source or from multiple but closely spaced vent fields extending for several kilometers along axis.
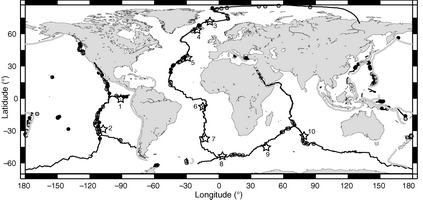
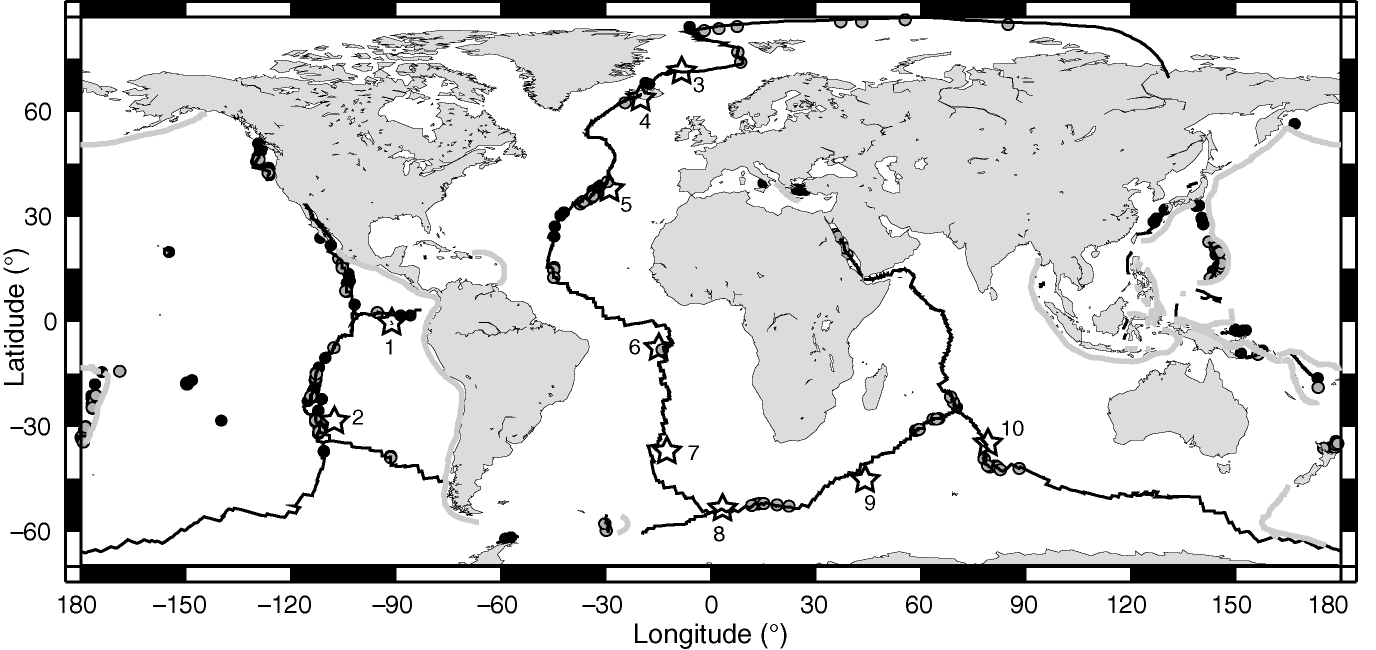
Figure 1a. Distribution of 144 known (black dots) and 133 inferred (gray dots) hydrothermal fields. Some individual fields contain several closely spaced (~100 m) "sites" distinctly named in the literature. Solid black lines are the midocean ridge and transform faults, gray lines are subduction zones. Hotspots (open stars) on or near (<500 km) the midocean ridge include 1, Galápagos; 2, Easter; 3, Jan Mayen; 4, Iceland; 5, Azores; 6, Ascension; 7, Tristan de Cunha; 8, Bouvet; 9, Crozet; and 10, Amsterdam-St. Paul.
Despite these caveats, the data distribution along ridges shows several robust trends. Over half (118) of our 222 known or inferred ridge vent sites occur on the heavily surveyed eastern Pacific ridges. Only one-fifth as many (24) have been discovered on the MAR, and all confirmed sites there fall within a narrow latitudinal band between 15° and 38°N, reflecting historic funding/research priorities within the international community. In the southern hemisphere, only two confirmed sites, both near the Rodriguez Triple Junction in the Central Indian Ocean, have been observed along a continuous ~30,000 km chain of ridge crest that includes the southern MAR, all of the SW, Central, and SE Indian Ocean ridges, and the Pacific Antarctic Ridge/East Pacific Rise south of 38°S. Plume surveys, however, have so far identified 25 targets along that same stretch of ridge, almost entirely on Indian Ocean ridges. While the focus of this paper is on vent sites along divergent plate boundaries, we note that intensive surveying efforts on volcanic arcs, especially since 1999, have found 58 confirmed or inferred sites, 20% of the global total [Ishibashi and Urabe, 1995; de Ronde et al., 2003; Embley et al., 2004]. In general, these sites remain understudied relative to ridge sites.
The usefulness of this distribution depends largely on its accuracy and completeness. Based on the spatial density of acquired data, we identify three types of surveyed areas along the global ridge system (Figure 1b). The most reliable statistics come from densely surveyed areas, where detailed water column and/or seafloor investigations provide excellent control on where vent fields are, and, equally importantly, are not. Human or photographic imaging of the seafloor provides the most meticulous surveying, but is an exceedingly inefficient mode of data-collection when compared to plume surveys and presently accounts for only a small fraction of mapped ridges. In most densely surveyed areas, hydrothermal plumes have been mapped either continuously (e.g., by a towed instrument package) or by closely spaced vertical profiles. These areas cover a total of ~4900 km of ridge axis and are most common along the eastern Pacific ridges, but also include the Reykjanes Ridge south of Iceland, areas around the Rodriguez Triple Junction in the Indian Ocean, the western Gakkel Ridge, and other scattered sections (Figure 1b). Moderately surveyed areas have undergone systematic searches for hydrothermal activity, but the spatial density of the data is lower than in densely surveyed areas and, thus, is not comprehensive. Within this category, therefore, it is quite probable that more active vent sites may exist than those that have actually been discovered to date. These moderately surveyed areas are most common on slow- and intermediate-rate spreading ridges and total ~4900 km (Figure 1b). Sparsely surveyed areas have been sampled in sufficient detail to locate the presence of confirmed and/or likely vent sites, but considerable uncertainty remains about the full extent of hydrothermal activity in those areas. This category totals ~3500 km of ridges and includes the Chile Rise and several large sections in the Atlantic Ocean (Figure 1b). Together, these three categories of surveyed areas still total only ~13,000 km of ridge length, or ~20% of the ~67,000 km [Bird, 2003] of global ridges (including ~6500 km in back-arc basins). Other ridge vent and plume sites fall outside these areas, of course, because they were discovered serendipitously, rather than as part of any systematic, large-scale hydrothermal survey.
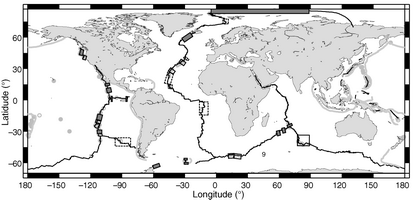
Figure 1b. Vent site distribution overlain with boxes indicating the quality of existing survey data along oceanic spreading ridges: densely surveyed (solid boxes), moderately well surveyed (open boxes), or sparsely surveyed (dotted line boxes).
2.2 Vent Field Statistics
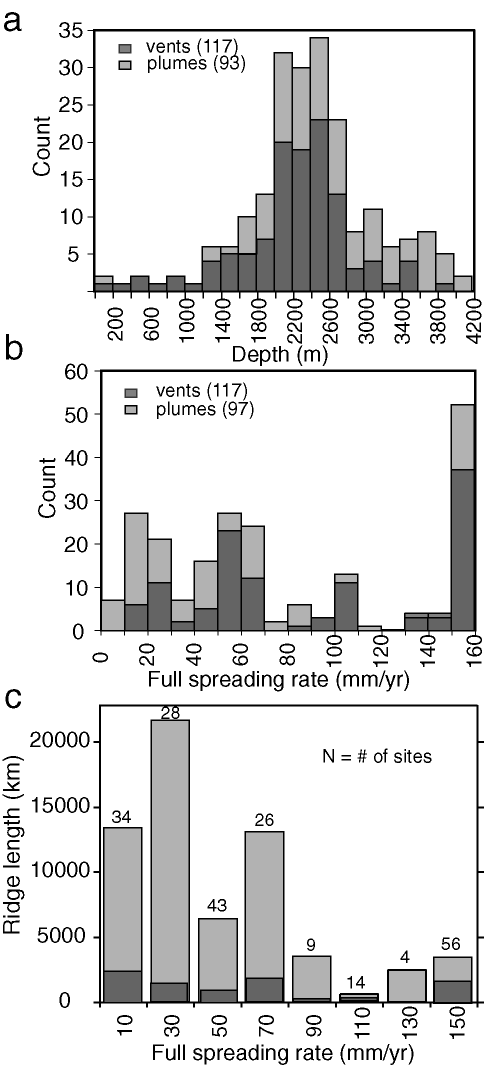
If we restrict our attention to vent fields on ridges (oceanic and back arc), a histogram of the water depths at which confirmed and inferred vent fields occur describes a distribution range from 200 to 4300 m, with highest frequencies at depths between 2200 and 2800 m (Figure 2a). Depths of those sites inferred from plume surveys are strongly skewed toward deeper waters, reflecting a concentration of recent plume surveys along ultraslow ridges [German et al., 1998a; Bach et al., 2002; Edmonds et al., 2003]. Only one site on an ultraslow ridge has actually been observed, at a confirmed depth of 4100 m on the Gakkel Ridge [Edmonds et al., 2003]. The depth reported for each inferred site in Figure 2a is the depth of the shallowest feature on the underlying rift-valley floor close to the location of the plume observation. Plotting frequency of vent sites against spreading rate results in a complex histogram with peaks at slow-, intermediate-, fast-, and superfast-spreading rates (Figure 2b). From this figure it is clear that the ratio of confirmed to inferred sites increases from the slowest to the fastest spreading rates, a testimony to the historical pattern of seafloor hydrothermal exploration. This distribution is also quite different from that for the cumulative length of ridge crests themselves vs. spreading rate (using data from DeMets et al. [1990] and Bird [2003]), which shows a general decline in ridge length at increasing spreading rates (Figure 2c). For example, ridges spreading faster than 120 mm/yr comprise only 9% of the total length of the global ridge system, but account for 27% (60) of the presently recognized ridge vent field total, a sum consistent with the 26% of total crustal volume generated each year along these ridges. Note, however, that fast-spreading ridges are currently oversampled compared to the rest of the ridge system. About 30% of ridges spreading faster than 100 mm/yr have been surveyed at least "densely" or "moderately," compared to only 12% of the ridges spreading slower than 80 mm/yr (Figure 2c).
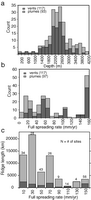
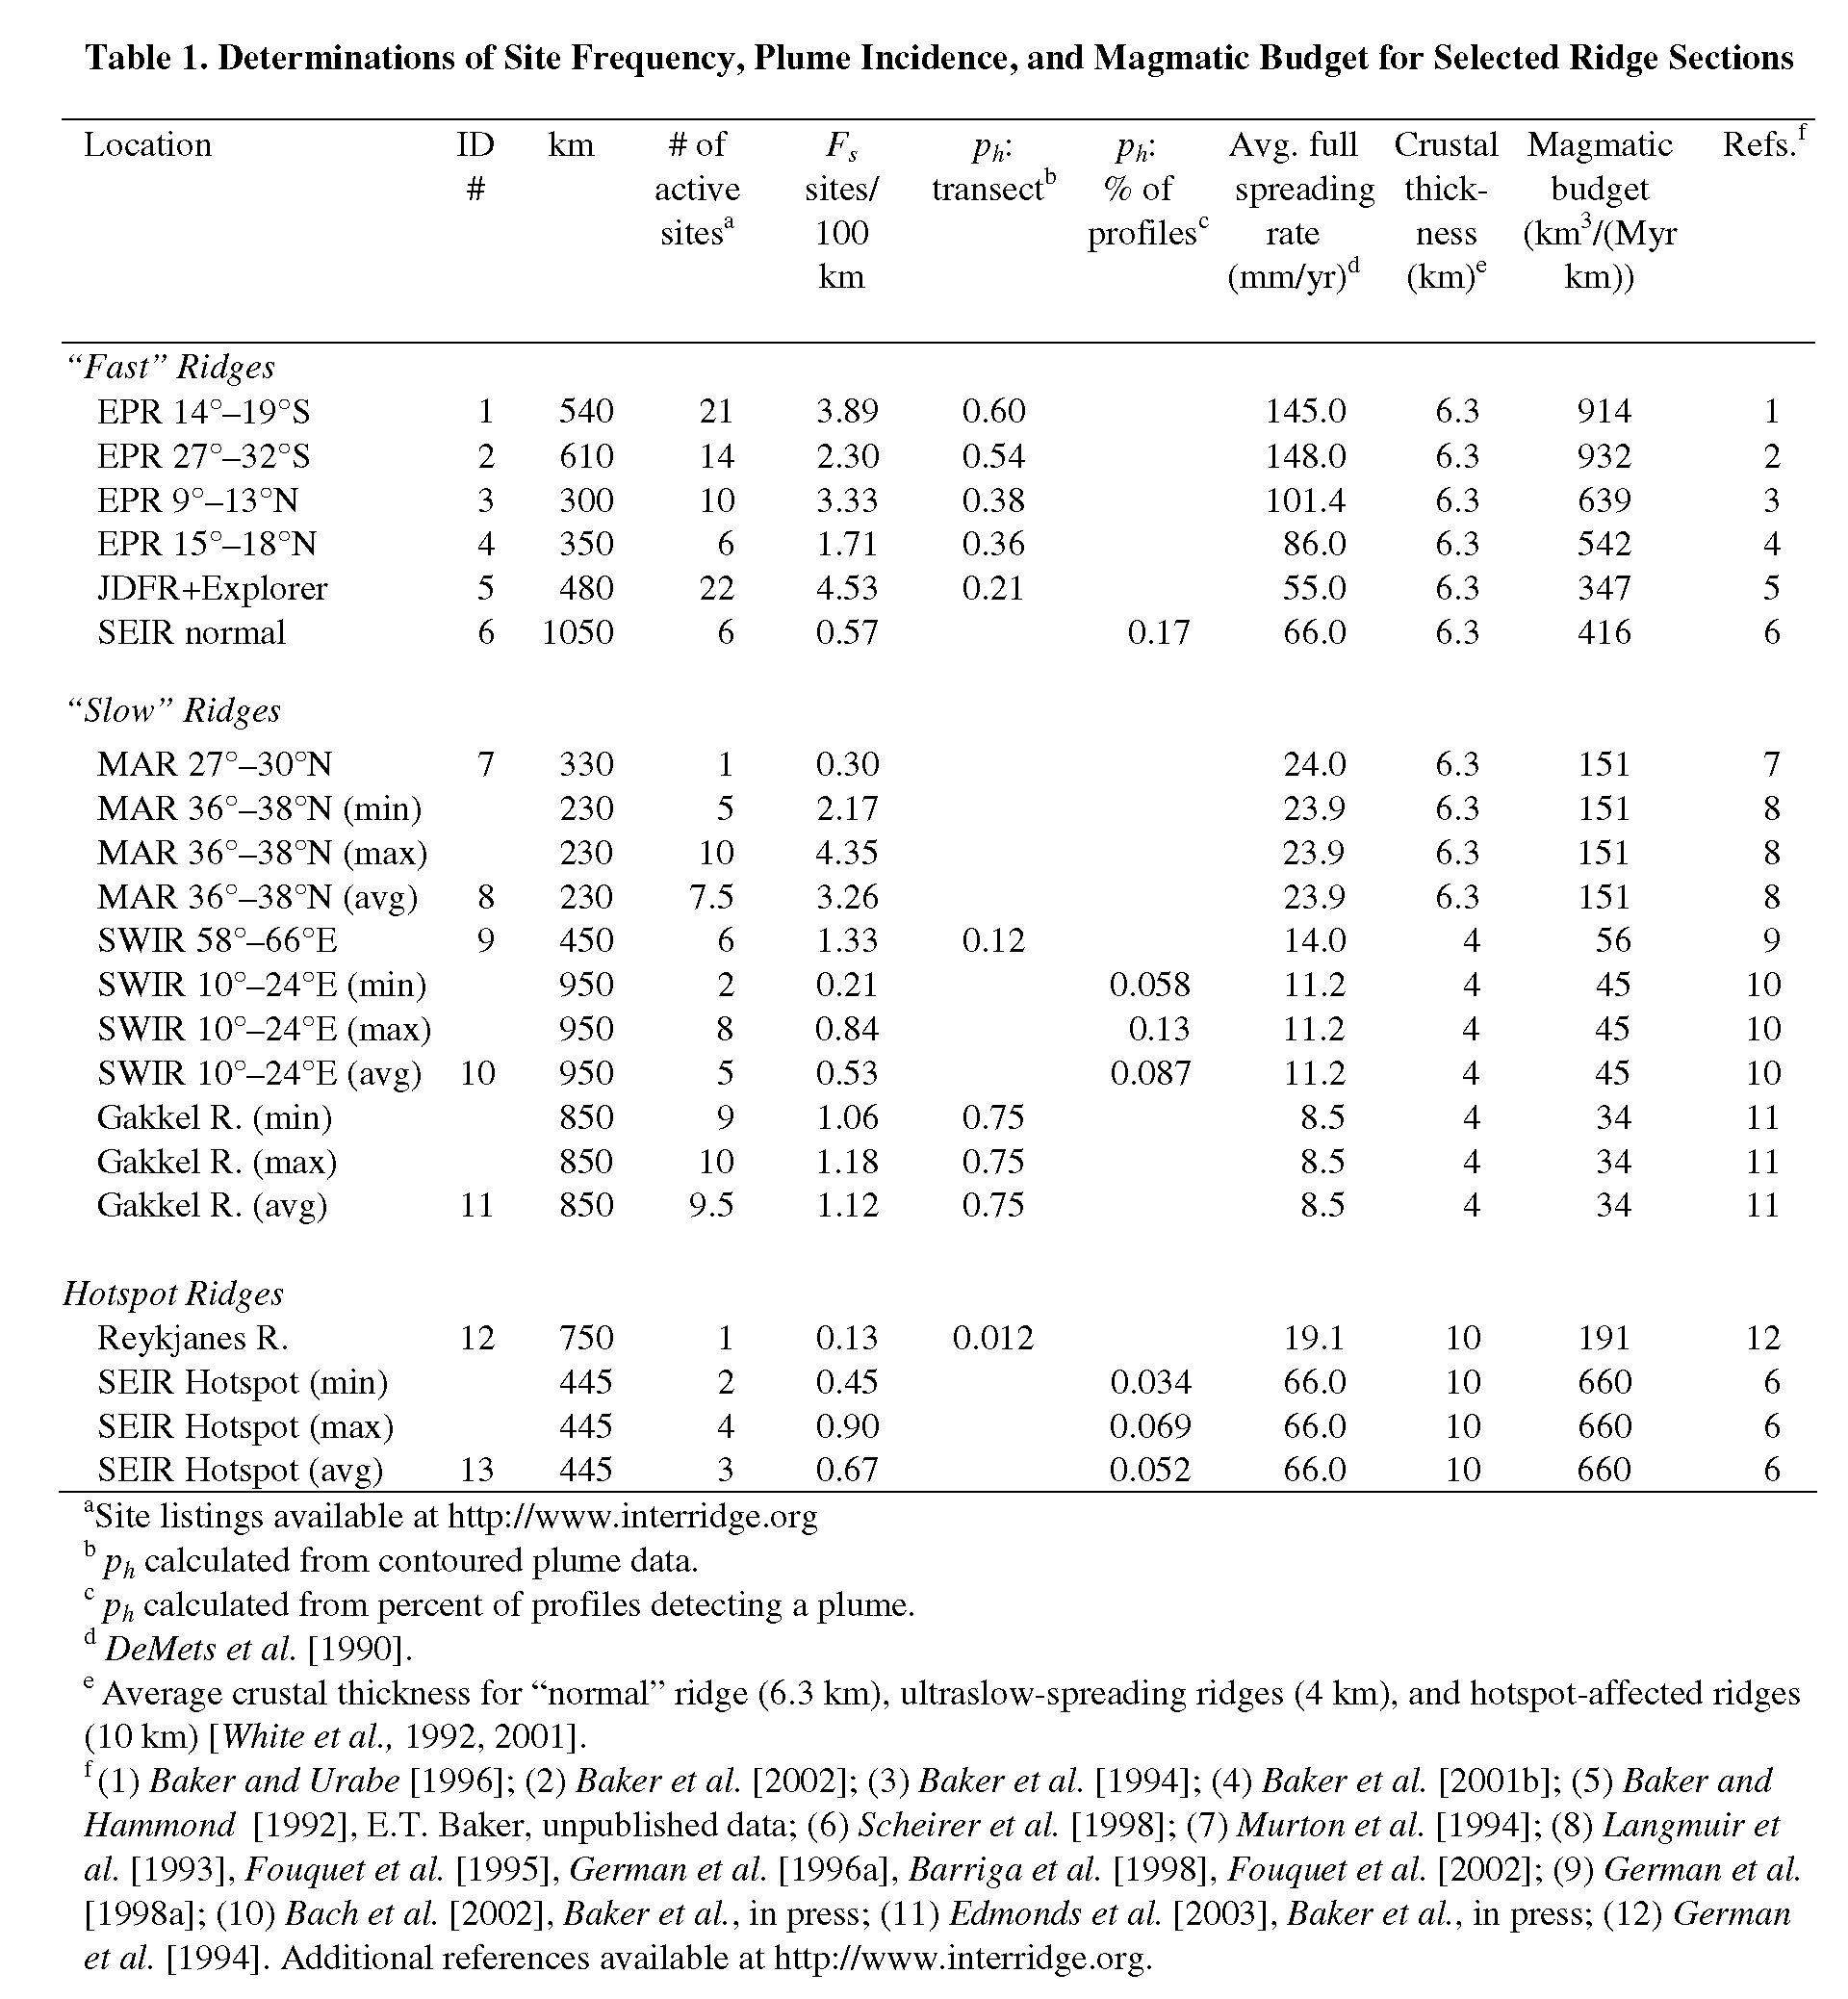
Figure 2. (a) Frequency distribution of the depth of vent sites located along midocean ridge and back-arc basin spreading centers. (b) Frequency distribution of the full spreading rate at the vent site locations. (c) Frequency distribution for the full spreading rate of the global spreading center system in 20 mm/yr increments [DeMets et al., 1990; Bird, 2003]. Numbers above each bar indicate the number of vent+plume sites in each spreading rate category. Dark bars at the bottom of each column indicate the approximate length of densely surveyed plus moderately surveyed ridge axis (from Figure 1b) in each spreading rate bin. This total includes more ridge sections than used in Table 1.
Return to previous section or go to next section
PMEL Outstanding Papers
PMEL Publications Search
PMEL Homepage