I'd be surprised if this weren't a known issue, but I haven't found a description of it in the email archive.
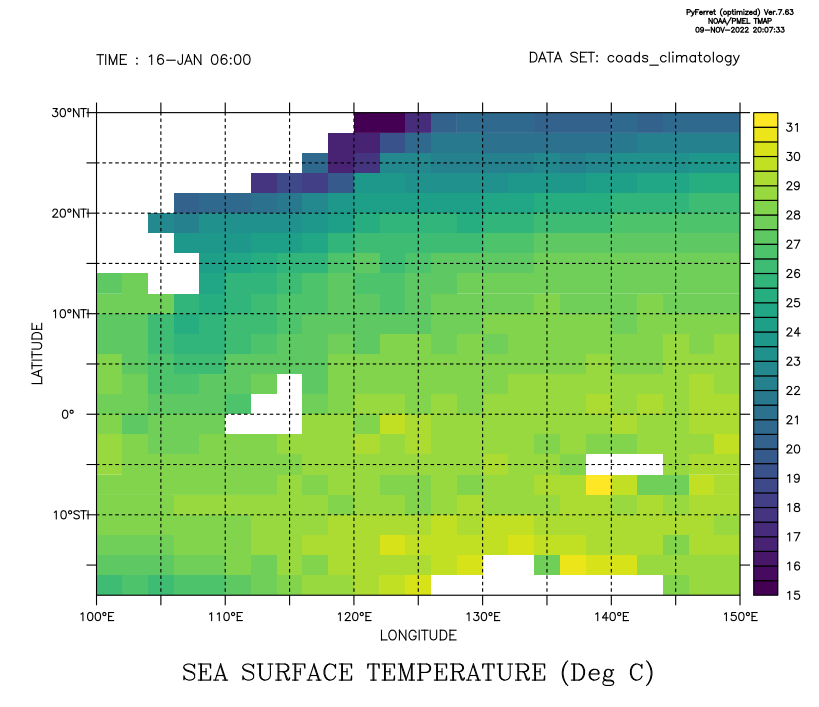
The code at the end of this message generates the plot below. As you can see, the graticule line is missing at 15°S.
I could just add the missing line, but I don't know what dash type graticule uses. (plot/dash . . . plots a totally different long-dashed line.)
PyFerret v7.63
macOS 13.0
Ryo
----
! Run as pyferret -nodisplay -script thisscript.jnl
set data coads_climatology
set mode grat:dash
shade/hlimits=100:150/y=18S:30N/L=1 SST
frame/file=tmp.png
set mode grat:dash
shade/hlimits=100:150/y=18S:30N/L=1 SST
frame/file=tmp.png