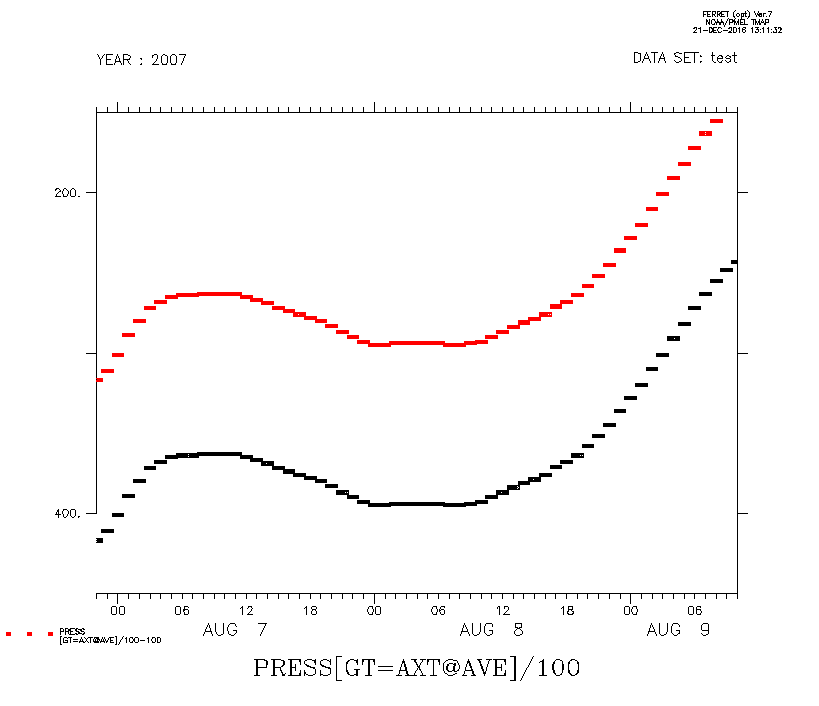
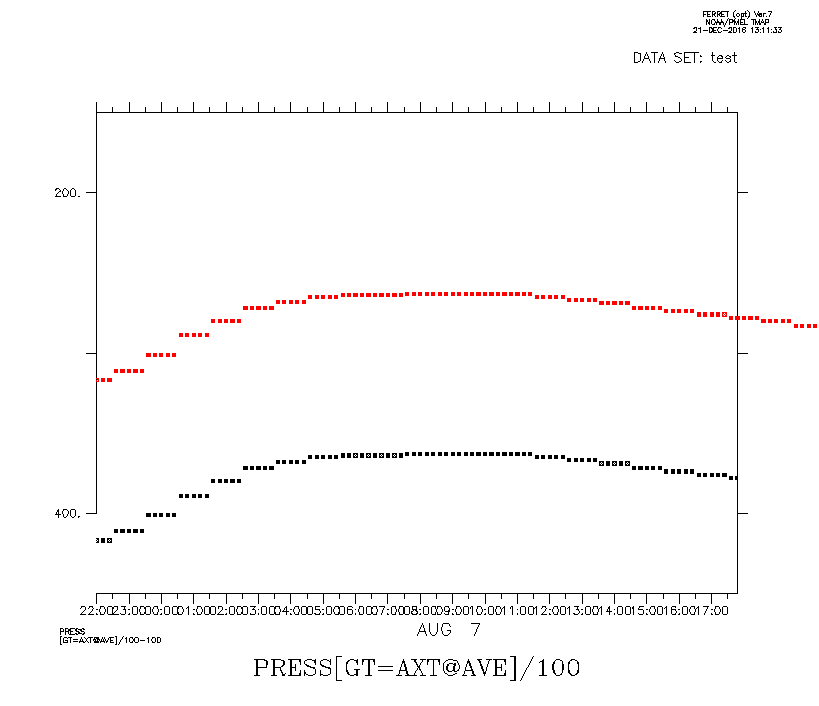
Hello ferreters,

when limiting the time axis to the first few points, a plot/over command may not respect the time axis limits, see attached files. This seems to happen when the display of the time axis switches from 6-hourly to shorter time intervals.

A part of the vertical axis is missing when plotting from 450 to 150 vertically instead of for instance from 500 to 200. This happens in both plots. The gap in the vertical axis appears when specifying no vertical interval, also with an interval of 100 (vlim=450:150:100), but is gone when specifying an interval of 10 (vlim=450:150:10).


Here's the script, and the dataset test.nc is attached:

def ax/T="06-AUG-2007 22:00:00":"15-AUG-2007 01:12:00":0.2/t0="06-AUG-2007 22:00:00"/unit=hour axt
use test.nc

set win 1
plot/sym=25/vlim=450:150:100/l=1:300 press[gt=axt@ave]/100
plot/ov/sym=25/col=red press[gt=axt@ave]/100-100

set win 2
plot/sym=25/vlim=450:150:100/l=1:100 press[gt=axt@ave]/100
plot/ov/sym=25/col=red press[gt=axt@ave]/100-100


I'm using FERRET v7 (opt), Linux 2.6.32-642.1.1.el6.x86_64 64-bit.


Any idea what's going on?


Best wishes,
Hella
Attachment:
plotover_L=1:300.png
Description: PNG image
Attachment:
plotover_L=1:100.png
Description: PNG image
Attachment:
test.nc
Description: Cdf file