Dear Ferret users,
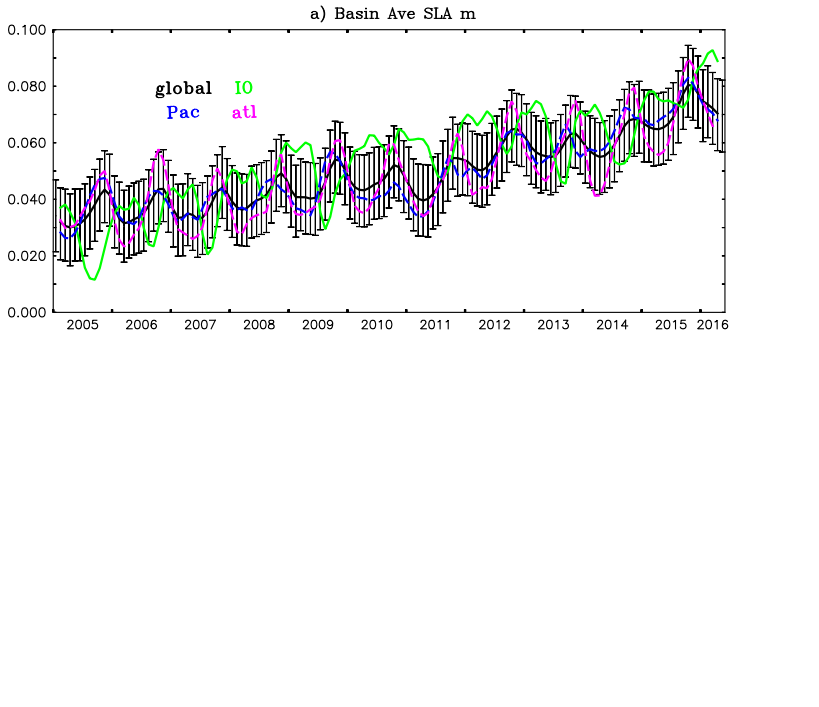
i am struggling with the number of error bars in the plot, to many error bars making the plot to congested. i want to plot few error bars so that i looks nice. i am attaching my figure. please suggest me how to manipulate the number of error bars and their positions.
let gm=sla_new[x=@ave,y=@ave,d=1]
let gst=(sla_new[x=@ave,y=@ave,l=@var,d=1])^0.5
go error_bars polygon/col=black/nolab/nokey gm gst
regards, saurabh
--
REGARDS
Saurabh Rathore
Research Scholar (PhD.)
Centre For Oceans, Rivers, Atmosphere & Land Science Technology
Indian Institute Of Technology, Kharagpur
contact :- 91- 8345984434