|
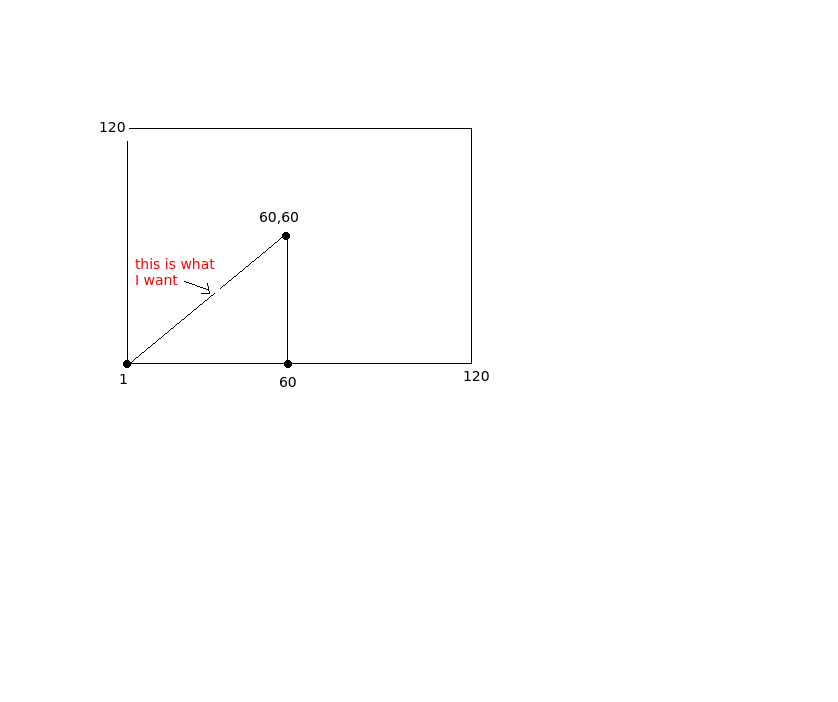
Hi, I have a domain x,y,z. I usually contour or fill a profile for the whole z, a fixed i and a range of j: /j=1:60/i=60/ but.. how can I contour for the whole z but from i,j (1,1) to i,j (60,60), i.e. i don't want a profile with the x axis of the graphic with latitudes or longitudes, I do want it but for a diagonal in the domain. Maybe the attached picture (domain.png) explains it in a better way. I want a figure like "example.png" but with the x axis with a non-fixed longitude, i.e. the xlat and xlong must change and plot points ij=(1,1),(2,2),(3,3),...,(60,60). Thank you very much in advance and sorry if my explanation is not very good Regards Carlos |
Attachment:
domain.png
Description: PNG image
Attachment:
example.png
Description: PNG image