[Thread Prev][Thread Next][Index]
[ferret_users] fancy plot
- To: ferret user ferret user <ferret_users@xxxxxxxx>
- Subject: [ferret_users] fancy plot
- From: Izidine Pinto <izidinep@xxxxxxxxx>
- Date: Mon, 10 May 2010 18:35:36 +0200
- Dkim-signature: v=1; a=rsa-sha256; c=relaxed/relaxed; d=gmail.com; s=gamma; h=domainkey-signature:mime-version:received:received:date:message-id :subject:from:to:content-type; bh=/1Nvyv/l7mX+DaIoLEQZ2c5Eet2jYc9j1CwgUd5gduo=; b=KpOX+nKU9siwmdxEU20SECdK4RZ7iN/9h6mdzd1oVPGobThE/KyG9HADnUrqAYB/UX Zhje+PnTHvW6dZRdP5SvCLX32v25EYsq4J1j7D2foxM8mkTqtnSXFuDOFxD3Wbf4nj/L SFHjTQJfFi0f2TBqyRuPGQIMWb0yra8BUOeqM=
- Domainkey-signature: a=rsa-sha1; c=nofws; d=gmail.com; s=gamma; h=mime-version:date:message-id:subject:from:to:content-type; b=MXDij7+h3Qbg4ucgIgTE/Bo2jbm0Ob1hH7GpMHY/a+7jgpMJx+u1NFatsK+VyaED9T bcFyJ2AKXuiOwtblQRpeaUb9AZbqxhp3UBOuYRfQ/ZjfsOWy2WFJO75PXqxtXGdtAe5h 1+ndnVKDJola7IeMHfWRu0radcO2WSD7NWqoI=
- Sender: owner-ferret_users@xxxxxxxx
Dear ferret users
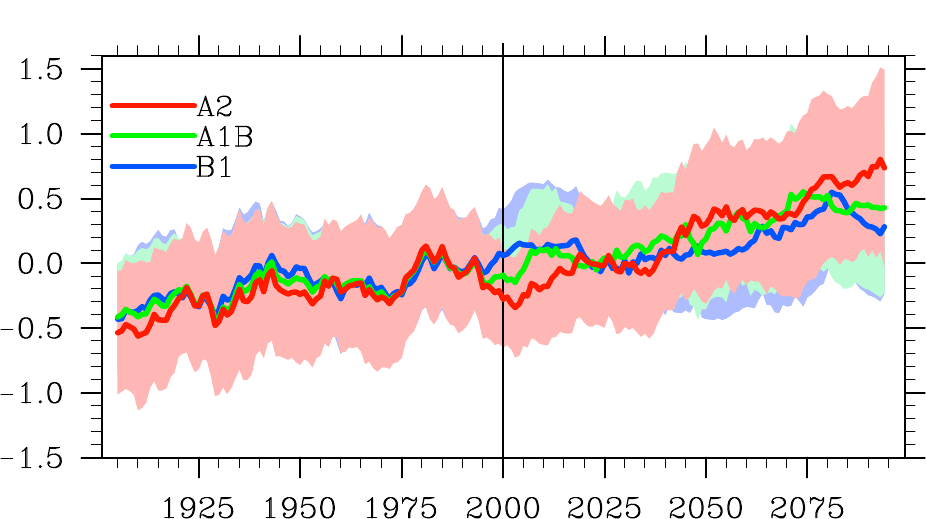
I have a time series plotted with the command (my_plot1.pdf)
plot/T=15-jan-1981:15-dec-1981 tempave,tempave-sd,tempave+sd
and was wondering if its possible in ferret to shade the width of 1 standard deviation as in
image.png attached
Thanks in advance
--
I.P.
:-)
Attachment:
my_plot1.pdf
Description: Adobe PDF document
Attachment:
image.png
Description: PNG image
[Thread Prev][Thread Next][Index]
Contact Us
Dept of Commerce /
NOAA /
OAR /
PMEL /
TMAP
Privacy Policy | Disclaimer | Accessibility Statement