The script "fill_between" will do this kind of thing. See How can I fill between two curves? at
http://ferret.pmel.noaa.gov/FERRET_17sep07/FAQ/custom_plots/fill_between.html
Ansley
Izidine Pinto wrote:
Dear ferret users
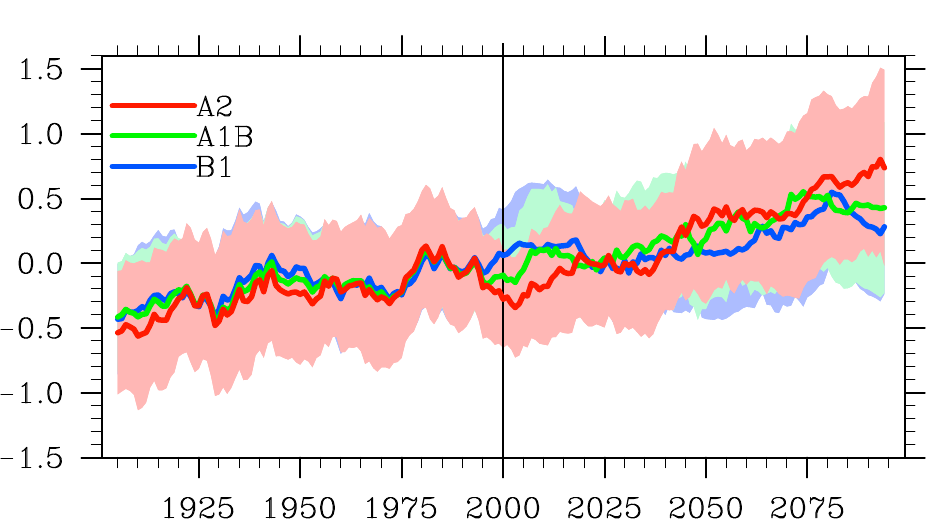
I have a time series plotted with the command (my_plot1.pdf)
plot/T=15-jan-1981:15-dec-1981 tempave,tempave-sd,tempave+sd
and was wondering if its possible in ferret to shade the width of 1 standard deviation as in
image.png attached
Thanks in advance
--
I.P.
:-)