I'd have one more idea and also some existing scripts -
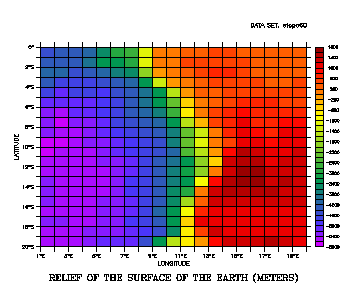
1) If you have a regularly-spaced grid, you should also be able to use the /GRATICULE qualifier on the plot command itself, if you are careful to put the tic marks of the plot axes at the edges of grid cells:
yes? use etopo60The graticule lines can be set to other colors and styles - see the documentation.
yes? ! Check the grid-cell edge values. Here they are at each degree.
yes? list/i=1:5 xboxlo[gx=rose]
yes? list/y=1:5 yboxlo[gy=rose]
yes? ! Use PPL XAXIS and PPL YAXIS to put the tic marks at each degree
yes? ! use /GRATICULE to draw line at each tic
yes? shade/set/x=1:20/y=-20:0/GRATICULE rose
yes? ppl xaxis 1,20,1
yes? ppl yaxis -20,0,1
yes? ppl shade

2) There are a few existing scripts to do this job. The unix command Fgo to search for scripts containing the word "grid" (I removed a few from this listing that aren't relevant)
> Fgo grid
* * * * * * * * in /home/porter/tmap/ferret/x86_64-linux/go
gridlines.jnl: plot over the grid of a plot
gridxt.jnl: create an overlay of IL graticule lines to show the grid points
gridxy.jnl: create an overlay of IJ graticule lines to show the grid points
gridxz.jnl: create an overlay of IK graticule lines to show the grid points
gridyt.jnl: create an overlay of JL graticule lines to show the grid points
gridyz.jnl: create an overlay of JK graticule lines to show the grid points
gridzt.jnl: create an overlay of KL graticule lines to show the grid points
polar_grid_fancy.jnl: overlay "fancy" radial logitude and curved latitude lines
polar_grid.jnl: overlay "quick" radial logitude and curved latitude lines
tgridlines.jnl: plot over the vertical grid of a plot
xgridlines.jnl: plot over the vertical grid of a plot
ygridlines.jnl: plot over the horizontal grid of a plot
the gridlines, xgridlines, ygridlines, tgridlines use the ideas in Jaison's post and use the old and unsupported command ALINE (which works ok in x and y but not in time).
the gridxy.jnl etc scripts use contouring.
jagadish karmacharya wrote:
Dear all,
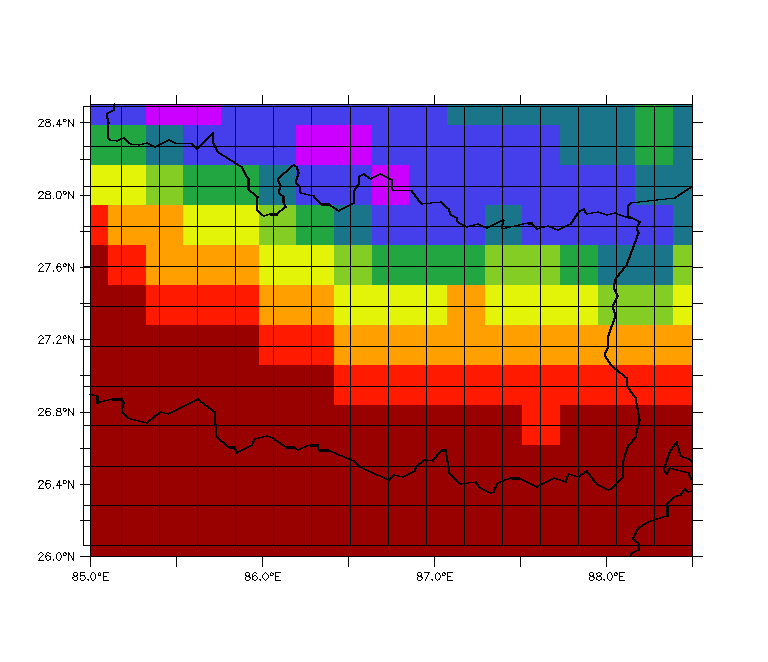
I wanted to outline each grid box of a grided data. For this, I used the method suggested by Jaison ( http://www.pmel.noaa.gov/maillists/tmap/ferret_users/fu_2004/msg00774.html) but got the attached plot. (grid_center....) Seems like the corner of the overlay box/rectangle lay over the grid center (rather than at the edge as I wanted). How can I overlay the box so as to match undrlaying grid?
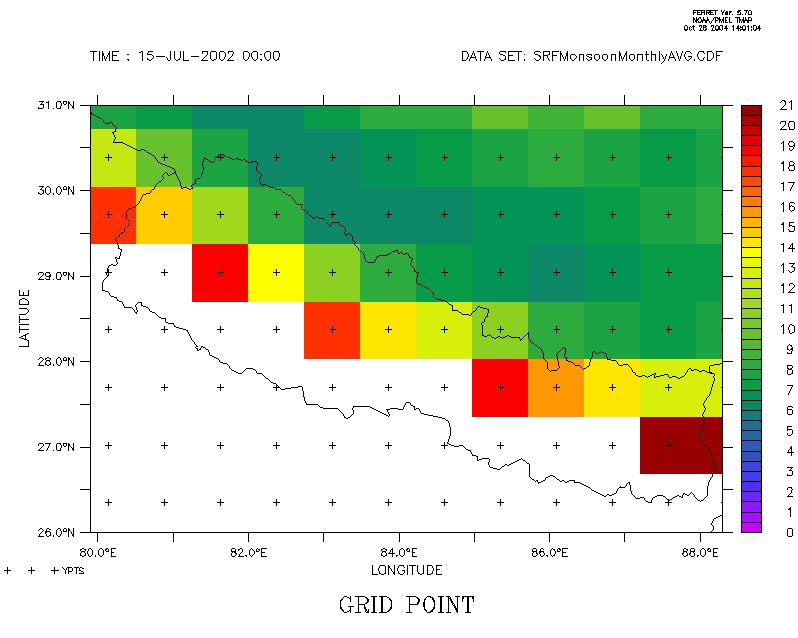
Also, some time ago I made plot (grid.gif) with marker at grid center but now forgot how i did that. Can any one suggest?
Regards
Jagadish

