[Thread Prev][Thread Next][Index]
Re: [ferret_users] location of legend
yangxing zheng a écrit :
Hi All-hands,

   It appears difficult to put legends in a good location if a large number of variables are plotted together. Attached figure is one of an example. It is ugly to see that legends occupy a large portion of figure. Can anyone has a good idea to put legend "horizontally" to save space?
By the way, the attached figure was made just simply using "go legend title orientation", and orientation has only four choice: ur,ul, lr,ll
Hi,
Despite some users ferret doubt, this type of plot is used a lot in
climatology research.
Read the IPCC Fourth Assessment Report: Climate Change 2007 (AR4)
chapter 10 for exemple
and you will see figure such as
http://www.ipcc.ch/graphics/ar4-wg1/jpg/fig-10-5.jpg
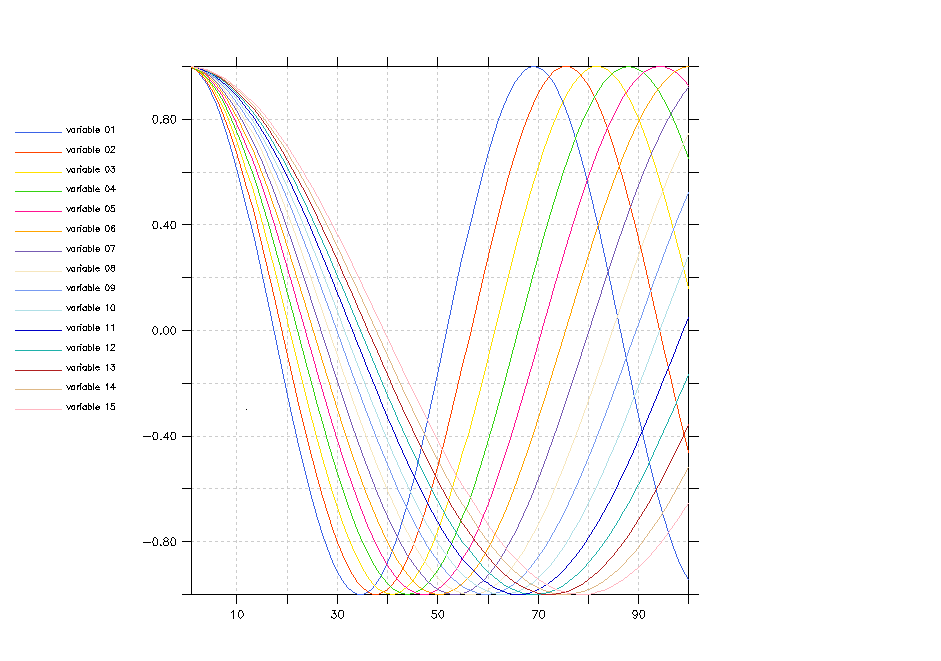
Attached is an example using the ferret mode linecolors to define more
than 6 colors.
It also use a script called text_legend_put.jnl which is easy to use and
may help you.
Pick it from
http://forge.ipsl.jussieu.fr/cgi-bin/viewvc.cgi/fast/?root=ioipsl&pathrev=FAST_608_1_3
Or download from cvs with following instructions

$ cd /where/to/install/the/package
$ cvs -d :pserver:anonymous@xxxxxxxxxxxxxxxxxxx:/home/ioipsl/CVSROOT login
Type anonymous
$ cvs -d :pserver:anonymous@xxxxxxxxxxxxxxxxxxx:/home/ioipsl/CVSROOT export -r FAST_608_1_3 fast
$ chmod -R 755 fast

Patrick

--
LSCE/IPSL, Laboratoire CEA-CNRS-UVSQ
Data Analysis and Visualization Engineer
IPSL Global Climate Modelling Group
--

!=====================================================
set mode linecolors 30

!=====================================================
! Please change the colors or/and legends if needed
! See http://www.dhtmlgoodies.com/scripts/color-schemer/color-schemer.html
! Here I have defined 15 colors in adition to the 6 proposed by default
let colors={"3B63E6", "FF4500", "FFE000", "34D314", "FF1392", "FFA400", "775BB4", "F5E6BD", "789BF1", "AFDFE6", "0000C7", "1FB1AA", "B12121", "DEB886", "FFB6C1"}

!=====================================================
! Change the color 6 to a light gray for graticule
ppl color 6, 80, 80, 80

!=====================================================
! Define colors from colors variable accessible from color=7
repeat/range=1:`colors,return=isize `/name=c ( \
	def sym cs=`c` ;\
	go set_color_from_hexa `c+6` `colors[i=($cs)]` )

!=====================================================
! Define some dummy variables to plot
repeat/range=1:`colors,return=isize `/name=c ( \
	let var_`c,zw=2`=cos(i/`10+c`) )

!=====================================================
set viewport full
go margins_set 10 10 25 10

! Plot all variables together to get hlim and vlim set from the range of all variables
! Is there a better way to do this ?
plot/i=1:100/color=1/nolabel/grat=(dash,color=6) var_01,var_02,var_03,var_04,var_05,var_06,var_07,var_08,var_09,var_10,var_11,var_12,var_13,var_14,var_15

pause

!=====================================================
! Overlay colored lines (do not use qualifier /thick for now)
repeat/range=1:`colors,return=isize `/name=c ( \
	plot/over/color=`c+6`/i=1:100/nolab var_`c,zw=2` )

!=====================================================
! Put legend
def viewport/x=0:1/y=0:1 full2
set viewport full2

plot/nolab/noaxis i[i=1:5]*0-1E34 ! plot nothing, needed to define symbols used by text_legend_put

repeat/range=1:`colors,return=isize `/name=c ( \
	go text_legend_put 2 8 `80-(c-1)*3` "@AS variable `c,zw=2`" `c+6` 0.2 )
[Thread Prev][Thread Next][Index]
Contact Us
Dept of Commerce /
NOAA /
OAR /
PMEL /
TMAP
Privacy Policy | Disclaimer | Accessibility Statement
