[Thread Prev][Thread Next][Index]
[ferret_users] time axis for perpertual year run
I have a monthly mean netcdf files from a run of a model which has run
2001 repeatedly. Each year is in one netcdf file. I want to view the
files as a time sequence rather than treat them as a climatology but
am not sure how best to create the new time axis. As each file is for
'2001' I need to create a new time axis in order to see the sequence
of years. I've done this by:
def axis/t=1:60:1 y5
I need use the @asn operator for each netcdf file and overlay the
years, like this:
def axis/t=13:24:1 y2
def axis/t=25:36:1 y3

let/d=1  z1=z[gt=y5@asn]
let/d=2  z2=z[gt=y2@asn]
let/d=3  z3=z[gt=y3@asn]

and plot by:

fill z1
fill/over z2
fill/over z3
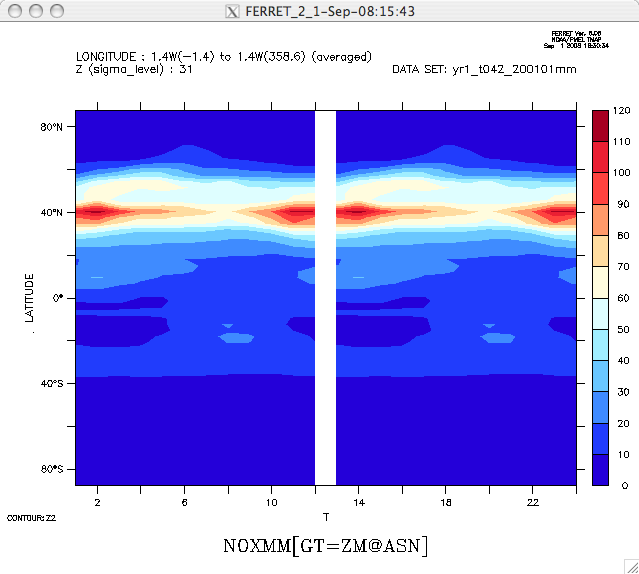
The first plot 'fill z1' gives a time axis for the full 5yrs but only
the first 1-12 months filled as the first netcdf file has only 12
months. The next commands then fill months 13-24 and 25-36 respectively.
This works just fine but the problem is that I get a gap between the
months 12-13 and 24-25 (see plot). I'd like the figure to be
continuous.
Anyone know a way round this?

Thanks,   Glenn
[Thread Prev][Thread Next][Index]
Contact Us
Dept of Commerce /
NOAA /
OAR /
PMEL /
TMAP
Privacy Policy | Disclaimer | Accessibility Statement