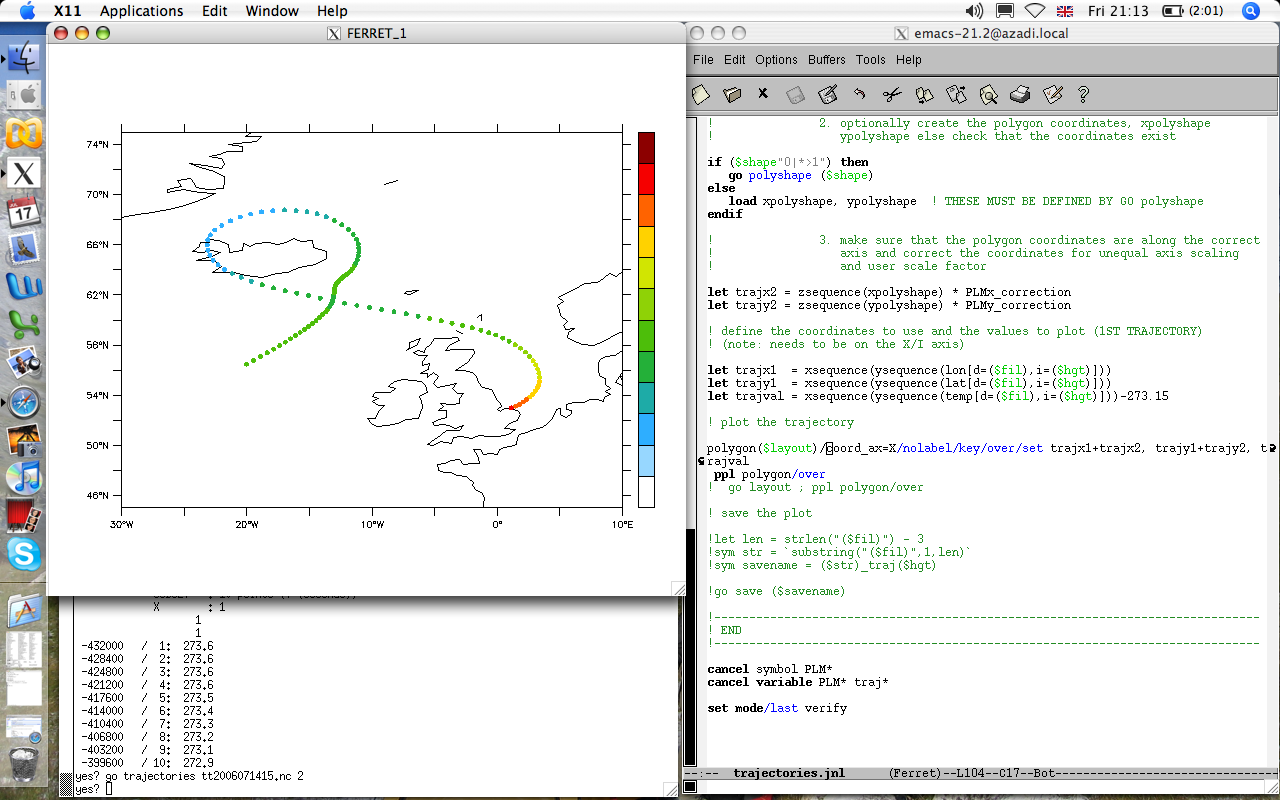
Hi everyone, I'm trying to plot back trajectories and for this I have been using the POLYGON command. I followed closely the Ferret examples and succeeded to plot one trajectory. However, the shakey is not behaving as expected. No matter what I do, it won't get its labels displayed. Has anyone ever encountered this situation? I've attached the script I'm using along with a screenshot showing the plot. Here below is a SHOW DATA of the NetCDF data file I have (note that the I axis refers to different pressure levels at the final point). If anybody has an idea, it is more than welcome! Thanks, Emilie P.S. for the Ferret team: great look the new website! Congratulations! It was a nice surprise for my come back to Ferret. yes? show data currently SET data sets: 1> ./tt2006071415.nc (default) name title I J K L LON longitude 1:3 ... ... 1:121 LAT latitude 1:3 ... ... 1:121 LEV pressure 1:3 ... ... 1:121 TEMP temperature 1:3 ... ... 1:121 THETA potential temperature 1:3 ... ... 1:121 yes? list/l=1 temp VARIABLE : temperature (K) FILENAME : tt2006071415.nc SUBSET : 3 points (X) T (seconds): -432000 1 / 1: 273.6 2 / 2: 274.5 3 / 3: 267.4 yes? list/i=1 temp[l=1:10] VARIABLE : temperature (K) FILENAME : tt2006071415.nc SUBSET : 10 points (T (seconds)) X : 1 1 1 -432000 / 1: 273.6 -428400 / 2: 273.6 -424800 / 3: 273.6 -421200 / 4: 273.6 -417600 / 5: 273.5 -414000 / 6: 273.4 -410400 / 7: 273.3 -406800 / 8: 273.2 -403200 / 9: 273.1 -399600 / 10: 272.9 |
Attachment:
trajectories.jnl
Description: Binary data