[Thread Prev][Thread Next][Index]
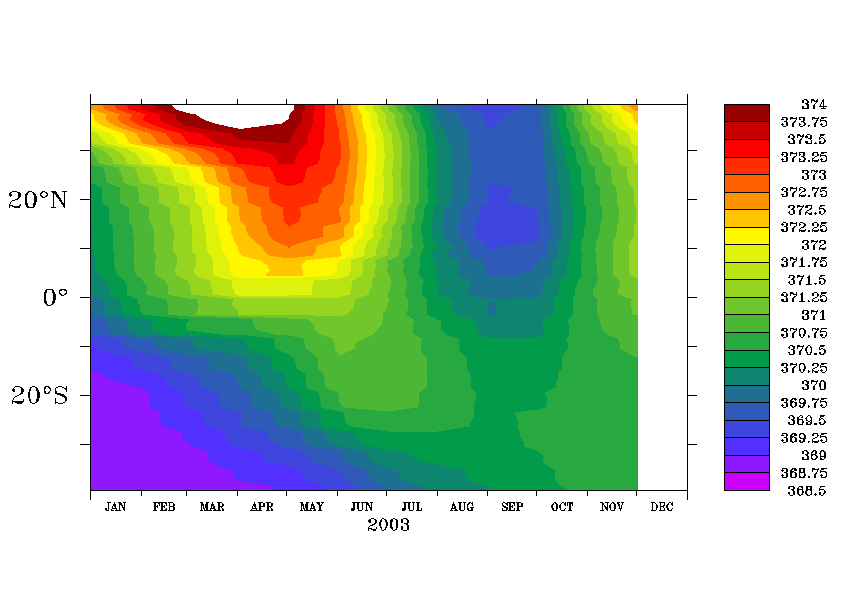
shade plot problem from added files
Hello Ferret Users,
I have 12 files of monthly mean CO2 from jan to
dec 2003 so I added all those files to see the
zonal mean monthly variation(x-axis as latitude,
y-axis as months).
The script which adds the file defines the time
axis like :
define
axis/t=01-Jan-2003:1-Dec-2003:1/units=months tax
But when I plot the zonal mean monthly variation
then the dec month shows the gap.
Is there any way to avoid this gap, like if we can
define the time axis in some another way.
Here I have attched that plot.
Many thanks for your help.
Regards,
Yogesh
--
===========================================
Yogesh K. Tiwari,
Max-Planck Institute for Biogeochemistry,
Beutenberg Campus, Hans-Knoell-Strasse 10,
D-07745 Jena,
Germany
Office : 0049 3641 576 376
Home : 0049 3641 223 163
Fax : 0049 3641 577 300
Cell : 0049 1520 4591 008
e-mail : yogesh.tiwari@bgc-jena.mpg.de
===========================================

[Thread Prev][Thread Next][Index]
Dept of Commerce /
NOAA /
OAR /
PMEL /
TMAP
Contact Us | Privacy Policy | Disclaimer | Accessibility Statement
