[Thread Prev][Thread Next][Index]
Re: vector plots in stereographic projection
Hi Bernadette,

Jon Callahan, who is the expert on the "mp" machinery is away for
several weeks. I'll attempt to fill in.

I made a quick check of the Email archives and came across this
http://ferret.wrc.noaa.gov/Ferret/Mail_Archives/fu_99/tmp/msg00343.html

Known problems with the curvilinear VECTOR command include its inability
to deal properly with irregularly spaced grids. Is that a factor in your
plots?  If so, simply regrid to a regular grid.

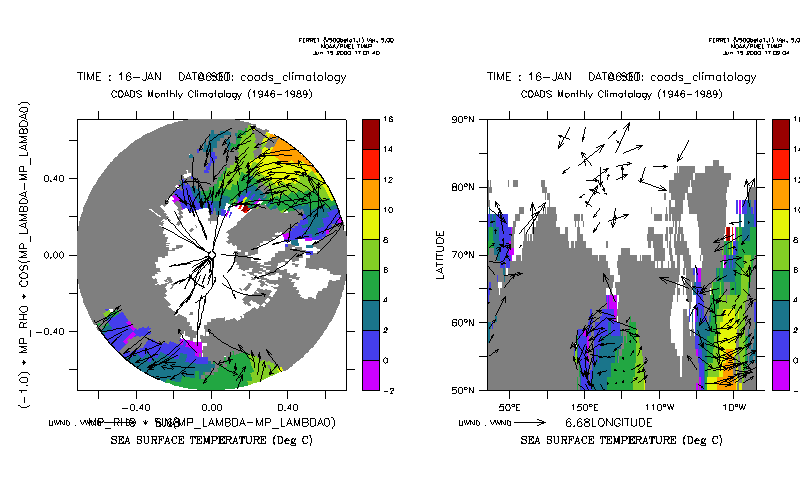
A quick test of the commands below it seems to be working ....

    - steve

=================
set wind/asp=.55/size=0.4
use coads_climatology
set region/y=50n:90n

set view left
set grid sst
go mp_stereographic_north
shade sst[l=1],x_page,y_page
go mp_fland
vector/over/l=1 uwnd,vwnd,x_page,y_page

set view right
shade sst[l=1]
go fland
vector/over/l=1 uwnd,vwnd
frame/file=mp_vector.gif

================

Bernadette Fritzsch wrote:

> Hallo,
>
> i have some data which i want to plot in stereographic projections.
>
> My script looks like
>
> go mp_stereographic_north
> set region/y=50n:90n
> set grid thick
> contour /lev=(0,5,1) thick ,x_page,y_page
>
> set grid u
> vector u,v,x_page,y_page
>
> The first works well, the second does not. WHy?
>
> Any suggestions?
>
> Thanks.
>
>         Bernadette

--

                |  NOAA/PMEL               |  ph. (206) 526-6080
Steve Hankin    |  7600 Sand Point Way NE  |  FAX (206) 526-6744
                |  Seattle, WA 98115-0070  |  hankin@pmel.noaa.gov

[Thread Prev][Thread Next][Index]
Dept of Commerce /
NOAA /
OAR /
PMEL /
TMAP
Contact Us | Privacy Policy | Disclaimer | Accessibility Statement
