Realtime data from BOTPT-A302-MJ03E - Eastern Caldera
This page displays plots of near-real-time data (updated every 20 minutes) from one of four BPR/Tilt (BOTPT) instruments at Axial Seamount, part of the National Science Foundation's (NSF) Ocean Observatories Initiative (OOI) Cabled Array seafloor observatory, operated by the University of Washington. The BOTPT instruments were built by NOAA's Pacific Marine Environmental Lab (PMEL) and Oregon State University (OSU). The BPR/Tilt instruments have 4 sensors: 1) a nano-resolution bottom pressure recorder (NANO), 2) a high-resolution tiltmeter (LILY), 3) a low-resolution tiltmeter (IRIS) , and 4) a coarse-resolution tiltmeter (HEAT). The dates/times in the plots below are in GMT (+8 hrs of local PST, or +7 hrs of PDT time on the US west coast).
LINK TO PAGE WITH ENGINEERING DATA PLOTS
LINK BACK TO PAGE WITH MAPS AND OTHER INSTRUMENTS
Bottom Pressure Recorder (NANO-BPR)
The NANO-BPR precisely measures the pressure of
the overlying ocean. The raw BPR pressure data are converted to depth, and after subtracting predicted tides, the de-tided depth (red)
shows vertical movements of the seafloor and other residual signals. Temperature data are shown in green. Separate plots below show (1) the last 7 days of pressure data, (2) the last 6 months of pressure data, (3) data since the 2015 eruption, and (4) the entire OOI time-series. As of October 30, 2015, we are using predicted tides generated by Rick Thomson at the Institute of Ocean Sciences in Sydney, BC, based on the first year of OOI BPR data from Axial. The short-term apparent depth variations of ±5-15 cm over hours to days do NOT appear to be geophysical in origin, and instead reflect some combination of varying atmospheric pressure, oceanographic conditions, and misfit with predicted tides. This interpretation is supported by the fact that the tiltmeter data (below) do not show these short-term variations. However, the longer-term depth changes over weeks-months-years DO reflect volcanic inflation/deflation and the magmatic cycle at the volcano.
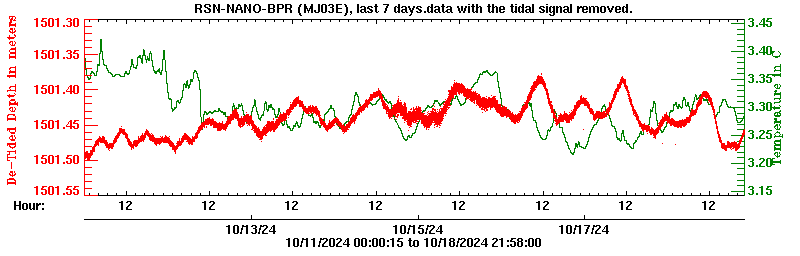
Plot 1: NANO-BPR pressure data with predicted tides removed (red) and temperature (green), over the last 7 days.
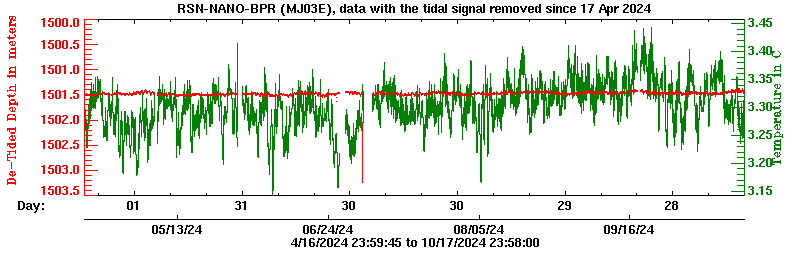
Plot 2: NANO-BPR pressure data with predicted tides removed (red) and temperature (green), over the last 6 months. ONLY UPDATED ONCE PER DAY.
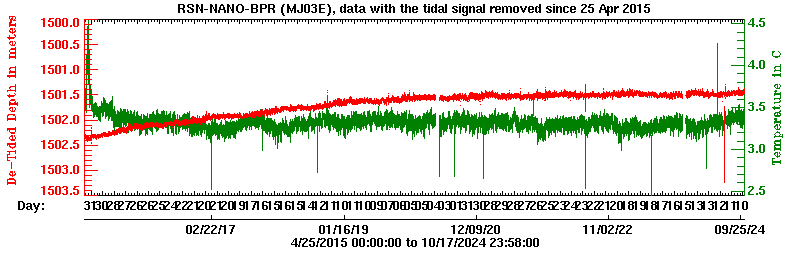
Plot 3: NANO-BPR pressure data with predicted tides removed (red) and temperature (green), since 25 April 2015.. ONLY UPDATED ONCE PER DAY.
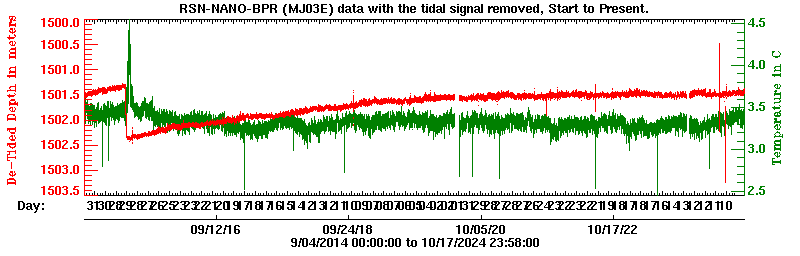
Plot 4: NANO-BPR pressure data with predicted tides removed (red) and temperature (green), over the entire record. ONLY UPDATED ONCE PER DAY.
High-resolution tiltmeter (LILY)
The plots below are from the high-resolution tiltmeter (LILY), with tilt data measured on two perpendicular axes in microradians, which is a precise angular measure in parts per million. For example, one microradian is the amount a 1-km-long bar would be tilted, if one end were lifted up by 1 mm. The resultant tilt magnitude and direction (using the sensor's compass data) are also shown. Abrupt vertical lines are ground motion recorded during local earthquakes. The LILY tiltmeter can be automatically re-leveled when it gets close to being out of range (+/- 330 microradians). Large tilt off-sets in the record are when the instrument was releveled.
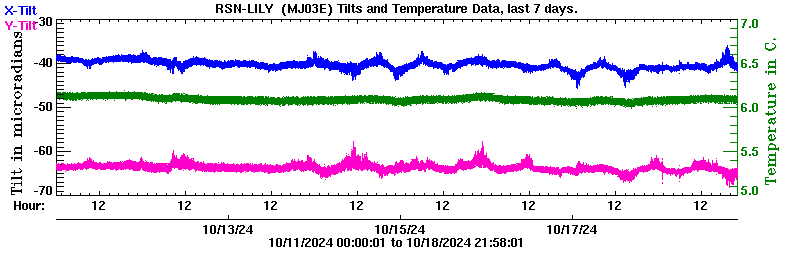
Plot 5: LILY X-axis tilt (blue) and Y-axis tilt (pink), in microradians, and temperature (green), over the last 7 days.
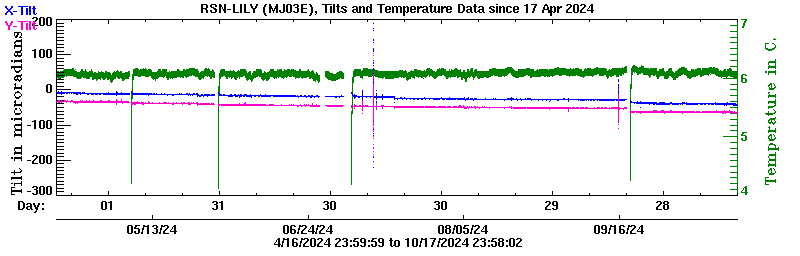
Plot 6: LILY X-axis tilt (blue) and Y-axis tilt (pink), in microradians, and temperature (green), over the last 6 months. ONLY UPDATED ONCE PER DAY.
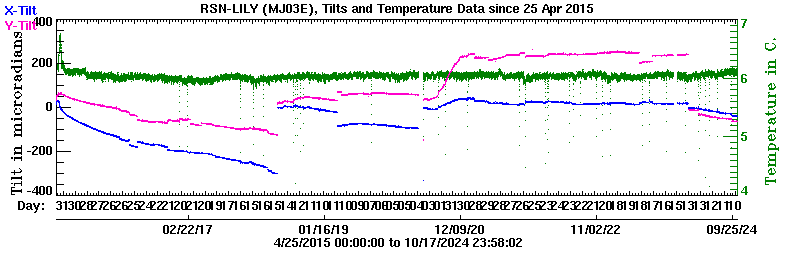
Plot 7: LILY X-axis tilt (blue) and Y-axis tilt (pink), in microradians, and temperature (green), since 25 April 2015. ONLY UPDATED ONCE PER DAY.
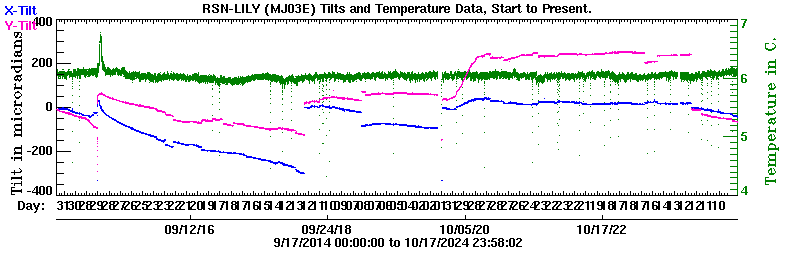
Plot 8: LILY X-axis tilt (blue) and Y-axis tilt (pink), in microradians, and temperature (green), over the entire record. ONLY UPDATED ONCE PER DAY.
The set of 4 plots below show the resultant LILY tilt magnitude (red) and direction (purple) calculated from the raw X- and Y-tilts (recorded once a second), so these effectively show the resultant tilt since the last LILY re-leveling.
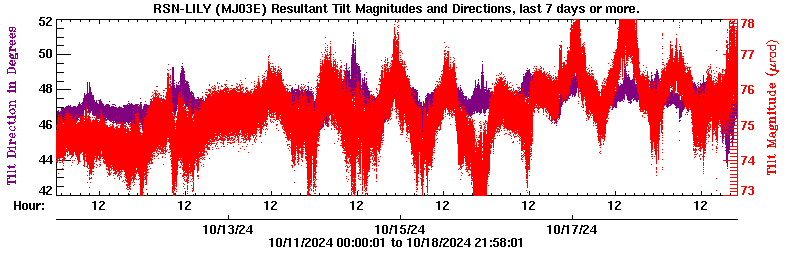
Plot 9: Resultant tilt magnitude (red) and direction (purple) over the last 7 days.
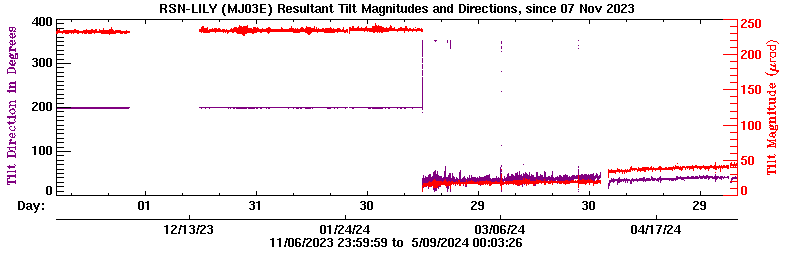
Plot 10: Resultant tilt magnitude (red) and direction (purple) over the last 6 months. ONLY UPDATED ONCE PER DAY.
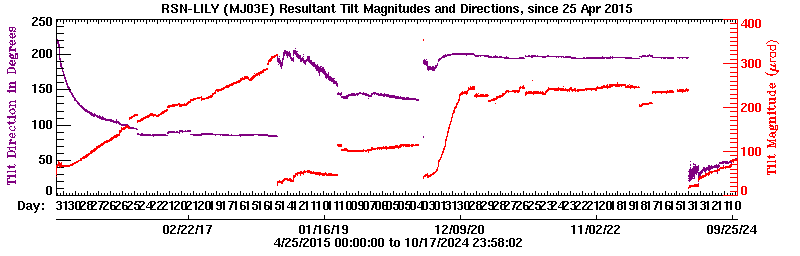
Plot 11: Resultant tilt magnitude (red) and direction (purple) since 25 April 2015. ONLY UPDATED ONCE PER DAY.
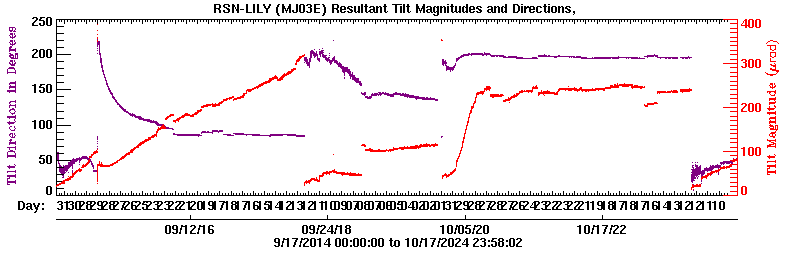
Plot 12: Resultant tilt magnitude (red) and direction (purple) over the entire record. ONLY UPDATED ONCE PER DAY.
The 4 plots below show the resultant LILY tilt magnitude (red) and direction (purple), calculated from hourly averages of the the X- and Y-tilts relative to the values 1 week earlier, so these effectively show the weekly rate of tilt and how it has changed with time. These plots are only updated once per day.
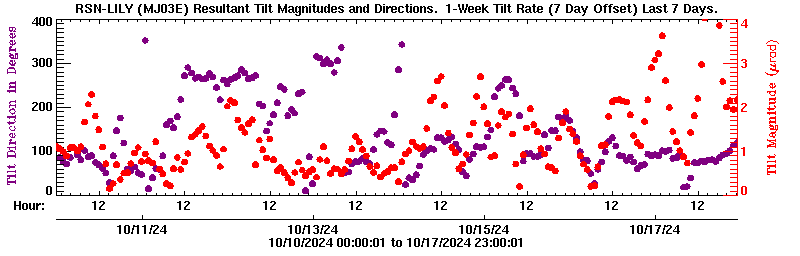
Plot 13: Resultant tilt magnitude (red) and direction (purple) over the last 7 days - RELATIVE TO 1 WEEK EARLIER.
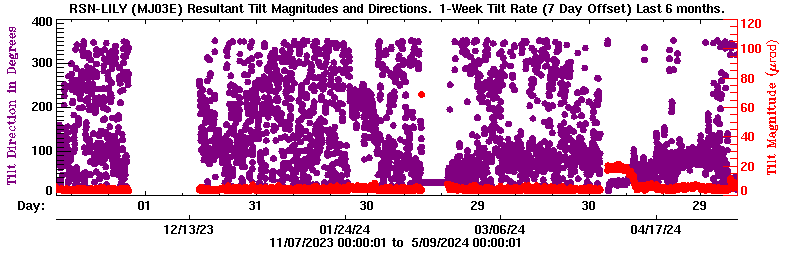
Plot 14: Resultant tilt magnitude (red) and direction (purple) over the last 6 months - RELATIVE TO 1 WEEK EARLIER.
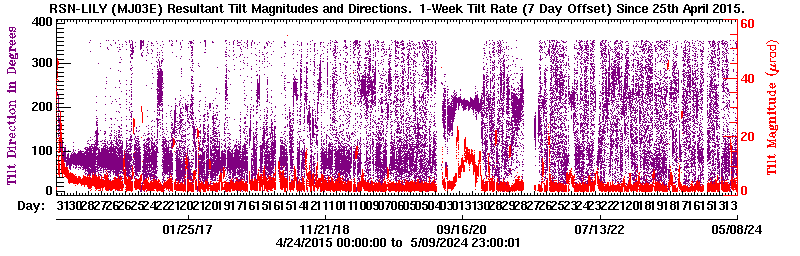
Plot 15: Resultant tilt magnitude (red) and direction (purple) since 25 April 2015 - RELATIVE TO 1 WEEK EARLIER.
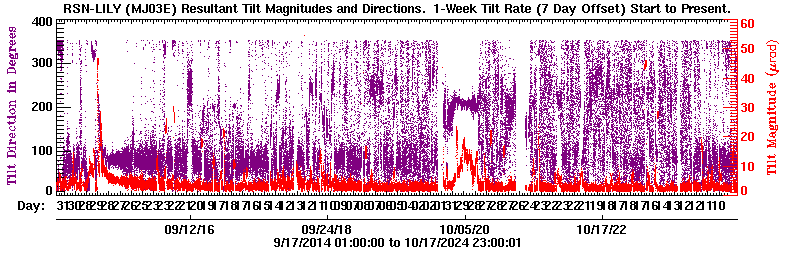
Plot 16: Resultant tilt magnitude (red) and direction (purple) over the entire record - RELATIVE TO 1 WEEK EARLIER.
More information
National Science Foundation | The Ocean Observatories Initiative | Cabled Array Observatory
Required OOI disclaimer: This is provided as pre-commissioned data intended for scientific use, and is subject to the OOI Data Policy. This data has not been through Quality Assurance checks.
Required NSF disclaimer: This material is based upon work supported by the National Science Foundation. Any opinions, findings, and conclusions or recommendations expressed in this material are those of the author(s) and do not necessarily reflect the views of the National Science Foundation.