Realtime data from BOTPT-A304-MJ03B - ASHES Vent Field
PAGE 2 - ENGINEERING DATA
This page displays plots of near-real-time data (updated every 20 minutes) from one of four BPR/Tilt (BOTPT) instruments at Axial Seamount, part of the National Science Foundation's (NSF) Ocean Observatories Initiative (OOI) Cabled Array seafloor observatory, operated by the University of Washington. The BOTPT instruments were built by NOAA's Pacific Marine Environmental Lab (PMEL) and Oregon State University (OSU). The BPR/Tilt instruments have 4 sensors: 1) a nano-resolution bottom pressure recorder (NANO), 2) a high-resolution tiltmeter (LILY), 3) a low-resolution tiltmeter (IRIS) , and 4) a coarse-resolution tiltmeter (HEAT). The dates/times in the plots below are in GMT (+8 hrs of local PST, or +7 hrs of PDT time on the US west coast). NOTE: THIS INSTRUMENT WAS DEPLOYED AND THEN POWERED UP ON AUGUST 15, 2017 (~3 years later than the other 3 instruments).
LINK TO PAGE WITH PRIMARY DATA PLOTS
LINK BACK TO PAGE WITH MAPS AND OTHER INSTRUMENTS
Bottom Pressure Recorder (NANO-BPR)
The NANO-BPR precisely measures the pressure of
the overlying ocean. The raw BPR pressure data are converted to depth (blue) and include the ocean tides.
After subtracting predicted tides, the difference (red)
shows vertical movements of the seafloor and other residual signals. Separate plots below show (1) the last 7 days of pressure data, (2) the last 6 months of pressure data, (3) data since the 2015 eruption, and (4) the entire OOI time-series, all with tides.
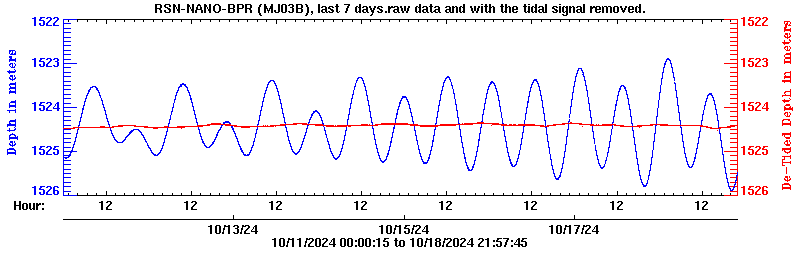
Plot 1: NANO-BPR pressure data showing equivalent seafloor height (in meters), with and without tides, over the last 7 days.
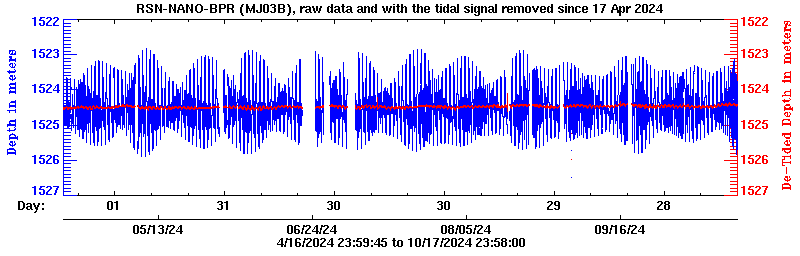
Plot 2: NANO-BPR pressure data showing equivalent seafloor height (in meters), with and without tides, over the last 6 months.ONLY UPDATED ONCE PER DAY.
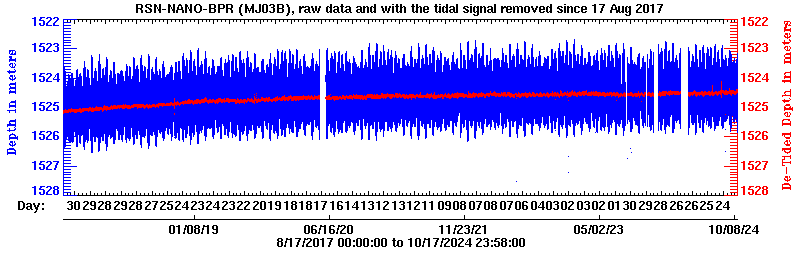
Plot 3: NANO-BPR pressure data showing equivalent seafloor height (in meters), with and without tides, over the entire record. ONLY UPDATED ONCE PER DAY.
Low-resolution tiltmeter (IRIS)
A low-resolution tiltmeter (IRIS) is needed to put the high-resolution tilt measurements (LILY) into context. This instrument measures the tilt less precisely than the LILY tiltmeter, but it has a much larger dynamic range. Below are plots of X- and Y-tilt without temperature, followed by similar plots with temperature.
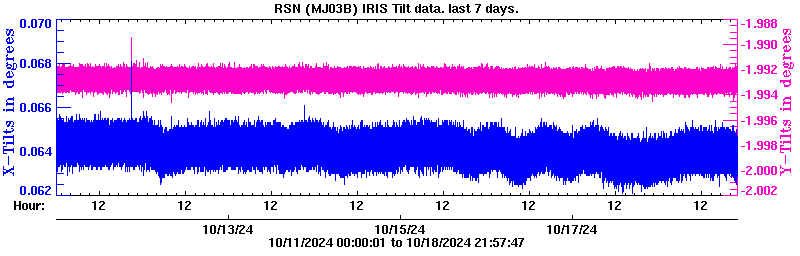
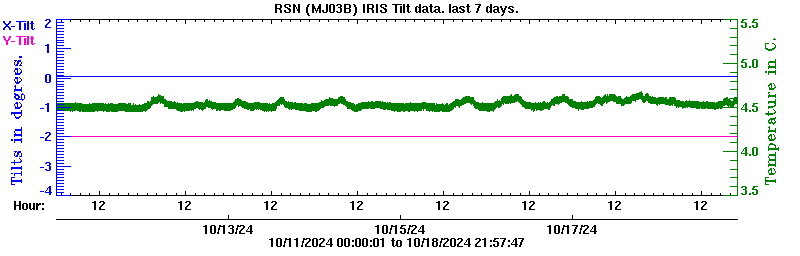
Plot 4: X-axis (left, blue) and Y-axis (right, pink) low-resolution IRIS tilts (in degrees), over the last 7 days.
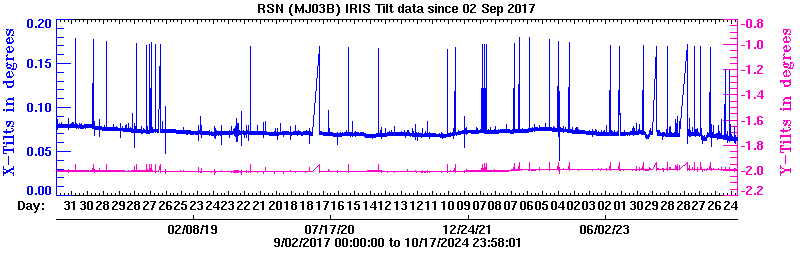
Plot 5: X-axis (left, blue) and Y-axis (right, pink) low-resolution IRIS tilt (in degrees), over the entire record. ONLY UPDATED ONCE PER DAY.
Plot 6: X-axis and Y-axis low-resolution IRIS tilt (in degrees) and temperature (C), over the last 7 days.
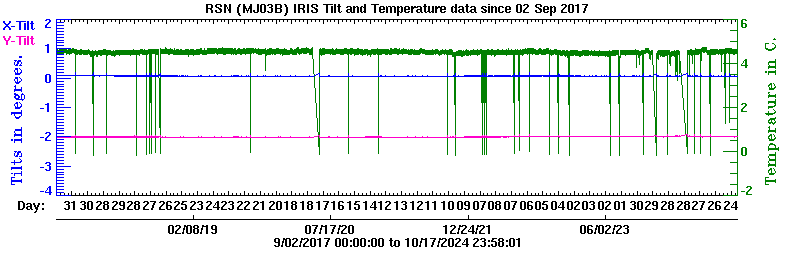
Plot 8: X-axis and Y-axis low-resolution IRIS tilt (in degrees) and temperature (C), over the entire record. ONLY UPDATED ONCE PER DAY.
Coarse-resolution tiltmeter (HEAT)
A coarse-resolution tiltmeter is needed to put the higher-resolution tilt measurements into context. This instrument measures the tilt to the nearest degree (a million times less precise than the LILY tiltmeter), but it has a much larger dynamic range, so it shows us the gross orientation of the instrument on the seafloor. The data from this low-resolution tiltmeter are not expected to change with time, but we plot them here anyway.
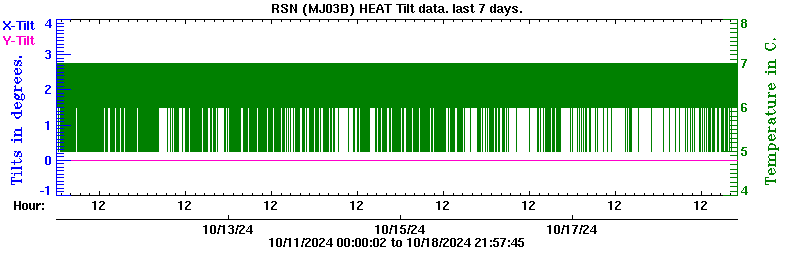
Plot 9: X-axis and Y-axis low-resolution tilt (in degrees) and temperature (C), over the last 7 days.
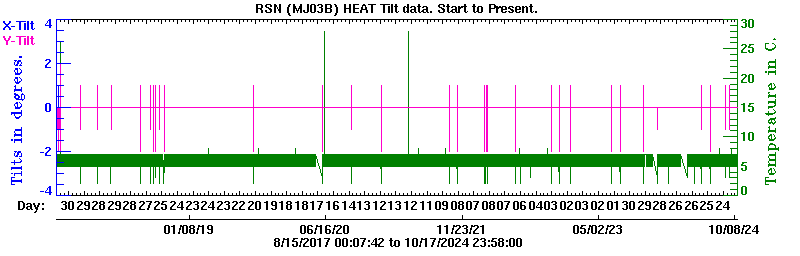
Plot 10: X-axis and Y-axis low-resolution tilt (in degrees) and temperature (C), over the entire record. ONLY UPDATED ONCE PER DAY.
More information
National Science Foundation | The Ocean Observatories Initiative | Cabled Array Observatory
Required OOI disclaimer: This is provided as pre-commissioned data intended for scientific use, and is subject to the OOI Data Policy. This data has not been through Quality Assurance checks.
Required NSF disclaimer: This material is based upon work supported by the National Science Foundation. Any opinions, findings, and conclusions or recommendations expressed in this material are those of the author(s) and do not necessarily reflect the views of the National Science Foundation.