High-resolution
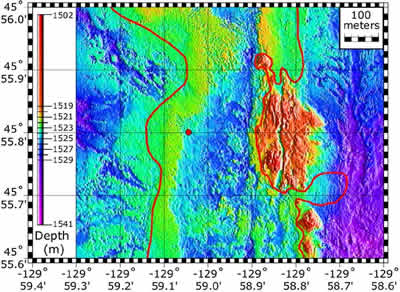
bathymetric map of the rumbleometer site
Version 2.0


 page
34 of 39
page
34 of 39
|
High-resolution
bathymetric map of the rumbleometer site
|
|
|
| This is real bathymetry collected by ROPOS over the rumbleometer site (after the 1998 eruption). Warm colors are shallower and cool colors are deeper. The solid red line indicates the edges of the 1998 lava flow. The red dot is the rumbleometer's location. A full screen view follows. |
|
Version 2.0
|