| What
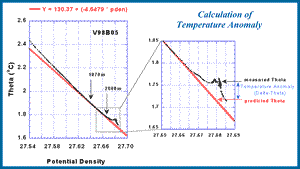
is a Temperature Anomaly?
Hydrothermal
plumes are detected and mapped by measuring the intensity and distribution
of heat, particles or other chemical tracers that are introduced to the
ocean by hydrothermal vents. The practical determination of these anomalies
is calculated as the difference between plume values and ambient values
at points of equal density. In the deep ocean, there is usually a linear
relationship between potential temperature (Theta) or salinity with potential
density, and an equation can be fit to describe this relationship. The
example shown below
The above example is from the Northeast Pacific Ocean. Comparable analyses can be done for other areas of the Pacific as well, however, in the Atlantic Ocean this results in negative temperature anomaly values because in that part of the world salinity decreases with depth and the neutrally buoyant plume is actually colder and fresher than ambient seawater at that density. Total heat released by seafloor sources are proportional to integrals of water column anomalies, but further corrections must be made to get accurate estimates of the total heat actually input to the ocean. See the references listed below for further reading. What is a Particle Anomaly?
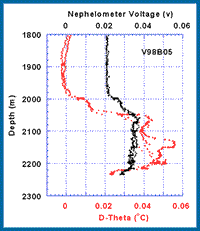
The particle anomalies detected by optical sensors are proportional to the total suspended matter determined by gravimetric methods, but the response of optical sensors is affected by particle characteristics such as particle size and chemical composition. (See Baker, E.T. and J.W. Lavelle (1984): The effect of particle size on the light attenuation coefficient of natural suspensions. Journal of Geophysical Research, 89(C5), 8197-8203) and (paper in progress)). The figure above shows how strongly correlated temperature anomaly (red) and optical signal (black) are. Temperature and particle anomalies together are strong determinants of hydrothermal plumes and effectively define the intensity and distribution of hydrothermal plumes. Plumes without an optical signal are rare. Sometimes the temperature anomaly is difficult to calculate using the procedure described above, such as in the Atlantic where neutrally buoyant hydrothermal plumes are colder and fresher than ambient seawater at the same density, or in shallow water where the Theta-potential density relationship is more variable and nonlinear. Where calculation of temperature anomaly is not practical, plume detection and mapping may depend entirely on measurements of optical anomalies (i.e. particles) or hydrothermal chemical tracers such as iron, manganese, helium, or methane.
Temperature Anomaly references: Lupton, J.E., J.R. Delaney, H.P. Johnson, and M.K. Tivey (1985): Entrainment and vertical transport of deep-ocean water by buoyant hydrothermal plumes. Nature, v. 316, p. 621-623. Baker, E.T., C.R. German, and H. Elderfield (1995): Hydrothermal plumes over spreading-center axes: Global distributions and geological inferences. In Seafloor Hydrothermal Systems: Physical, Chemical, Biological, and Geological Interactions, S. Humphris, R. Zierenberg, L. Mullineaux, and R. Thomson (eds.), Geophysical Monograph 91, American Geophysical Union, Washington, D.C., 47-71. Lupton, J.E. (1995): Hydrothermal plumes: Near and far field. In Seafloor Hydrothermal Systems: Physical, Chemical, Biological, and Geological Interactions, S. Humphris, R. Zierenberg, L. Mullineaux, and R. Thomson (eds.), Geophysical Monograph 91, American Geophysical Union, Washington, D.C., 317-346. McDuff, R.E. (1995): Physical dynamics of deep-sea hydrothermal plumes. In Seafloor Hydrothermal Systems: Physical, Chemical, Biological, and Geological Interactions, S. Humphris, R. Zierenberg, L. Mullineaux, and R. Thomson (eds.), Geophysical Monograph 91, American Geophysical Union, Washington, D.C., 357-368. Lavelle, J.W., E.T. Baker, and G.J. Massoth (1997): On the calculation of total heat, salt and tracer fluxes from ocean hydrothermal events. Deep-Sea Res. (Submitted). Baker, E.T. and J.W. Lavelle (1984): The effect of particle size on the light attenuation coefficient of natural suspensions. Journal of Geophysical Research, 89(C5), 8197-8203. Baker, E.T., D.A. Tennant, R.A. Feely, G.T. Lebon, and S.L. Walker (1998): The effect of particle size and composition on optical backscattering measurements of natural marine suspensions. (In preparation) Walker, S.L., and E.T. Baker (1988): Particle-size distributions within hydrothermal plumes over the Juan de Fuca Ridge. Marine Geology, 78, 217-226. |


