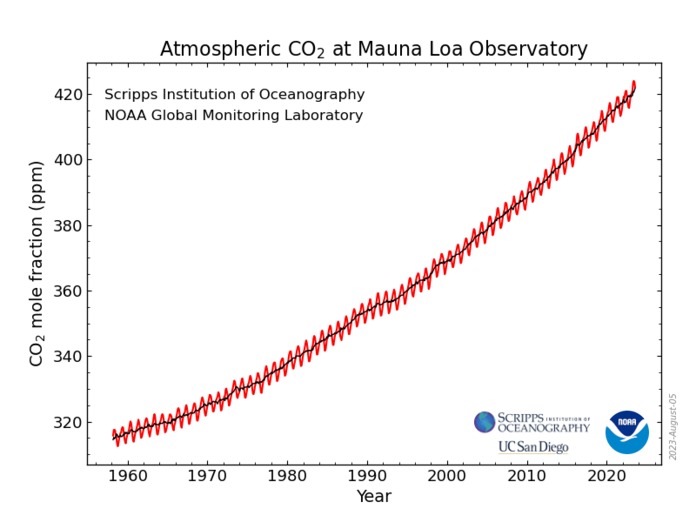
Measurements of atmospheric CO2 in areas well away from local fossil fuel sources clearly show that carbon dioxide (CO2) is increasing. For example, the graph above shows monthly (red line) and annual (black line) average atmospheric CO2 measurements from the top of Mauna Loa on the big island of Hawaii. Data are reported as a dry mole fraction defined as the number of molecules of carbon dioxide divided by the number of molecules of dry air multiplied by one million (ppm).
The measurements were initially made by Dr. David Keeling at Scripps Institution of Oceanography starting in March 1958. Dr. Pieter Tans at NOAA's Global Monitoring Laboratory (GML) began making CO2 measurements in May of 1974, and they have run in parallel with those made by Scripps since then. Data from measurements made at a number of locations around the world document the rise in global atmospheric CO2 with time. Measurements made in urban areas (like Seattle) or other locations close to fossil fuel emission sources will reflect a combination of the rising global CO2 concentrations and CO2 added from local emissions. To see the latest Mauna Loa trends visit the GML Mauna Loa website.
Figure provided by P. Tans (NOAA/ESRL), text provided by C. Sabine (NOAA/PMEL).
