Buoy")

Related Stories


CCE2
California Current Ecosystem Mooring 2 (CCE2) (34.324°N, 120.814°W)
A MAPCO2TM system was deployed on a California Current Ecosystem Interdisciplinary Biogeochemical Mooring on January, 2010. This mooring is part of a multi-investigator, multi-disciplinary project with two surface moorings in the California Current (the other is CCE-1) with a sensor suite covering biological, chemical, and physical oceanography as well as meteorology. The objectives are to resolve event-scale ocean phenomena and to understand linkages between changes in the physical-chemical environment and the responses of ocean biota. This project is closely coordinated with other projects off of Southern California such as CalCOFI, LTER, and CORC.
CCE-2 is positioned on the shelf break on the California Coast, where localized upwelling processes are at their maximum. For more information about the buoy and other sensors, please visit UCSD's California Current Ecosystem Data Page.
On March 24, 2012, a surface seawater pH sensor was added to the CCE2 mooring. By measuring pH in addition to pCO2, we are able to more accurately and precisely study the changes associated with ocean acidification. All seawater pH observations are shown in the second figure below. This project is supported by NOAA's Ocean Acidification Program.
Data availability: archived at NCEI.
Plots of surface water and atmospheric CO2, surface water pH, and calculated aragonite saturation state (click+drag to zoom):
Aragonite saturation state is calculated from measured surface seawater pCO2 and total alkalinity proxies (Frazeo et al., 2024 Unpublished) using PyCO2SYS as described in Sutton et al., 2016.
Monthly climatology of surface seawater aragonite saturation state (Ω) and pH:
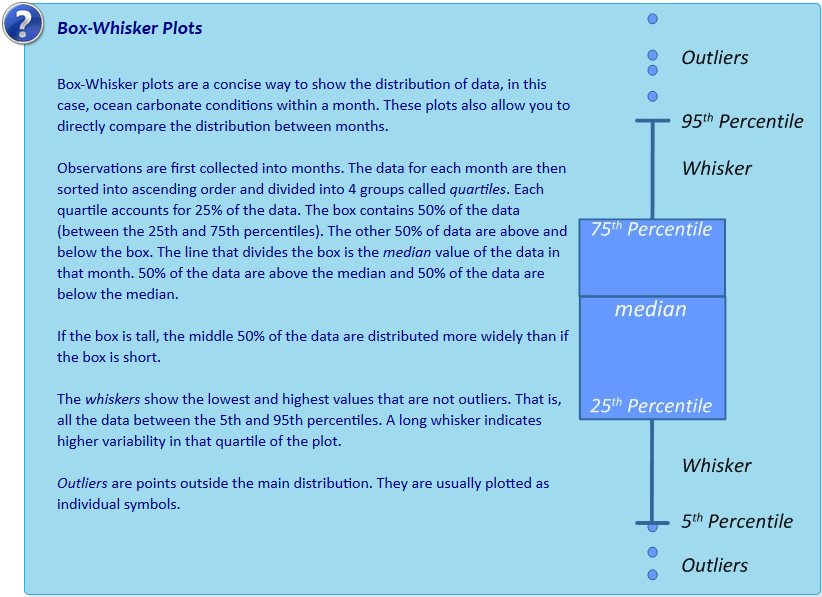
Interactive box plots below are observations binned by month as described in Sutton et al., 2016. Pie charts represent % of observations within each month that fall below the adjustable line. This adjustable line is meant to provide a tool for assessing potential biological thresholds. For example, setting the line to Ωaragonite of ~2.0 would assess monthly exposure of Pacific oyster larvae to sub-lethal chronic effects in regions where these larvae occur naturally or in hatcheries (see studies here and here).