Hi Jagadish,
Thanks for the tip. To summarize what I did:
define axis/x =-15:50:0.03333 xgtopo ! Define axis along my x-section
let height1 = ht[x=-15:50,y=-8:13@ave, gx=xgtopo]
let height2 =height1*0
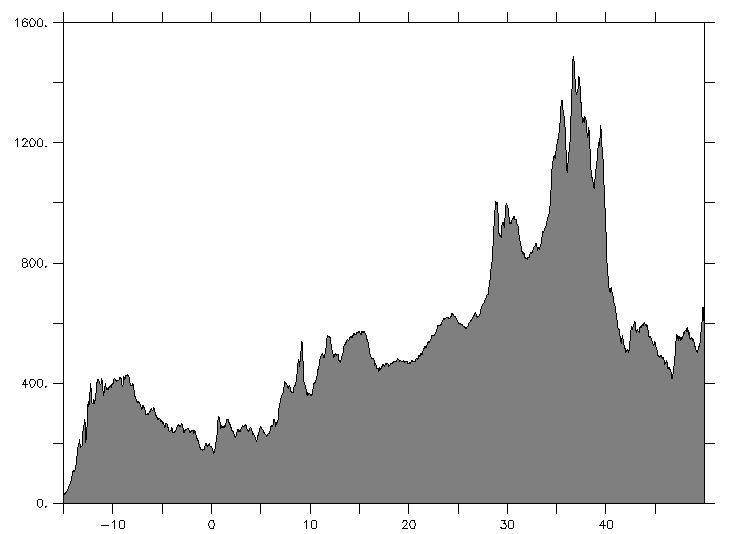
GO fill_between POLY/OVER/NOLABEL/PALETTE=gray height1 xgtopo height2
plot/ov/color =black height1
Then it gives the attached figure.
Best,
Fisseha Berhane
PhD student
Johns Hopkins University
Baltimore, Maryland
--- On Sat, 2/18/12, jagadish karmacharya <j_karmacharya@xxxxxxxxx> wrote:
From: jagadish karmacharya <j_karmacharya@xxxxxxxxx>
Subject: Re: [ferret_users] shaded plot
To: "FISSEHA G. BERHANE" <fishcivilmu@xxxxxxxxx>
Cc: "ferret" <ferret_users@xxxxxxxx>
Date: Saturday, February 18, 2012, 6:23 AM
Hi,
Is this useful?
http://ferret.pmel.noaa.gov/Ferret/faq/fill-between-two-curves Jagadish
From: FISSEHA G. BERHANE <fishcivilmu@xxxxxxxxx>
To: ferret <ferret_users@xxxxxxxx>
Sent: Saturday, February
18, 2012 2:33 AM
Subject: [ferret_users] shaded plot
Hi dear ferreters,
I am looking at topography along a x-section to overlay over wind vectors which are interpolated below the surface so as to mask the winds below the surface out. My elevation along the topography is one dimensional, just time series of elevation values along the cross-section. When I use shade it gives error message that it is not 2-D and when I use plot, it does not shade it. In the attached figure, I want the region below the surface to be shaded.
Your help highly appreciated
Fisseha Berhane
PhD student
Johns Hopkins University
Baltimore, Maryland |
|