September 2008 followed 2007 as the second sequential year with an extreme summer Arctic sea ice extent minimum. Although such a sea ice loss was not indicated until much later in the century in the Intergovernmental Panel on Climate Change 4th Assessment Report, many models show an accelerating decline in the summer minimum sea ice extent during the 21st century. Using the observed 2007/2008 September sea ice extents as a starting point, we predict an expected value for a nearly sea ice free Arctic in September by the year 2037. The first quartile of the distribution for the timing of September sea ice loss will be reached by 2028. Our analysis is based on projections from six IPCC models, selected subject to an observational constraints. Uncertainty in the timing of a sea ice free Arctic in September is determined based on both within-model contributions from natural variability and between-model differences.
The Arctic is changing faster than anticipated in the Intergovernmental Panel on Climate Change Fourth Assessment Report (IPCC AR4) [Intergovernmental Panel on Climate Change (IPCC), 2007; Serreze et al., 2007; Stroeve et al., 2007]. By September 2008 Arctic sea ice reached a new milestone: two sequential years of extreme summer minimum sea ice coverage during the satellite era. Monthly mean September Sea ice extent, which is the area with sea ice concentration more than 15%, was 4.7 M km2 in 2008 following the record minimum of 4.3 M km2 set in 2007 according to the National Snow and Ice Data Center (NSIDC) (http://nsidc.org/arcticseaicenews/) [Comiso et al., 2008; Stroeve et al., 2008]. The average of the two minima is 37% below the climatology of sea ice extent for the period of 1980–1999. Such sea ice minima open up more than 60% of the Arctic Ocean to increased solar and longwave absorption near the end of summer. The September 2007/8 sea ice extent estimates from the Hadley Centre sea ice concentration analysis (HadISST) at a 1° Latitude/Longitude resolution were slightly higher at 4.6/5.2 M km2 (http://www.metoffice.gov.uk/hadobs/hadisst/). We use the "observed" value of 4.6 M km2 (34% below climatology) based on HadISST throughout this article for comparisons to model hindcasts. This new record of Arctic sea ice minimum at the end of summer melt season is occurring at least 30 years earlier than the expected value for the timing of sea ice loss derived from climate models provided for the IPCC AR4 [Zhang and Walsh, 2006; Stroeve et al., 2007; Overland and Wang, 2007]. Due to the recent loss of sea ice, the 2005–2008 autumn (October–November) central Arctic surface air temperatures were greater than 5° C above their climatology, a magnitude similar to the projected autumn temperature increase for 2070 by IPCC AR4 [Chapman and Walsh, 2007; Overland et al., 2008; Schweiger et al., 2008a].
Climate models provide multiple simulations (referred to as ensemble members) to distinguish uncertainties due to natural variability, caused by internal instabilities in the climate system, from long term trends due to external anthropogenic forcing caused by increases in greenhouse gases. For example, when IPCC AR4 models (now phase 3 of the Coupled Model Intercomparison Project, CMIP3) were initialized with slightly different initial conditions, the details of the time trajectories of each ensemble member were substantially different [Wang et al., 2007]. Among many possible trajectories, the real world will manifest as only one realization drawn from a range of possible future climate scenarios. Projections from CMIP3 models were also based upon different future emissions scenarios; these were labeled as "low" (B1), "medium" (A1B) and "high" (A2) [Nakićenović and Swart, 2000].
A difficulty with the AR4 is there are too few ensemble members from quality climate models to obtain a frequency distribution of possible future extreme events. Compared to the range of CMIP3 model projections, the one climate realization that we are living through appears to be a fast track for September sea ice loss. The recent reduction of sea ice extent is consistent with a combination of an emerging greenhouse gas contribution, wind-driven variability in sea ice circulation, a sequence of warm years beginning in the late 1990s, and non-linear feedbacks from decreased albedo and anomalously warm sea temperatures in regions of low sea ice concentration [Rigor and Wallace, 2004; Serreze and Francis, 2006; Nghiem et al., 2007; Ogi and Wallace, 2007; Maslanik et al., 2007; Gascard et al., 2008; Schweiger et al., 2008b].
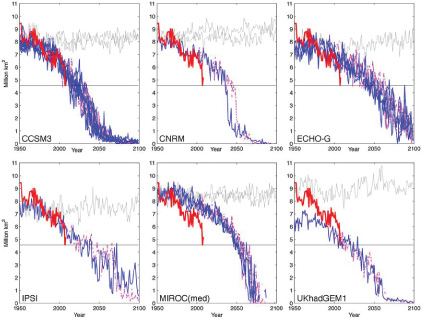
Many projections from CMIP3 models show an increased rate of September sea ice reduction when the sea ice extent is near the present 4.6 M km2 mark, compared to the rate of sea ice reduction found before 2000 [Holland et al., 2006; Stroeve et al., 2007]; also see the future sea ice losses projected by the CCSM3, CNRM and MIROC(med) models in Figure 1. This change in rate of sea ice reduction supports our further investigation of the sea ice projections from CMIP3 models to estimate the potential timing of a summer sea ice free Arctic, given the conditional state that an observed September sea ice extent of 4.6 M km2 has already been reached.
Fig. 1. September sea ice extent as projected by the six models that simulated the mean minimum and seasonality with less than 20% error of the observations. The colored thin line represents each ensemble member from the same model under A1B (blue solid) and A2 (magenta dashed) emission scenarios, and the thick red line is based on HadISST analysis. Grey lines in each panel indicate the time series from the control runs (without anthropogenic forcing) of the same model in any given 150 year period. The horizontal black line shows the ice extent at 4.6 M km2 value, which is the minimum sea ice extent reached in September 2007 according to HadISST analysis. All six models show rapid decline in the ice extent and reach ice-free summer (<1.0 M km2) before the end of 21st century.
Confidence that climate models provide credible quantitative projections of future climate is build upon their demonstrated ability to reproduce observed features of recent climate [IPCC, 2007; Gerdes and Köberle, 2007]. It is therefore important to apply an observational constraint on the CMIP3 models, and eliminate "outlier" models from further consideration. Inspired by Knutti et al. [2006], we require that models simulate the seasonal cycle and the mean of September sea ice extent to within ±20% of HadISST analysis for the period of 1980–1999 (Figure S1 of the auxiliary material).1 Reproducing the correct magnitude of the seasonal cycle of sea ice extent is one way of demonstrating the models sensitivity to changes in external forcing, e.g., solar insolation. The September mean sea ice extent is an efficient constraint to eliminate models with systematic biases. Our constraints are based on comparisons to the HadISST sea ice concentration analysis, which was made more homogeneous by compensating satellite microwavebased sea ice concentrations for the impact of surface melt effects on retrievals in the Arctic [Rayner et al., 2003]. The combination of the seasonal cycle and mean conditions is an improved constraint relative to previous studies [Stroeve et al., 2007; Overland and Wang, 2007]. The selection process not only reduces the range of uncertainty in the future projections by these models, but also shows that models with reasonable seasonal cycle relative to observations project a faster future decline of September sea ice extent (Figure S2).
Applying the observational constraints results in the retention of 6 of 23 CMIP3 models; their projected September sea ice extents under the IPCC A1B and A2 emission scenarios (colored thin lines in each plot) are shown in Figure 1. Using both scenarios provides at least two ensemble members per model to account for the influence of natural variability. The justification for combining the two emissions scenarios is that the difference in CO2 concentrations before 2050 between the A1B and A2 emissions scenarios is small. The A1B scenario actually has a slightly faster CO2 emission growth rate during this early period [IPCC, 2001, Figure 5]. Although an evaluation of why some models perform better than others is difficult [Gleckler et al., 2008], we do note that among the six selected models, three (CCSM3, CNRM-CM3 and UKMO-HadGEM1) include a multiple sea ice thickness distribution as part of a sophisticated sea ice physics and dynamics package, a feature only present in five of the current generation of the CMIP3 models [Zhang and Walsh, 2006].
All ensemble members from the six models show sea ice extent reaching current value (4.6 M km2) sometime in the 21st century with rapid declines afterward, similar to the observed time series (thick red line). Contrasting these sea ice extent projections with those from control runs (i.e., without anthropogenic forcing, grey lines) clearly shows that a necessary factor for the future decline of summer sea ice extent is the presence of external anthropogenic forcing. The different timing for reduction of sea ice extent in different model projections is a consequence of natural variability in the simulated climate and the differences and limitations of current sea ice models. There is little difference in the projected trajectories of sea ice extent between the A1B (blue solid line) and A2 (magenta dashed line) emission scenarios, especially before 2050.
In Figure 2 we show the time interval for sea ice extent to be reduced from 4.6 to 1.0 M km2 for all ensemble members of the six models under both A1B and A2 emission scenarios. The 1.0 M km2 limit is chosen because models suggest that the regions north of Greenland/Canada will retain some sea ice in the future even though the Arctic can be considered as "nearly sea ice free" at the end of summer. The median duration interval for the sea ice to reduce from 4.6 to 1.0 M km2 is 30 years with quartiles at 21 and 41 years. The overall mean interval is 32 years. This provides an expected value (based on the median) for a September nearly sea ice free Arctic in the year 2037. The first quartile of the distribution for the timing of a September sea ice loss will be reached in 2028. The uncertainty in future timing for a September sea ice free Arctic is strongly influenced by the chaotic nature of natural variability. This uncertainty in timing is reflected in the wide range of time intervals for sea ice loss from the set of ten CCSM3 model ensemble members, which span from 15 to 42 years.
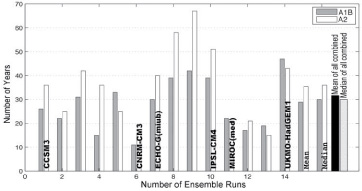
Fig. 2. Estimated number of years for sea ice extent to drop from the current value (4.6 M km2) to less than 1.0 M km2 (summer ice free Arctic) based on six models under IPCC emission scenarios A1B (grey) and A2 (white). Each bar represents one ensemble member from each model. The model name is listed on the far-left bar if multiple ensemble members are provided. The far right bars show the model mean (black) and median (hatched) based on all ensemble members combined from both emissions scenarios.
Our expected time frame of ∼30 years to reach a September sea ice free Arctic is based on current conditions in the Arctic and information from the currently available set of fully coupled CMIP3 atmosphere-ocean-ice General Circulation Models (GCMs). Confidence in the reduced set of six models comes from their basis in established physical laws and their ability to simulate 20th century seasonality in Arctic sea ice extent. While our approach is a less than an ideal assumption compared to re-running the CMIP3 models with new initial conditions, we can justify transposing the model sea ice declines to earlier years as follows: the present day September Arctic sea ice cover has already decreased to 4.6 M km2, and all the six models show rapid sea ice declines after this sea ice extent threshold is reached. The basic physical processes of September sea ice reduction would also apply to re-running GCM models with new initial conditions: once there is considerable open water in the summer central Arctic, albedo feedback and ocean-atmosphere heatflux feedback are major and rapid contributors to continued sea ice reductions.
In addition to the reduction in sea ice extent, sea ice thickness will also decrease as more areas are replaced by first year ice. Figure 3 displays the spatial ice thickness fields in the Arctic averaged over the six models. In the year when the six models have their September sea ice extent reach 4.6 M km2, much of the central Arctic is covered by sea ice less than 2.5 m in March (Figure 3a). By September much of the remaining sea ice is less than 1.2 meters thick in the central Arctic (Figure 3b). At the time of a nearly sea ice-free Arctic (1.0 M km2 in September) about 30 years later, March sea ice is thinner, with much of the area being covered by sea ice less than 2.0 m (Figure 3c). The distribution of remaining September sea ice for our "nearly sea ice free" definition of 1.0 M km2 is shown in Figure 3d; the region north of the Canadian Archipelago and Greenland remains a sea ice refuge.
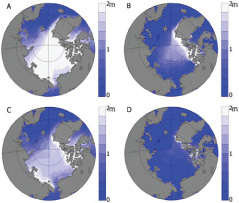
Fig. 3. Mean sea ice thickness for (left) March and (right) September based on ensemble members from six models under A1B emissions scenario. (a and b) Year when the September ice extent reached 4.6 M km2 by these models and (c and d) year when the Arctic reached nearly sea ice conditions (less than 1.0 M km2) in September, i.e., ice free summer.
The two sequential years of extreme low sea ice extent at the end of summer in 2007 and 2008 are indeed evidence that the Arctic may be on a fast track for increased September sea ice reduction over the next 30 years. A consequence will be increased autumn air temperatures due to heat released by the ocean, which is absorbed during the summer as a result of reduced sea ice coverage. Reduction of September sea ice extent during single year events appears to be an important feature in both the 2007 observation and in certain ensemble members from CMIP3 models (Figure 1). Ensemble members for simulations without anthropogenic forcing (control runs) indicate that anthropogenic forcing is a necessary condition for future major sea ice loss to occur. However, the influence of natural variability in the form of both recent warm years and wind-driven sea ice drift supports the conclusion that the observed reduction of September 2007 sea ice occurred many decades earlier than the expected timing of sea ice reduction under the influences of greenhouse gases forcing alone, i.e., the mean of all model ensembles projections (Figure S2).
The first quartile of the distribution of time intervals for sea ice extent to drop from 4.6 to 1.0 M km2 implies that a sea ice free Arctic in September may occur as early as the late 2020s, based on projections by six CMIP3 models selected for their ability to simulate the current conditions of sea ice extent. To reach these conclusions it is important to apply the observational constraints that the models produce a reasonable mean and seasonality of sea ice extent. Further confidence is based on three of the selected models having sophisticated sea ice physics packages. Sea ice thickness, while crudely represented in most CMIP3 models, show reductions in summer (September) and winter (March) over the next 30 years. The uncertainty in timing of a summer sea ice free Arctic is largely due to both within-model contributions from natural variability and between-model differences.
We appreciate the support of NOAA Arctic Research of the Climate Program Office and discussions on this topic with many Arctic colleagues. This publication is partially funded by the Joint Institute for the Study of the Atmosphere and Ocean (JISAO) under NOAA Cooperative Agreement NA17RJ1232, contribution 1605. PMEL contribution 3261.We also like to thank Qiang Fu for his comments and suggestions on the manuscript. We acknowledge the modeling groups, the Program for Climate Model Diagnosis and Intercomparison (PCMDI) and the World Climate Research Programme (WCRP)'s Working Group on Coupled Modelling (WGCM) for their roles in making available the WCRP CMIP3 multi-model dataset. We would like to thank the two anonymous reviewers and the editor for their valuable comments. Support of this dataset is provided by the Office of Science, U.S. Department of Energy.
Chapman, W. L., and J. E. Walsh (2007), Simulations of Arctic temperature and pressure by global coupled models, J. Clim., 20, 609–632.
Comiso, J. C., C. L. Parkinson, R. Gersten, and L. Stock (2008), Accelerated decline in the Arctic sea ice cover, Geophys. Res. Lett., 35, L01703, doi:10.1029/2007GL031972.
Gascard, J.-C., et al. (2008), Exploring Arctic transpolar drift during dramatic sea ice retreat, Eos Trans. AGU, 89(3), doi:10.1029/2008EO030001.
Gerdes, R., and C. Köberle (2007), Comparison of Arctic sea ice thickness variability in IPCC Climate of the 20th Century experiments and in ocean-sea ice hindcasts, J. Geophys. Res., 112, C04S13, doi:10.1029/ 2006JC003616.
Gleckler, P. J., K. E. Taylor, and C. Doutriaux (2008), Performance metrics for climate models, J. Geophys. Res., 113, D06104, doi:10.1029/2007JD008972.
Holland, M. M., C. M. Bitz, and B. Tremblay (2006), Future abrupt reductions in the summer Arctic sea ice, Geophys. Res. Lett., 33, L23503, doi:10.1029/2006GL028024.
Intergovernmental Panel on Climate Change (IPCC) (2001), Climate Change 2001: The Scientific Basis. Contribution of Working Group I to the Third Assessment Report of the Intergovernmental Panel on Climate Change, edited by J. T. Houghton et al., 881 pp., Cambridge Univ. Press, Cambridge, U.K.
Intergovernmental Panel on Climate Change (IPCC) (2007), Climate Change 2007: The Physical Science Basis. Contribution of Working Group I to the Fourth Assessment Report of the Intergovernmental Panel on Climate Change, edited by S. Solomon et al., 996 pp., Cambridge Univ. Press, Cambridge, U.K.
Knutti, R., G. Meehl, M. R. Allen, and D. A. Stainforth (2006), Constraining climate sensitivity from the seasonal cycle in surface temperature, J. Clim., 19, 4224–4233.
Maslanik, J. A., C. Fowler, J. Stroeve, S. Drobot, J. Zwally, D. Yi, and W. Emery (2007), A younger, thinner Arctic ice cover: Increased potential for rapid, extensive sea-ice loss, Geophys. Res. Lett., 34, L24501, doi:10.1029/2007GL032043.
Nakićenović, N., and R. Swart (Eds.) (2000), Special Report on Emissions Scenarios. A Special Report of Working Group III of the Intergovernmental Panel on Climate Change, 599 pp., Cambridge Univ. Press, Cambridge, U.K.
Nghiem, S. V., I. G. Rigor, D. K. Perovich, P. Clemente-Colón, J. W. Weatherly, and G. Neumann (2007), Rapid reduction of Arctic perennial sea ice, Geophys. Res. Lett., 34, L19504, doi:10.1029/2007GL031138.
Ogi, M., and J. M. Wallace (2007), Summer minimum Arctic sea ice extent and the associated summer atmospheric circulation, Geophys. Res. Lett., 34, L12705, doi:10.1029/2007GL029897.
Overland, J. E., and M. Wang (2007), Future regional Arctic sea ice declines, Geophys. Res. Lett., 34, L17705, doi:10.1029/2007GL030808.
Overland, J. E., M. Wang, and S. Salo (2008), The recent Arctic warm period, Tellus, Ser. A, 60, 589–597.
Rayner, N. A., D. E. Parker, E. B. Horton, C. K. Folland, L. V. Alexander, D. P. Rowell, E. C. Kent, and A. Kaplan (2003), Global analyses of sea surface temperature, sea ice, and night marine air temperature since the late nineteenth century, J. Geophys. Res., 108(D14), 4407, doi:10.1029/2002JD002670.
Rigor, I. G., and J. M. Wallace (2004), Variations in the age of Arctic sea ice and summer sea-ice extent, Geophys. Res. Lett., 31, L09401, doi:10.1029/2004GL019492.
Schweiger, A. J., R. W. Lindsay, S. Vavrus, and J. A. Francis (2008a), Relationships between Arctic sea ice and clouds during autumn, J. Clim., 21, 4799–4810.
Schweiger, A. J., J. Zhang, R. W. Lindsay, and M. Steele (2008b), Did unusually sunny skies help drive the record sea ice minimum of 2007?, Geophys. Res. Lett., 35, L10503, doi:10.1029/2008GL033463.
Serreze, M. C., and J. A. Francis (2006), The arctic amplification debate, Clim. Change, 76, 241–264.
Serreze, M. C., M. M. Holland, and J. Stroeve (2007), Perspective on the Arctic's shrinking sea-ice cover, Science, 315, 1533–1536.
Stroeve, J., M. M. Holland, W. Meier, T. Scambos, and M. Serreze (2007), Arctic sea ice decline: Faster than forecast, Geophys. Res. Lett., 34, L09501, doi:10.1029/2007GL029703.
Stroeve, J., M. Serreze, S. Drobot, S. Gearheard, M. Holland, J. Maslanik, W. Meier, and T. Scambos (2008), Arctic sea ice extent plummets in 2007, Eos Trans. AGU, 89(2), doi:10.1029/2008EO020001.
Wang, M., J. E. Overland, V. Kattsov, J. E.Walsh, X. Zhang, and T. Pavlova (2007), Intrinsic versus forced variation in coupled climate model simulations over the Arctic during the twentieth century, J. Clim., 20, 1093–1107.
Zhang, X. D., and J. E. Walsh (2006), Toward a seasonally ice-covered Arctic ocean: Scenarios from the IPCC AR4 model simulations, J. Clim., 19, 1730–1747.
Return to Abstract