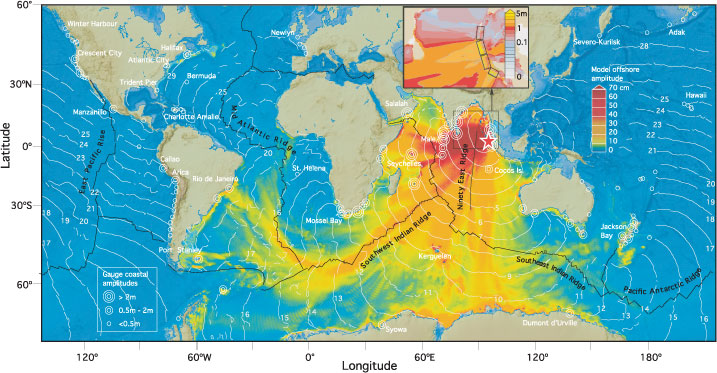
Fig. 1. Global chart showing energy propagation of the 2004 Sumatra tsunami calculated from MOST. Filled colors show maximum computed tsunami heights during 44 hours of wave propagation simulation. Contours show computed arrival time of tsunami waves. Circles denote the locations and amplitudes of tsunami waves in three range categories for selected tide-gauge stations. Inset shows fault geometry of the model source and close-up of the computed wave heights in the Bay of Bengal. Distribution of the slip among four subfaults (from south to north: 21 m, 13 m, 17 m, 2 m) provides best fit for satellite altimetry data and correlates well with seismic and geodetic data inversions.
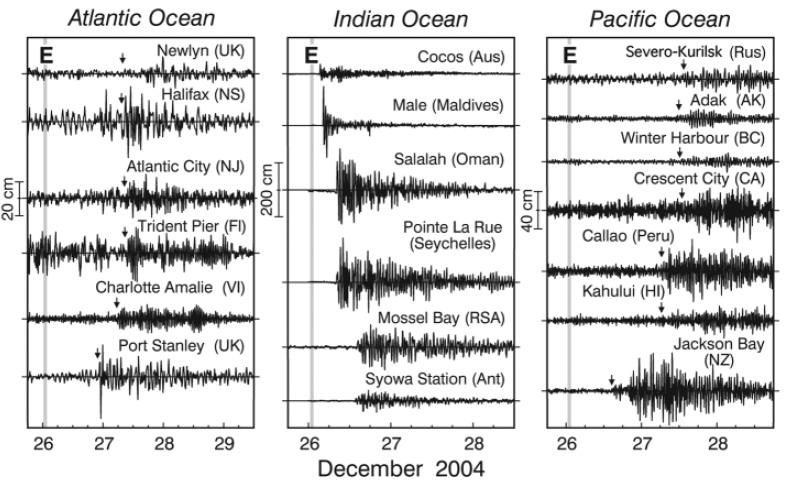
Fig. 2. Time series of tsunami wave heights (cm) as recorded at selected tide-gauge stations in the three major ocean basins. Arrows indicate first arrival of the tsunami.
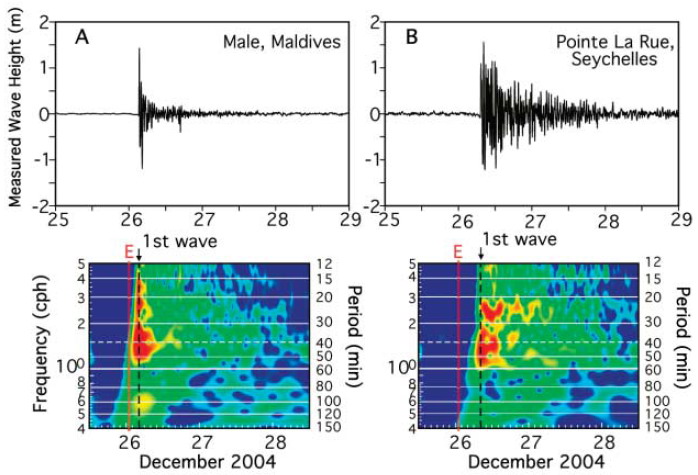
Fig. 3. Wavelet analysis of tsunami wave heights recorded by tide gauges at (A) Male, Maldives and (B) Pointe La Rue, Seychelles. Each plot shows the first 60 hours of the observed tsunami record and its corresponding wavelet decomposition (frequency/period versus time).
Return to Abstract