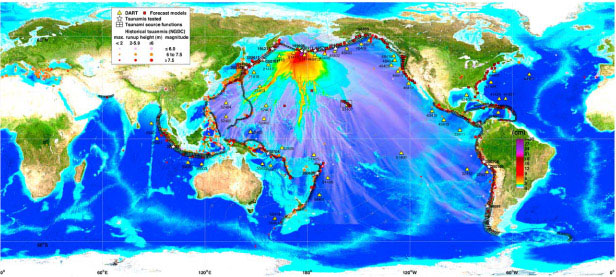
Fig. 1. Overview of the tsunami forecast system. Components of the system include DART systems (yellow triangles), precomputed tsunami source function database (black rectangles), and high-resolution forecast models (solid red squares). Colors show computed maximum tsunami amplitudes of the offshore forecast in cm using the 17 November 2003 Rat Islands tsunami as an example. Black contour lines indicate tsunami travel times in hours. Solid circles are historical tsunamis [National Geophysical Data Center, 2007].
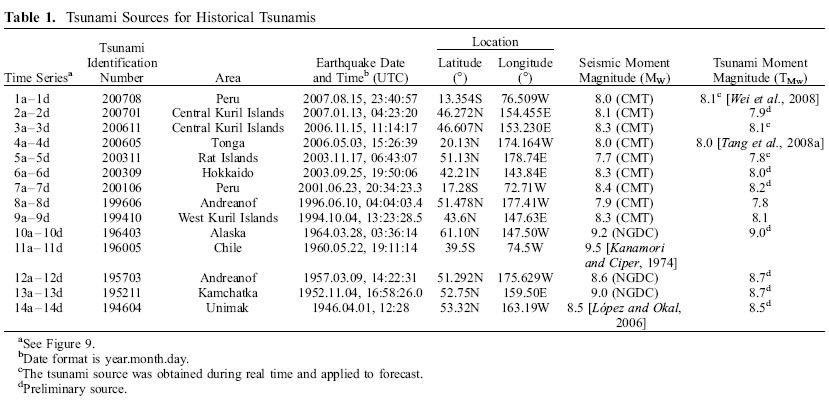
Table 1. Tsunami sources for historical tsunamis.
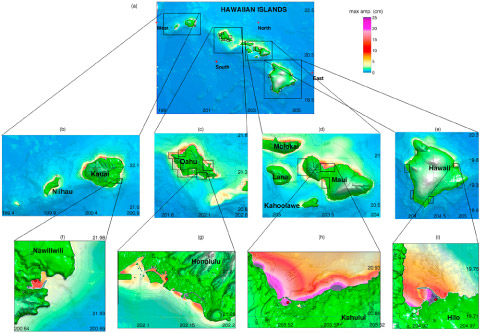
Fig. 2. Forecast model setups in Hawaii: (a) 2 arc min (∼3600 m) regional, (b–e) 12–18 arc sec (∼360–540 m) intermediate, and (f–i) 2 arc sec (∼60 m) nearshore grids for Nawiliwili, Honolulu, Kahului, and Hilo. Filled colors show the maximum tsunami amplitude in cm computed by the forecast models for the 17 November 2003 Rat Islands tsunami. Red dots, coastal tide stations; red crosses, offshore locations.
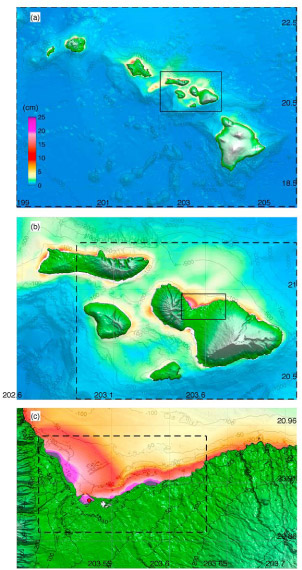
Fig. 3. Grid setup of the Kahului reference inundation model. The spatial resolutions are (a) 36 arc sec (∼1080 m), (b) 6 arc sec (∼180 m), and (c) 1/3 arc sec (∼10 m), respectively. Filled colors show the maximum amplitude in cm computed by the model for the 17 November 2003 Rat Islands tsunami. Solid lines, boundaries of the telescoping grids of the model; dashed lines, grid boundaries of the Kahului forecast model as in Figures 2a, 2d, and 2h.
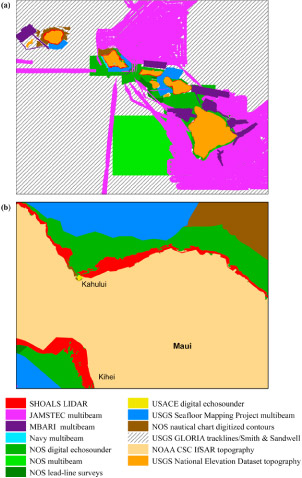
Fig. 4. Bathymetric and topographic data source overview. (a) Hawaiian Islands with 6 arc sec (∼180 m) resolution and (b) central Maui with 1/3 arc sec (∼10 m) resolution.
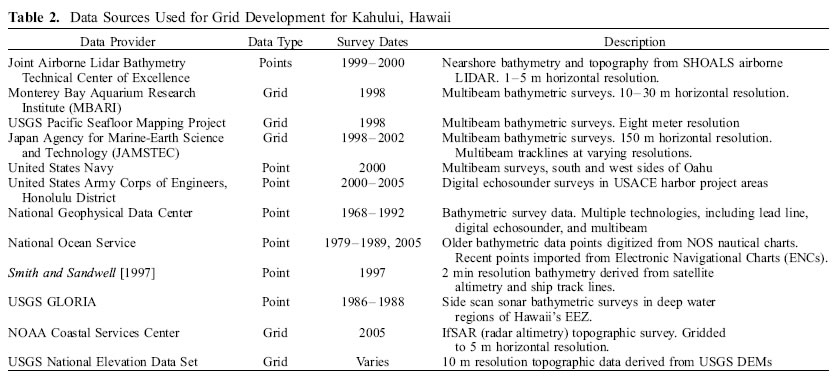
Table 2. Data sources used for grid development for Kahului, Hawaii.
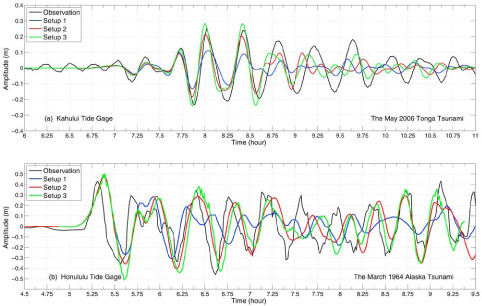
Fig. 5. Tsunami time series computed from different model setups at (a) Kahului tide gauge for the May 2006 Tonga tsunami and (b) Honolulu tide gauge for the March 1964 Alaska tsunami.
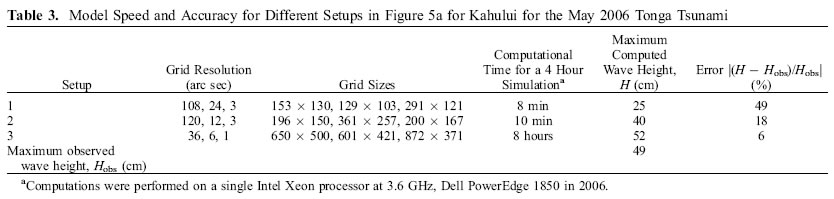
Table 3. Model speed and accuracy for different setups in Figure 5a for Kahului for the May 2006 Tonga Tsunami.
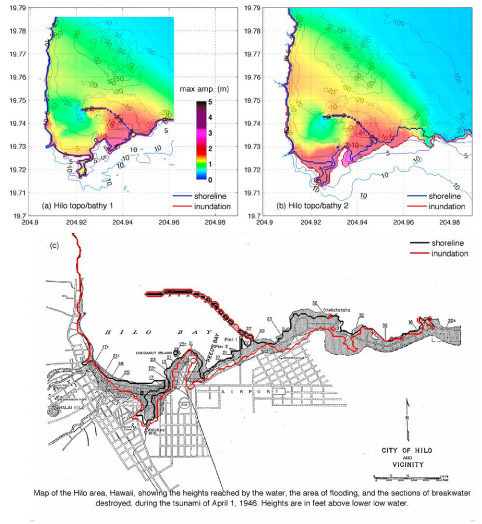
Fig. 6. (a and b) Maximum water elevations at Hilo computed from two sets of topographic and bathymetric grids for the April 1946 Unimak tsunami. (c) Comparison between computed inundation in Figure 6b and survey data from Shepard et al. [1950].
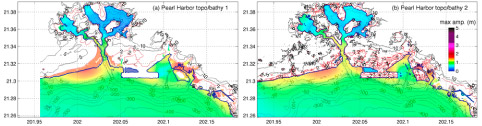
Fig. 7. Inundations at Pearl Harbor computed from two sets of topographic data sources used for a simulated TMw 9.3 tsunami. Topography was derived from (a) USGS DEM and (b) CSC LIDAR data. Color represents the maximum water elevation in m.
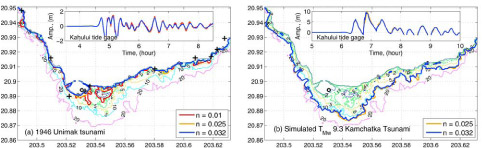
Fig. 8. Sensitivity of inundation and time series of tsunami amplitudes computed by the Kahului forecast model to Manning coefficients for (a) the April 1946 Unimak tsunami and (b) a simulated TMw 9.3 Kamchatka tsunami. Dots, Kahului tide gauge; crosses, Tsunami runup record from Pararas-Carayannis [1969].
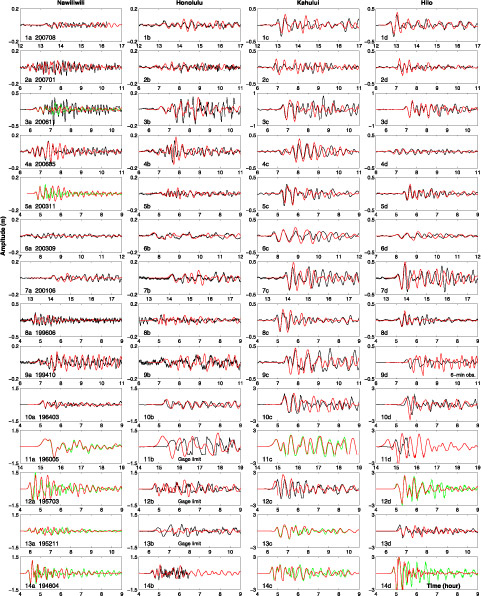
Fig. 9. Modeled and observed tsunami time series at Nawiliwili, Honolulu, Kahului, and Hilo tide stations for fourteen tsunamis. When no observation is available, results from the forecast models are compared with those from the reference inundation models. Black lines, observations; red lines, forecast models; green lines, reference inundation models. A 12 min adjustment was applied to the model time series 1a–1d for the August 2007 Peru tsunami.
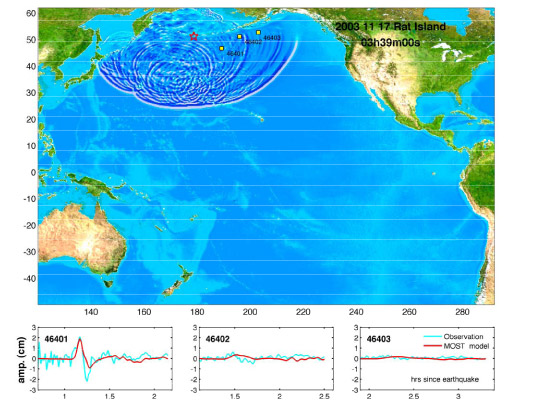
Movie S1. Propagation of the 17 November 2003 Rat Islands Tsunami in the Pacific Ocean. Animation available in the HTML.
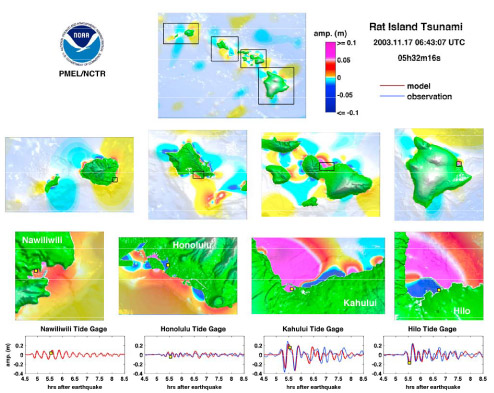
Movie S2. The 17 November 2003 Rat Islands Tsunami in Hawaiian Islands. Animation available in the HTML.
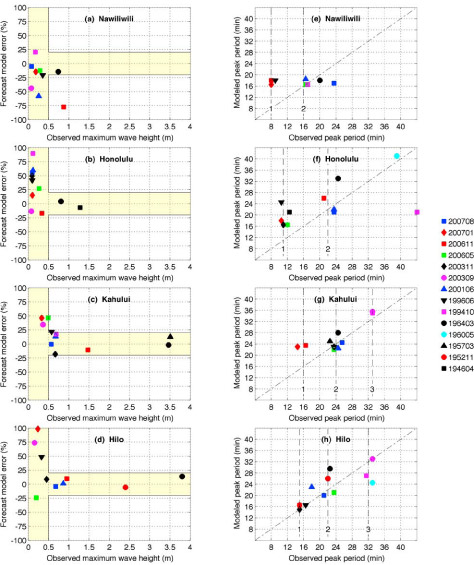
Fig. 10. (a–d) Error of the maximum wave height and (e–h) peak wave period from observations and model results by the Nawiliwili, Honolulu, Kahului, and Hilo forecast models. Forecast model error is (H − Hobs)/Hobs, where H is the modeled maximum wave height and Hobs is the observation. Colors represent subduction zones of the earthquakes. Red, central Kuril and Kamchatka; magenta, Hokkaido and west Kuril; black, Aleutian and Alaska; green, Tonga; blue, Peru; cyan, Chile.
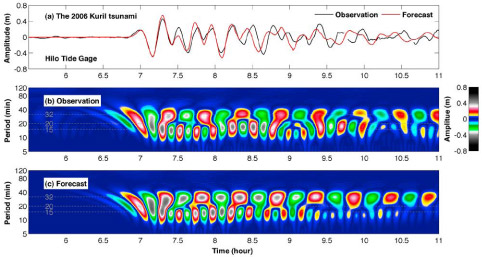
Fig. 11. (a) Time series of observed and forecast wave amplitudes at Hilo tide gauge computed by the Hilo forecast model in real time during the November 2006 Kuril Islands tsunami. Real parts of the wavelet-derived amplitude spectra of the (b) observed and (c) modeled tsunami waves are plotted.
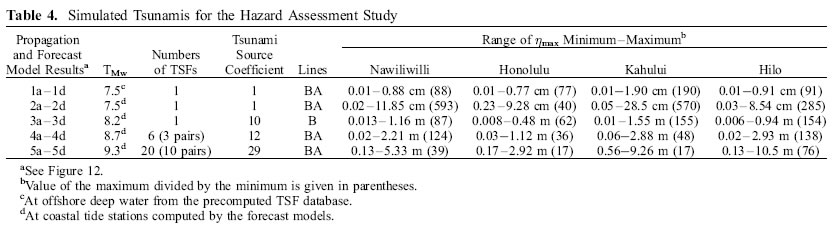
Table 4. Simulated tsunamis for the hazard assessment study.

Fig. 12. Bars in propagation results 1a–1d indicate ηmax at four offshore locations at 4400–5000 m water depth for TMw 7.5 tsunamis, which are from the TSF database. Locations of the four offshore points are shown in Figure 2a. Here ηmax at the coastal tide stations computed by the forecast models are plotted as bars at corresponding source locations in forecast model results 2a–5d for the TMw 7.5 (2a–2d), 8.2 (3a–3d), 8.7 (4a–4d), and 9.3 (5a–5d) magnitudes. Colors in forecast model results 2a–2d represent time of first tsunami arrival, t1, which is the time of water level reaching 20% height of the first significant peak or trough. Colors in forecast model results 3a–3d, 4a–4d, and 5a–5d represent the difference in time between the arrival of the maximum elevation, tmax, and the first arrival, t1.

Fig. 13. Maximum computed water elevation at offshore deep water and coastal tide stations in (a–d) logarithmic and (e–h) Cartesian coordinates. Colors represent tsunami moment magnitudes. Solid lines, the fits by regression analysis in logarithmic scale; dashed lines, the prediction bounds based on 95% confident level; R, square of the correlation; RMSE, root mean squared error; p0 and p1, parameters.
Return to References
Return to Abstract