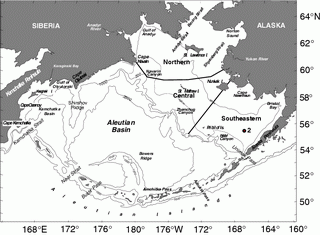
Figure 30.1: Geography and place names of the Bering Sea. The location of the M2 is indicated. Depth contours are in meters. (From Schumacher and Stabeno, 1998 or Stabeno et al., 1999.)
Figure 30.2: Pathways whereby changes in physical environment influence the biological processes (after Schumacher et al., 2003). Sea ice appears twice because it represents pathways for different processes.
Figure 30.3: Average net short wave radiation (NSWR) from April 1–June 30 (Wm![]() ). Note negative indicates a downward flux.
). Note negative indicates a downward flux.
Figure 30.4: Schematic of mean circulation in the upper 40 m over the basin and shelf (from Stabeno et al., 1999). The arrows with large heads represent currents with mean speeds >50 cm s![]() . The Alaskan Stream, Aleutian North Slope Current (ANSC), Bering Slope Current (BSC) and Kamchatka Current are indicated. Depth contours indicate 1000 m isobath and in the Bering Sea the 200 m isobath.
. The Alaskan Stream, Aleutian North Slope Current (ANSC), Bering Slope Current (BSC) and Kamchatka Current are indicated. Depth contours indicate 1000 m isobath and in the Bering Sea the 200 m isobath.
Figure 30.5: Schematic of ecosystem changes in the eastern Bering Sea showing trends of the relative abundance of select marine mammals, fish, and shellfish in the eastern Bering Sea (after NRC, 2003).
Figure 30.6: Time series of temperature contours at the long-term monitoring site in the middle domain (Site 2). Areas of black indicate cold water resulting from the presence of melting sea ice. The yellow line near the bottom of each panel indicates fluorescence at 11–13 m depth. For each year, the fluorometer tracts have been scaled to the highest value in that year. Gaps in this record occur due to fouling of the instrument or loss of mooring. (After Stabeno and Hunt, 2002.)
Figure 30.7: Contours of temperature (color; .C) and nitrate (black lines; mmoles l.1). The locations of the CTD stations are marked along the bottom axis. Nutrients were measured on each cast. (From Kachel et al., in 2002)
Figure 30.8: Trajectories simulated for a 90-day period starting on 1 April 2001. The upper left panel shows all drifters, while the other panels show drifters divided as a function of initial release depth. Note that with increasing depth there is a greater tendency for drifters to flow northwestward and even become involved in the eddy-like circulation associated with the Bering Slope Current. This suggests a mechanism for planktonic transport between oceanic and shelf waters.
Figure 30.9: Time series of year class abundance of age-1 pollock. Error bars represent ~95% confidence interval. (From Ianelli et al., 2001.)
Figure 30.10: A synthesis of physical phenomena that help dictate the timing of the spring phytoplankton bloom of the southeastern Bering Sea shelf. The top panel includes the timing of the last retreat of sea ice, the timing of the shift between winter and summers wind conditions, and their effect on the timing of the spring bloom over the southern portion of the middle domain. Note that ice-related or early blooms occur in years when the ice retreat comes in mid March or later. In 1975 there was an ice-related bloom in May. The date of the last winter storm was defined as when the wind speed cubed fell below 2500 m![]() s
s![]() for the summer. The winds were measured at St. Paul Island. (From Hunt et al., 2002.) The lower panel shows the relationship between ice retreat and date of last winter storm with the years divided into regimes. If the relationship between timing of ice retreat and spring phytoplankton bloom hold, then the timing of the spring bloom can be inferred for each regime.
for the summer. The winds were measured at St. Paul Island. (From Hunt et al., 2002.) The lower panel shows the relationship between ice retreat and date of last winter storm with the years divided into regimes. If the relationship between timing of ice retreat and spring phytoplankton bloom hold, then the timing of the spring bloom can be inferred for each regime.
Figure 30.11: Schematic of the OCH. The number of pollock recruits affects not only pollock population dynamics, but also the availability of age-1 pollock to predators such as marine birds and mammals. Top Panel: In a cold regime, copepod production is limited by water temperature and larval/juvenile pollock survival is prey limited. Upper Middle Panel: At the beginning of a warm regime, copepods flourish and provide ample food resources to support strong survival of larval and juvenile pollock; juvenile pollock survival is high because there are few large piscivorous fish to consume them. Lower Middle Panel: In a warm regime, the production of copepod food for larval and juvenile pollock remains strong, but survival of juveniles and recruitment is limited to cannibalism from the growing biomass of adult pollock and other predators such as Pacific cod and arrowtooth flounder. Bottom Panel: At the beginning of a cold regime, copepod production is limited and larval and juvenile pollock are food limited. In addition, cannibalism by adult pollock and other predators further limits recruitment. Thus, there are asymmetries in how pollock recruitment will respond to changes from a cold to a warm regime versus from a warm to a cold regime.