
U.S. Dept. of Commerce / NOAA / OAR / PMEL / Publications
Agricultural practices, fossil fuel burning and cement manufacturing have resulted in a more than 35% increase in atmospheric carbon dioxide (CO2) concentrations over the last 200 years. However, this increase would have been much more dramatic if the ocean had not been absorbing a significant amount of the CO2 resulting from human activity (anthropogenic CO2). There are three major reservoirs with exchange rates fast enough to vary significantly on the timescale of decades to centuries: the atmosphere, terrestrial biosphere and the ocean. Of this three-component system, ~93% of the carbon is located in the ocean (Fig. 6.2). Although this means that the ocean has a tremendous capacity to influence future atmospheric CO2 concentrations, it also means that it is very difficult to accurately constrain the oceanic sink for anthropogenic CO2.
The anthropogenic signal that has accumulated in the ocean over the last 200 years is generally less than 3% of the natural carbon in surface sea water, making it difficult to distinguish the anthropogenic CO2 from the observed natural variability. Unfortunately, ocean carbon measurements cannot directly distinguish between anthropogenic CO2 and natural inorganic carbon; moreover, the historical measurements of ocean carbon are inadequate to document directly the increase in ocean inventories. Until recently, almost all estimates of oceanic CO2 uptake have been based on modelling studies, which must be evaluated and improved based on geochemical tracers other than anthropogenic CO2 (e.g. bomb radiocarbon, chlorofluorocarbons).
Concerns over the greenhouse effect and global climate change have inspired scientists to focus their attention on improving our understanding of the ocean’s role in the global carbon cycle. Recently, oceanographers have made great advances in both ocean carbon observations and modelling, leading to an improved understanding of the cycling of carbon in the ocean and exchanges with other carbon reservoirs (e.g. Sabine et al., 2004a). This chapter will focus primarily on the oceanic sink for CO2 and the seasonal, interannual and decadal-scale variability in sea–air fluxes. In particular, it will discuss how the sea–air exchange of CO2 relates to the oceanic uptake of anthropogenic CO2, and potential feedbacks within the carbon cycle as well as the carbon–climate system that may change the oceanic uptake of CO2 in the future.
As there were no ocean carbon measurements during the pre-industrial period (prior to c.1800), we have to use indirect geochemical evidence and our understanding of current carbon cycle dynamics to infer how the ocean carbon cycle operated prior to human intervention. One aspect of the global carbon cycle that helps us to better understand the pre-industrial period is the fact that atmospheric CO2 concentration was remarkably stable, with variations in atmospheric CO2 of <20 ppm, during at least the last 11,000 years prior to the anthropogenic perturbation (Joos and Prentice, 2004). Since global ocean circulation operates on timescales of ~1000 years and sea–air exchange has time-scales of about 1 year (Broecker and Peng, 1982), the ocean must have been in a steady state with respect to the atmosphere and terrestrial biosphere (the only other sizable carbon reservoirs with comparable exchange timescales) during this period.
Figure 3.1 shows a recently compiled budget of the pre-industrial ocean carbon cycle (Sabine et al., 2004a). It shows some of the complexity of the carbon transformations within the ocean. The gross exchanges across the sea–air interface are estimated to be ~70 Pg C/year. These fluxes are about ten times larger than the current emissions of CO2 into the atmosphere from burning fossil fuels, but since the CO2 release is very nearly balanced by an oceanic uptake there is little net effect on atmospheric CO2 concentrations. The pre-industrial ocean is estimated to have a small net flux (~0.6 Pg C/year) out of the ocean to balance the carbon that enters from rivers and groundwater (Ridgwell and Edwards, Chapter 6, this volume). The river input comes from the terrestrial biosphere and the weathering of continental rocks, which in turn absorb the CO2 from the atmosphere (Watson and Orr, 2003).
Fig. 3.1. Schematic representation of the pre-industrial ocean carbon cycle. Fluxes (arrows) are in Pg C/year and reservoir sizes (numbers in square brackets) are in Pg C. (Modified from Sabine et al., 2004a.) Abbreviations: PIC, particulate inorganic carbon; DOC, dissolved organic carbon; DIC, dissolved inorganic carbon.
The partial pressure of CO2 (pCO2) in pre-industrial surface sea water is estimated to have roughly the same geographical and seasonal variability as the modern ocean, with values ranging from 150 to 750 ppm. Model studies suggest that prior to 1800 the northern hemisphere oceans were taking up atmospheric CO2 while the Southern Ocean was a net source of CO2 to the atmosphere. Recent transport calculations as part of the second Ocean Carbon Model Intercomparison Project (OCMIP-2), which included 12 ocean carbon general circulation models (GCMs), indicated that in pre-industrial times carbon was transported southward in the ocean interior across the equator at an average rate of just under 0.35 Pg C/year (Orr, 2004). This net transport was most likely lost back to the atmosphere in the Southern Ocean as a net atmospheric transport of carbon northward across the equator is required to balance the northern oceanic uptake. This is in contrast to the current scenario in which rising atmospheric CO2 concentrations have made the modern Southern Ocean a net sink for CO2 and the predominantly northern hemisphere sources of fossil fuel burning have resulted in a net atmospheric carbon transport from north to south, the same direction as the net ocean transport.
Since the pre-industrial period, atmospheric CO2 concentrations have increased from 280 ppm to nearly 380 ppm. This increase in CO2 drives the sea water to absorb CO2 from the atmosphere so that surface sea water is pushed to achieve thermodynamic equilibrium with the atmospheric partial pressure. Figure 3.2 shows a summary of the additional fluxes in the modern ocean resulting from human activity and rising atmospheric CO2. The role of the ocean in the global carbon cycle has changed from being a net source of CO2 to the atmosphere to a net sink for CO2 of ~2 Pg C/year (Sabine et al., 2004a).
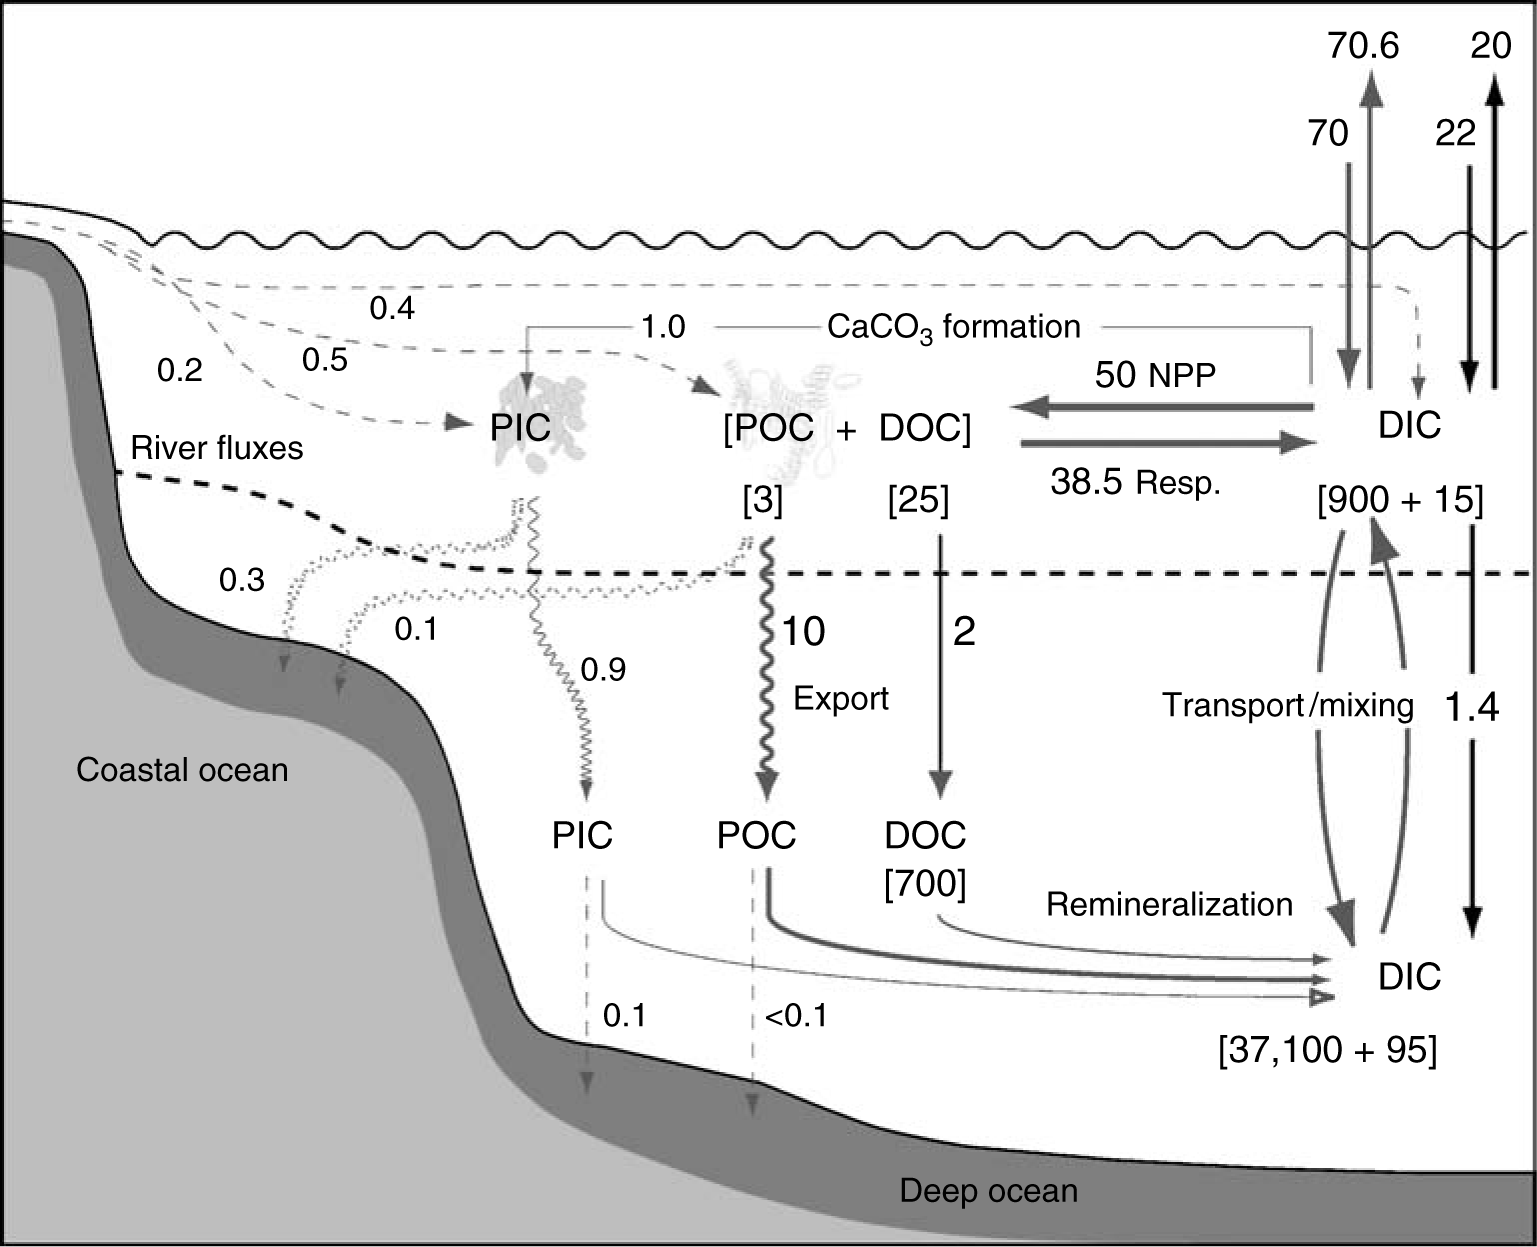
Fig. 3.2. Schematic representation of the ocean carbon cycle with pre-industrial fluxes and reservoir sizes (upright) and average values for the 1980s and 1990s (italic). Fluxes (arrows) are in Pg C/year and reservoir sizes (numbers in square brackets) are in Pg C. (Modified from Sabine et al., 2004a.)
Today, the average pCO2 of the atmosphere is ~7 ppm higher than the global ocean pCO2. This small air–sea difference, when spread across the entire surface of the ocean, is sufficient to account for the oceanic uptake of anthropogenic CO2. The pCO2 values in mixed-layer waters, which exchange CO2 directly with the atmosphere, are affected primarily by changes in temperature, dissolved inorganic carbon (DIC) and total alkalinity (TAlk). While the water temperature is regulated by physical processes, including solar energy input, sea–air heat exchanges and mixed-layer thickness, DIC is primarily controlled by the physical processes of air–sea exchange and upwelling of subsurface waters as well as the biological processes of photosynthesis and respiration. Biological production removes carbon from surface waters to form organic material. As organisms die and sink to the ocean interior, they decompose, releasing the carbon once again to the water. This process contributes to higher pCO2 and DIC concentrations in deep ocean waters relative to the surface waters. As pCO2 increases when the water is warmed and decreases as a result of biological uptake, the oceanic uptake and release of CO2 is governed by a balance between the changes in sea water temperature, net biological utilization of CO2 and circulation processes in the upper ocean (Zeebe and Wolf-Gladrow, 2001).
Taro Takahashi of Lamont–Doherty Earth Observatory and his collaborators have amassed a database of more than 1.7 million surface ocean pCO2 measurements, spanning more than 30 years, and derived a pCO2 climatology for the global ocean (Takahashi et al., 2002). These data have been used to determine global and regional sea–air CO2 fluxes with an average annual global open-oceanic uptake of 1.5 ± 0.4 Pg C/year for a nominal year of 1995 (Takahashi et al., 2002; revised by T. Takahashi, New York, 2005, personal communication). This flux estimate represents the total net flux in 1995. The total anthropogenic flux would be the difference between the 1995 net sea–air flux and the pre-industrial net sea–air flux (i.e., −1.5 − 0.6 = −2.1 Pg C/year)—a flux consistent with earlier estimates based on models.
Figure 3.3 shows the distribution of total net sea–air CO2 fluxes. The darker shades indicate oceanic areas where there is a net source of CO2 to the atmosphere and the lighter shades indicate regions where there is a net sink of CO2. The equatorial Pacific is a strong source of CO2 to the atmosphere throughout the year as a result of upwelling that brings deep, high CO2 waters to the surface in the central and eastern regions. This upwelling, and thus the CO2 flux to the atmosphere, is heavily modulated by the El Niño–southern oscillation (ENSO) cycle. During strong El Niño years the equatorial Pacific CO2 source can drop to zero. During La Niña the CO2 source to the atmosphere is enhanced. High CO2 outgassing fluxes are also observed in the tropical Atlantic and Indian oceans throughout the year. The Arabian Sea becomes a significant source of CO2 to the atmosphere in the late summer and early fall months as the south-east monsoon generates intense upwelling off the Arabian peninsula.
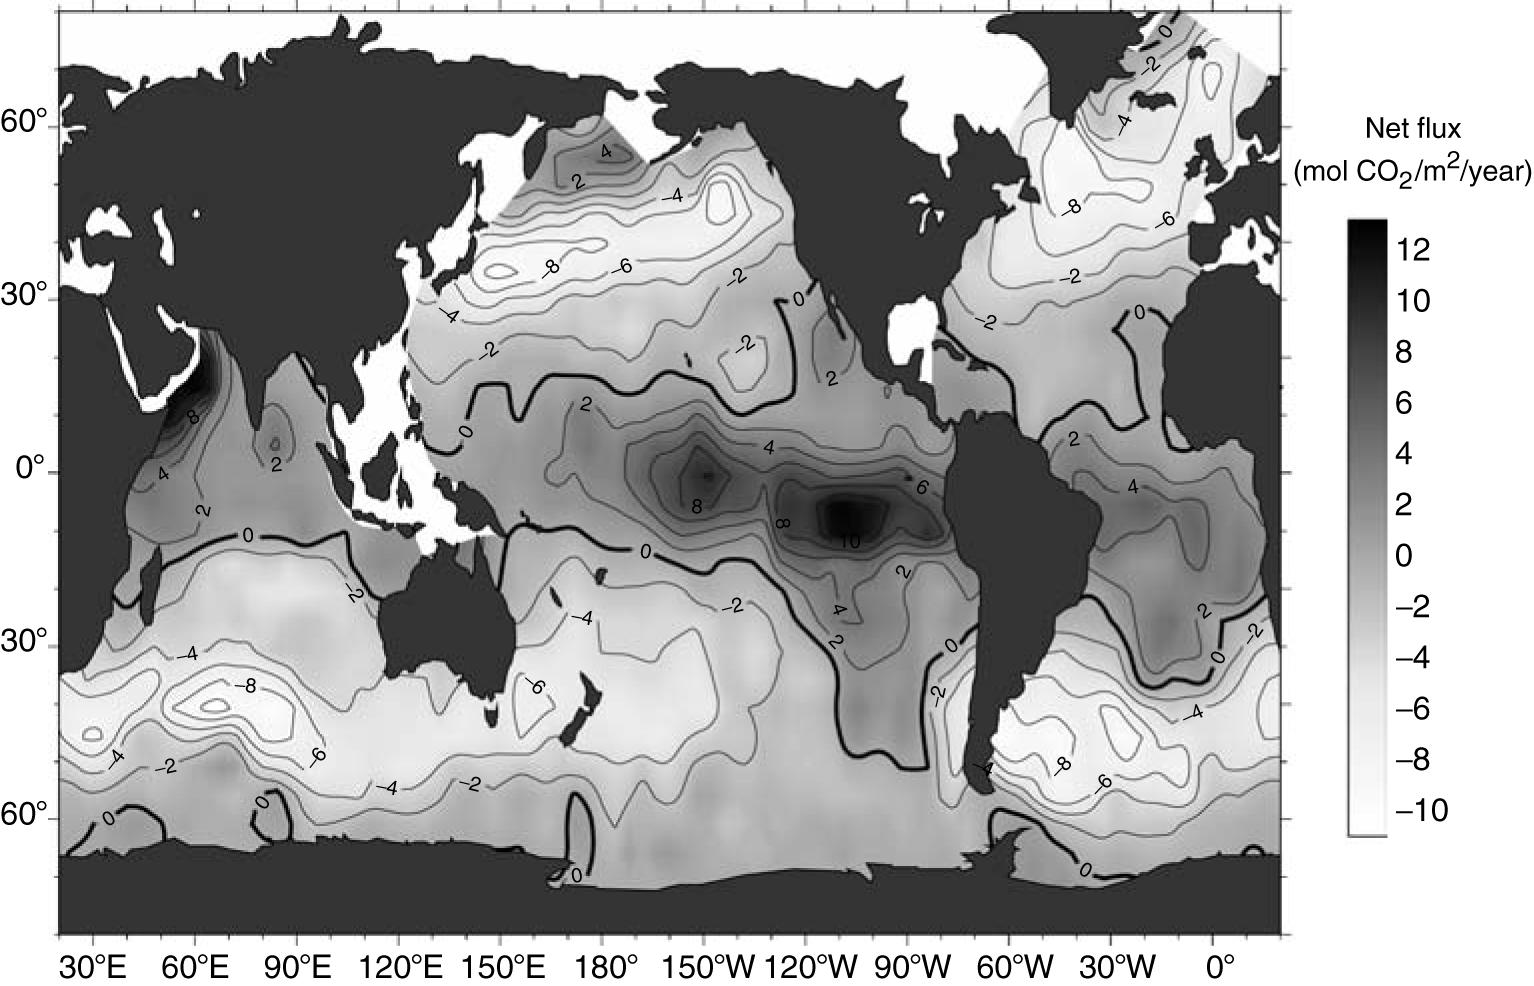
Fig. 3.3. Global climatology of the annual net sea–air CO2 flux (mol CO2/m2/year) based on interpolation of sea–air pCO2 differences as in 1995. (From Takahashi et al., 2002.)
Strong convective mixing also brings up high CO2 values in the north-western sub-Arctic Pacific and Bering Sea during the northern winter. However, just outside this region there is a seasonal oscillation in CO2 flux. The geochemical response of the ocean to changing temperatures is to decrease the pCO2 by 4.23%/°C of sea water cooling (Takahashi et al., 1993). In some regions, decreasing temperatures in the winter can lower the ocean’s pCO2 values sufficiently to counteract the elevated CO2 brought to the surface from stronger winter time mixing (e.g., temperate North Pacific and North Atlantic oceans). The fluxes out of the ocean from elevated temperatures during summer are limited by stratification, resulting in a small net annual flux into the ocean. Similar seasonal changes are observed in the southern temperate oceans, but are out of phase by half a year.
Intense regions of CO2 uptake are seen in the high-latitude northern ocean in summer and in the high-latitude South Atlantic and southern Indian oceans in austral summer. This uptake is associated with high biological utilization of CO2 in thin mixed layers. As the seasons progress, vertical mixing of deep waters eliminates this uptake of CO2. These observations indicate that the CO2 flux in high-latitude oceans is governed primarily by deep convection in winter and biological uptake during the spring and summer months, whereas in the temperate and subtropical oceans, the flux is governed primarily by water temperature. Outside the equatorial belt, the ∆pCO2 (sea water pCO2—atmospheric pCO2) is highest during winter in subpolar and polar waters, whereas it is highest during summer in the temperate regions. Thus, the seasonal variation of ∆pCO2 and, consequently, the shift between net uptake and release of CO2 in subpolar and polar regions are about 6 months out of phase with that in the temperate regions.
The ∆pCO2 maps are combined with solubility (s) in sea water and the kinetic forcing function, the gas transfer velocity (k), to produce the flux equation:
F = ks∆pCO2 (3.1)
where the gas transfer velocity, k, is controlled by near-surface turbulence in the liquid boundary layer. Laboratory studies in wind–wave tanks have shown that k is a strong but non-unique function of wind speed (Wanninkhof et al., 2002). Results from various wind–wave tank investigations and field studies indicate that factors such as fetch, wave direction, atmospheric boundary layer stability and bubble entrainment influence the rate of gas transfer. Moreover, surfactants can inhibit gas exchange through their damping effect on waves. The commonly used gas transfer parameterizations have been based solely on wind speed, in large part because k is strongly dependent on wind, global and regional wind speed data are readily available and effects other than wind speed have not been well quantified (Wanninkhof et al., 2002). Table 3.1 shows the regional variations of the climatological sea–air exchange fluxes.
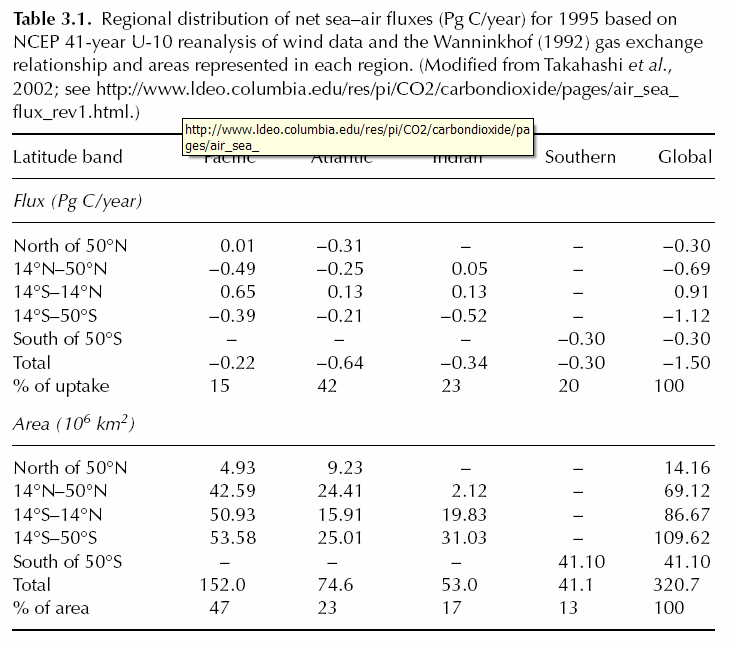
Table 3.1.
Using an alternative gas exchange formulization, however, can suggest a different distribution of fluxes. For example, Wanninkhof and McGillis (1999) have suggested a cubic relationship to wind speed instead of the quadratic relationship of Wanninkhof (1992). The cubic relationship gives an uptake that is 45% larger than the quadratic relationship (Table 3.2). This primarily results from a larger CO2 uptake in the high-latitude sink regions because of the stronger impact of the higher winds on the gas exchange (Feely et al., 2001). More studies of gas exchange processes at high wind speed regimes are required before determining whether the quadratic, cubic or some other newly developed relationship is appropriate for high wind speeds.
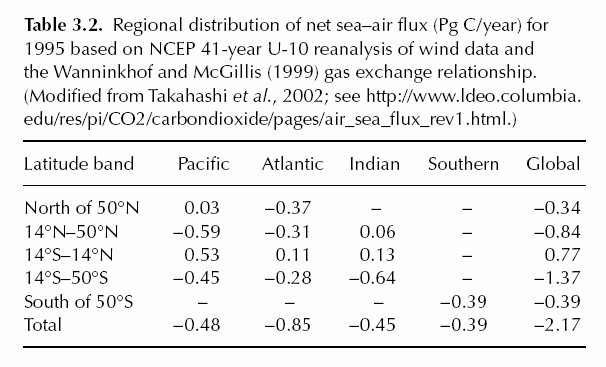
Table 3.2.
Over the last 40 years, the growth rate of CO2 in the atmosphere has experienced interannual variations as large as ±2 Pg C/year (Francey et al., 1995; Keeling et al., 1996). There is an ongoing controversy on the relative contributions of this variability from atmosphere–land and atmosphere–ocean exchanges (Fig. 3.4). Time series measurements of atmospheric CO2, 13C and O2/N2 sources have suggested that ocean flux variations must be in the order of 1–2 Pg C/year (Francey et al., 1995; Keeling et al., 1996; Rayner et al., 1999; Battle et al., 2000; Bousquet et al., 2000). However, ocean modelling and revised inverse models (Winguth et al., 1994; Le Quéré et al., 2000, 2003; Obata and Kitamura, 2003; McKinley et al., 2004; Peylin et al., 2005; Wetzel et al., 2005) as well as empirical approaches (Lee et al., 1998; Park et al., 2006) have suggested a much smaller ocean variability of ~0.3–0.5 Pg C/year.
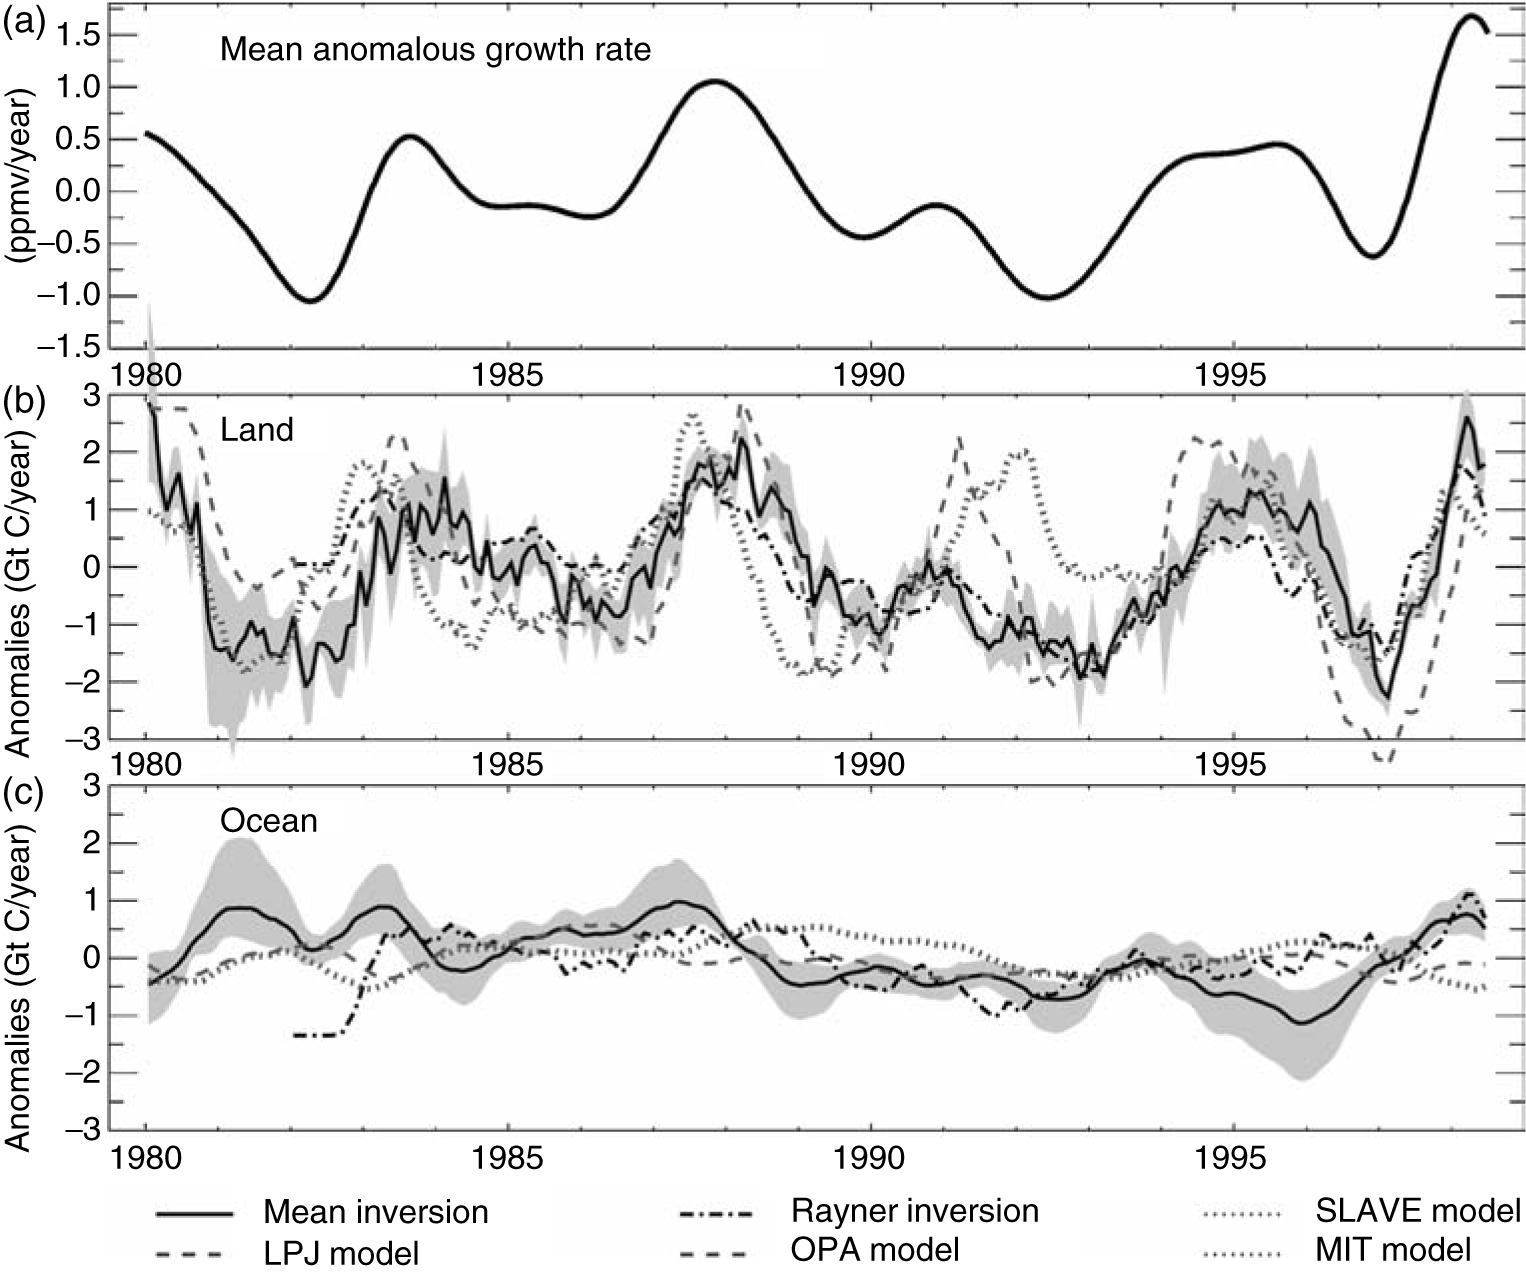
Fig. 3.4. Comparison of (a) atmospheric mean annual growth rate, (b) land CO2 flux anomalies and (c) ocean CO2 flux anomalies between 1980 and 1995 (in Gt C/year). The grey zone denotes the range of the inversion models, and the dark line denotes the mean. The coloured lines show the ocean models. (After Peylin et al., 2005.)
Of the few direct time series measurements made over large ocean regions so far, only the equatorial Pacific Ocean (Feely et al., 1997, 1999) and the Greenland Sea (Skjelvan et al., 1999) have shown large year-to-year variations in sea–air CO2 flux. However, there are not many data-sets with which to evaluate such flux variability directly. The variability observed in the equatorial Pacific and North Atlantic oceans is not sufficient to account for all of the variability estimates, but other regions including the Southern Ocean and subtropical regions have not been studied sufficiently to determine their contributions to oceanic variability. Recent ocean model results have suggested that after the equatorial Pacific, the Southern Ocean and the northern extra-tropical regions are also important regions showing significant interannual variability in sea–air CO2 flux (Peylin et al., 2005; Wetzel et al., 2005). Resolving this controversy and imposing stricter constraints on carbon cycle models will require more detailed observations of the magnitude and causes of variability in the sea–air CO2 flux and other carbon-related species in the ocean, as well as continued atmospheric measurements of temporal and spatial distributions of CO2, 13C and O2/N2.The oceanic uptake of anthropogenic CO2 is primarily a physical response to rising atmospheric CO2 concentrations. Whenever the partial pressure of a gas is higher in the atmosphere over a body of water, the gas will diffuse into that water until the partial pressures across the air–water interface are equilibrated. There is no evidence that the rising atmospheric CO2 concentrations have had a measurable impact on biological processes in the ocean. The growth rate of the primary producers in the ocean (phytoplankton) is generally limited by either light or nutrient availability, not carbon. It is possible that climate changes (e.g., ocean temperature or circulation changes) may be affecting the ocean carbon system, but these effects are thought to be small for the 19th and 20th centuries.
Several independent approaches have been used to estimate the modern oceanic uptake rate of anthropogenic CO2. Table 3.3 shows a summary of the ocean observations and model estimates of the anthropogenic CO2 uptake in the 1990s (in Pg C/year). Most of the models are in reasonably good agreement with the flux estimates from the observational data when corrected for the pre-industrial carbon flux.
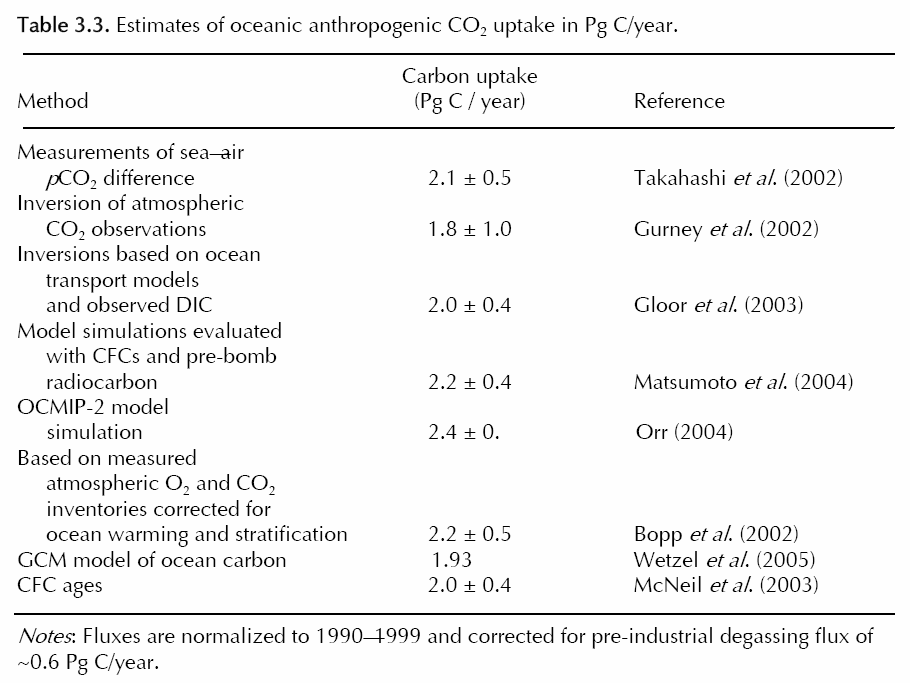
Table 3.3.
Models suggest that anthropogenic CO2 uptake occurs everywhere in the surface ocean, even in areas that have a total net CO2 flux out of the ocean. For example, the pCO2 of sea water in the eastern equatorial Pacific is much higher than atmospheric pCO2. This sea–air difference in pCO2 causes the ocean to release CO2 to the atmosphere. As atmospheric CO2 concentrations rise, the difference between the sea water pCO2 and atmospheric pCO2 is decreased and the rate of CO2 loss drops. The additional CO2 that is stored in the sea water, which would have been lost to an atmosphere with lower pCO2 values, is referred to as the anthropogenic uptake.
It is important to note that there is a difference between CO2 uptake and CO2 storage. While there may be a large anthropogenic CO2 uptake in the equatorial Pacific, the water is quickly transported off the equator and the anthropogenic CO2 is actually stored in the subtropical gyres (Gloor et al., 2003). Ocean carbon models suggest that the high-latitude Southern Ocean is also a region with large anthropogenic CO2 uptake, but the anthropogenic CO2 is stored further to the north where mode and intermediate water masses are formed. Water mass formation regions are areas in which water is moved from the surface into the ocean interior. Once the waters leave the surface, the anthropogenic CO2 is isolated from the atmosphere and stored until these waters return to the surface.
Recognizing the need to constrain the oceanic uptake, transport and storage of anthropogenic CO2 during the anthropocene as well as to provide a baseline for future estimates of oceanic CO2 uptake, two international ocean research programmes, the World Ocean Circulation Experiment (WOCE) and the Joint Global Ocean Flux Study (JGOFS), jointly conducted a comprehensive survey of inorganic carbon distributions in the global ocean in the 1990s (Wallace, 2001). After completion of the US field programme in 1998, a 5-year effort was started to compile and rigorously quality control the US and international data‑sets including a few pre-WOCE data-sets in regions that had limited data (Key et al., 2004). The final data-set, with 9618 hydrographic stations collected on 95 cruises, provides the most accurate and comprehensive view of the global ocean inorganic carbon distribution available (see http://cdiac.esd.ornl.gov/oceans/glodap/Glodap_home.htm). By combining these data with a back calculation technique (Gruber et al., 1996) for isolating the anthropogenic component of the measured DIC, Sabine et al. (2004b) estimated that 118 ± 19 Pg C has accumulated in the ocean between 1800 and 1994. This inventory accounts for 48% of the fossil fuel and cement manufacturing CO2 emissions to the atmosphere over this time frame.
A map of the anthropogenic CO2 ocean column inventory (Fig. 3.5) shows that CO2 is not evenly distributed in space. More than 23% of the inventory can be found in the North Atlantic, a region covering ~15% of the global ocean. By contrast, the region south of 50°S represents approximately the same ocean area but has only ~9% of the global inventory (Sabine et al., 2004b). Despite the relatively slow equilibration rate for CO2 in sea water (~1 year versus weeks for oxygen), uptake at the surface does not fully explain the spatial differences in storage. The primary reason for these differences is due to the slow mixing time in the ocean interior and the fact that waters move into the deep ocean only in a few locations. The highest inventories are found in locations where mode and intermediate waters move anthropogenic CO2 into the ocean interior (e.g., the northern North Atlantic or in the southern hemisphere associated with the subtropical convergence zone at 40°S–50°S; Fig. 3.5).
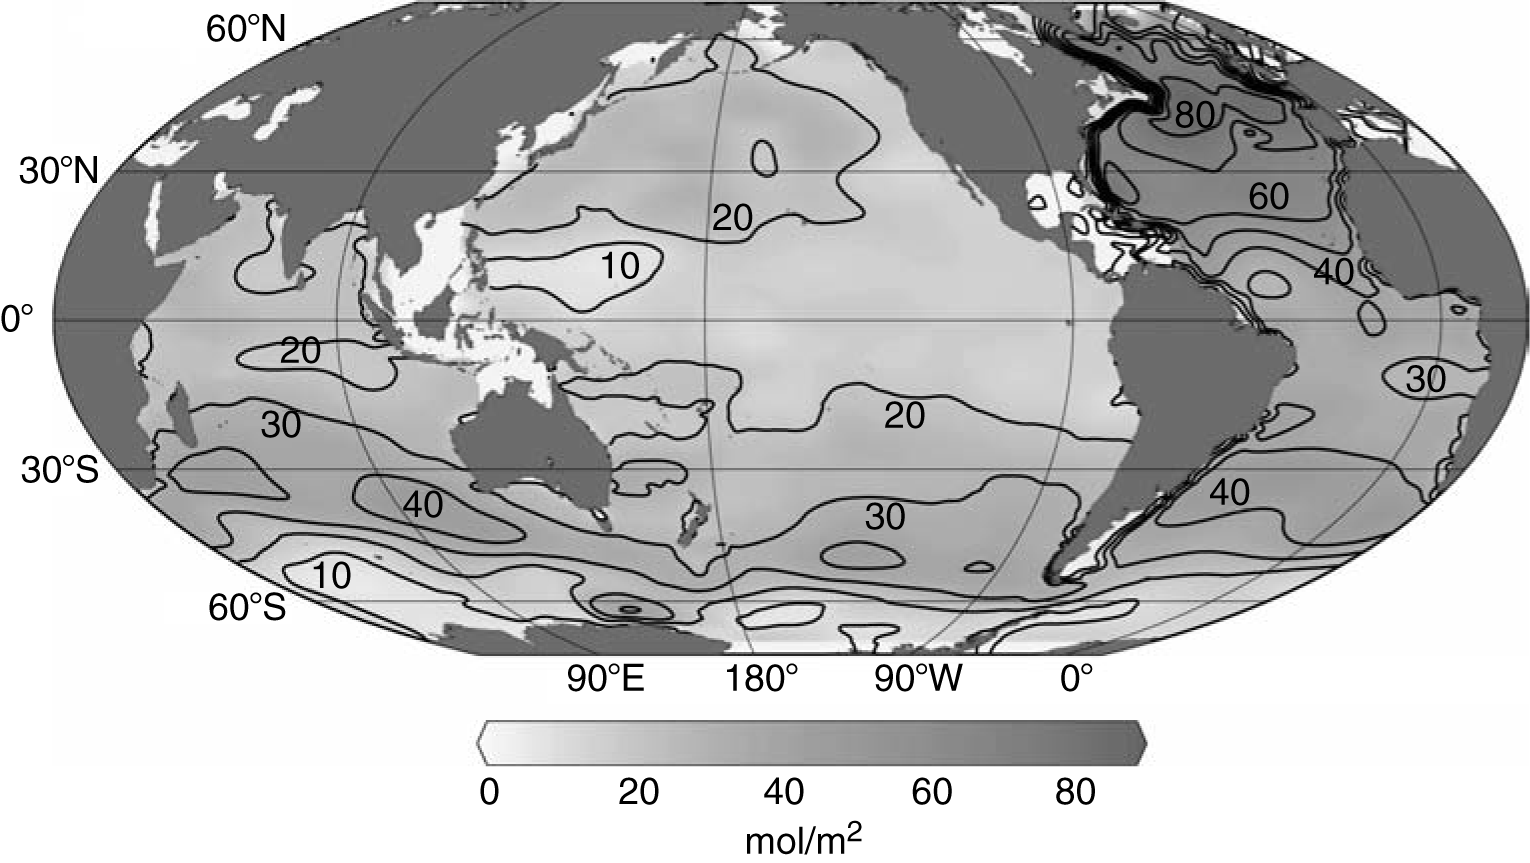
Fig. 3.5. Global map of anthropogenic CO2 column inventory in mol/m2. (From Sabine et al., 2004b.)
One exception to the observation of higher inventories associated with water mass formation regions is the fact that no large inventories are associated with the formation of bottom waters around Antarctica. There are several possible reasons:
In reality, it is likely to be a combination of all these factors that has limited our ability to detect substantial anthropogenic CO2 concentrations in the bottom waters around Antarctica.
Figure 3.6 shows sections of anthropogenic CO2 in the Atlantic, Pacific and Indian oceans. One feature that clearly stands out in these examples is that most of the deep ocean has still not been exposed to elevated CO2 levels. Nearly 50% of all the anthropogenic CO2 is stored in the upper 10% of the global ocean (depths less than 400 m) and detectable concentrations of anthropogenic CO2 average only as deep as 1000 m. The global ocean is far from being saturated with CO2. This further illustrates that the primary rate-limiting step for oceanic carbon uptake is not the exchange across the sea–air interface, but the rate at which that carbon is transported into the ocean interior. Model studies suggest that the ocean ultimately will absorb 70–85% of the CO2 released from human activity, but given the slow mixing time of the ocean, this will take millennia to accomplish (Le Quéré and Metzl, 2004).

Fig. 3.6. Representative sections of anthropogenic CO2 (µmol/kg) from the (a) Atlantic, (b) Pacific and (c) Indian oceans. Insets show maps of the station locations used to generate the sections.
By combining the Sabine et al. (2004b) estimate of the anthropogenic CO2 that has accumulated in the ocean between 1800 and 1994 with a synthesis of the average uptake estimate for the last 20 years (Sabine et al., 2004a), we can evaluate potential changes in the decadal-scale uptake rate of anthropogenic CO2 by the ocean. Table 3.4 shows the change in carbon inventories during the first 180 years of the anthropocene versus inventory changes over the last 20 years. These estimates suggest that the oceanic uptake of net CO2 emissions decreased from ~44% during the first period to ~36% over the last two decades. Although this difference is not statistically significant, there is a suggestion that the oceanic uptake efficiency is decreasing with time.
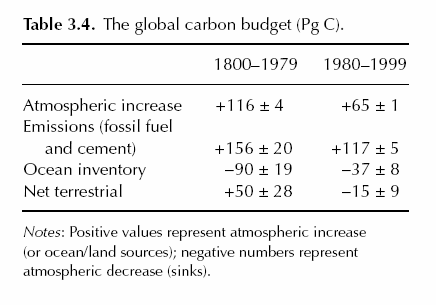
Table 3.4.
Several countries have initiated programmes to evaluate decadal-scale changes in oceanic CO2 uptake. For example, Ocean Station Papa in the north-eastern Pacific Ocean has been sampled for oceanic carbon on a semi-regular basis for the last 40 years (Signorini et al., 2001). Within the USA, the Hawaii Ocean Time-series (HOT) programme and Bermuda Atlantic Time-series Study (BATS) have been measuring carbon concentrations in the water column for more than 15 years. These projects have focused most of their attention on seasonal to interannual variability, but are beginning to have records long enough to see longer-term variability in CO2 uptake (e.g., Bates, 2001; Gruber et al., 2002; Dore et al., 2003; Keeling et al., 2004). Additional sites are also being examined by European and Asian countries.
Changes in the carbon concentrations along hydrographic sections sampled several years apart can also provide useful information on decadal-scale CO2 uptake. At least seven countries have agreed to coordinate hydrographic survey cruises to monitor the decadal-scale changes in ocean carbon inventory. For example, the USA CLIVAR/ CO2 Repeat Hydrography Program has outlined 19 cruises that will reoccupy sections that were last sampled in the 1990s. To date, six lines have been run. Preliminary results have suggested interesting basin-to-basin differences in the inferred uptake rates on these lines (e.g., 0.7 mol/m2/year in the North Atlantic versus 1.1 mol/m2/year in the North Pacific; see Feely et al., 2005; Wanninkhof et al., 2005). These changes in oceanic uptake may reflect changes in ocean circulation and/or the enactment of feedback mechanisms in the ocean that can serve to either enhance or reduce the uptake of anthropogenic CO2 in the ocean.
In classical carbon cycle model studies, emissions from fossil fuel burning are prescribed and the model computes the time evolution of atmospheric CO2 as the residual between emissions and uptake by land and ocean. Because the global carbon cycle is intimately embedded in the physical climate system, several feedback loops exist between the two systems (Friedlingstein et al., 2003). For example, increasing CO2 modifies the climate, which in turn impacts on ocean circulation and therefore on oceanic CO2 uptake. Similar effects are expected to occur on land with rising temperatures (e.g., higher soil carbon respiration rates). When a climate or carbon cycle feedback results in an increase in the atmospheric CO2 accumulation rate and thus in enhanced climate change, it is referred to as a positive feedback. A change that reduces atmospheric CO2 is a negative feedback.
The quantitative assessment of these feedbacks necessitates the use of coup led carbon cycle climate models. Three coupled models, Hadley Centre, Institute Pierre-Simon Laplace (IPSL) and Climate System Modelling Initiative (CSMI 4), have recently examined the feedbacks based on Intergovernmental Panel on Climate Change (IPCC) scenarios between 1850 and 2100 (Cox et al., 2000; Dufresne et al., 2002; Fung et al., 2005). By 2100 the results show dramatically different climate–carbon cycle sensitivities. These models simulate an enhanced increase of atmospheric CO2 as a result of the climate change impacts on the carbon cycle. However, the magnitudes of the feedbacks vary by a factor of four between the simulations. Without the feedbacks the models reach an atmospheric concentration of ~700 ppm by 2100. When the feedbacks are operating, the Hadley Centre model (Cox et al., 2000) reaches 980 ppm, leading to an average near-surface warming of +5°C, the IPSL model (Dufresne et al., 2002) attains only 780 ppm and a warming of +3°C and the CSMI 4 model reaches an atmospheric CO2 concentration of 792 ppm with a warming of +1.4°C. This different behaviour can be traced back to the land carbon cycle climate sensitivity of the Hadley Centre model being much larger than either the IPSL or CSMI 4 models as well as to the geochemical oceanic uptake being much larger in the IPSL model than in the Hadley Centre model.
These pioneering model simulations are subject to important limitations. In these models key biological processes on land and in the ocean are highly parameterized and poorly constrained (see Fung et al., 2005). Proper modelling of the coupled carbon and climate system, however, requires an improved understanding of the two primary classes of feedbacks: that of the carbon cycle and that of the carbon–climate system.
Carbon cycle feedbacks are processes that respond directly to increasing atmospheric CO2, resulting in a change of the net land–air or sea–air exchange of CO2. For example, the efficiency with which the ocean can absorb CO2 at the surface is related to how much CO2 can be converted to DIC. The measure of this is called the Revelle factor (RF) as given by Eq. 3.2 (Revelle and Suess, 1957):
(∆pCO2 / ∆DIC) / (pCO2 /DIC)
(3.2)
The RF of surface ocean waters varies from 8–9 in the subtropical gyres to 13–15 in the higher latitudes. Figure 3.7 shows the change in DIC concentration of the modern surface ocean in response to a uniform increase in pCO2 of 10 ppm, plotted as a function of RF. It also shows that waters with low RF (~9) are four times more efficient at taking up CO2 (∆DIC) than waters with very high RF (~15). The RF of ocean waters is controlled by the distribution of the DIC species, including the pH of the ocean.
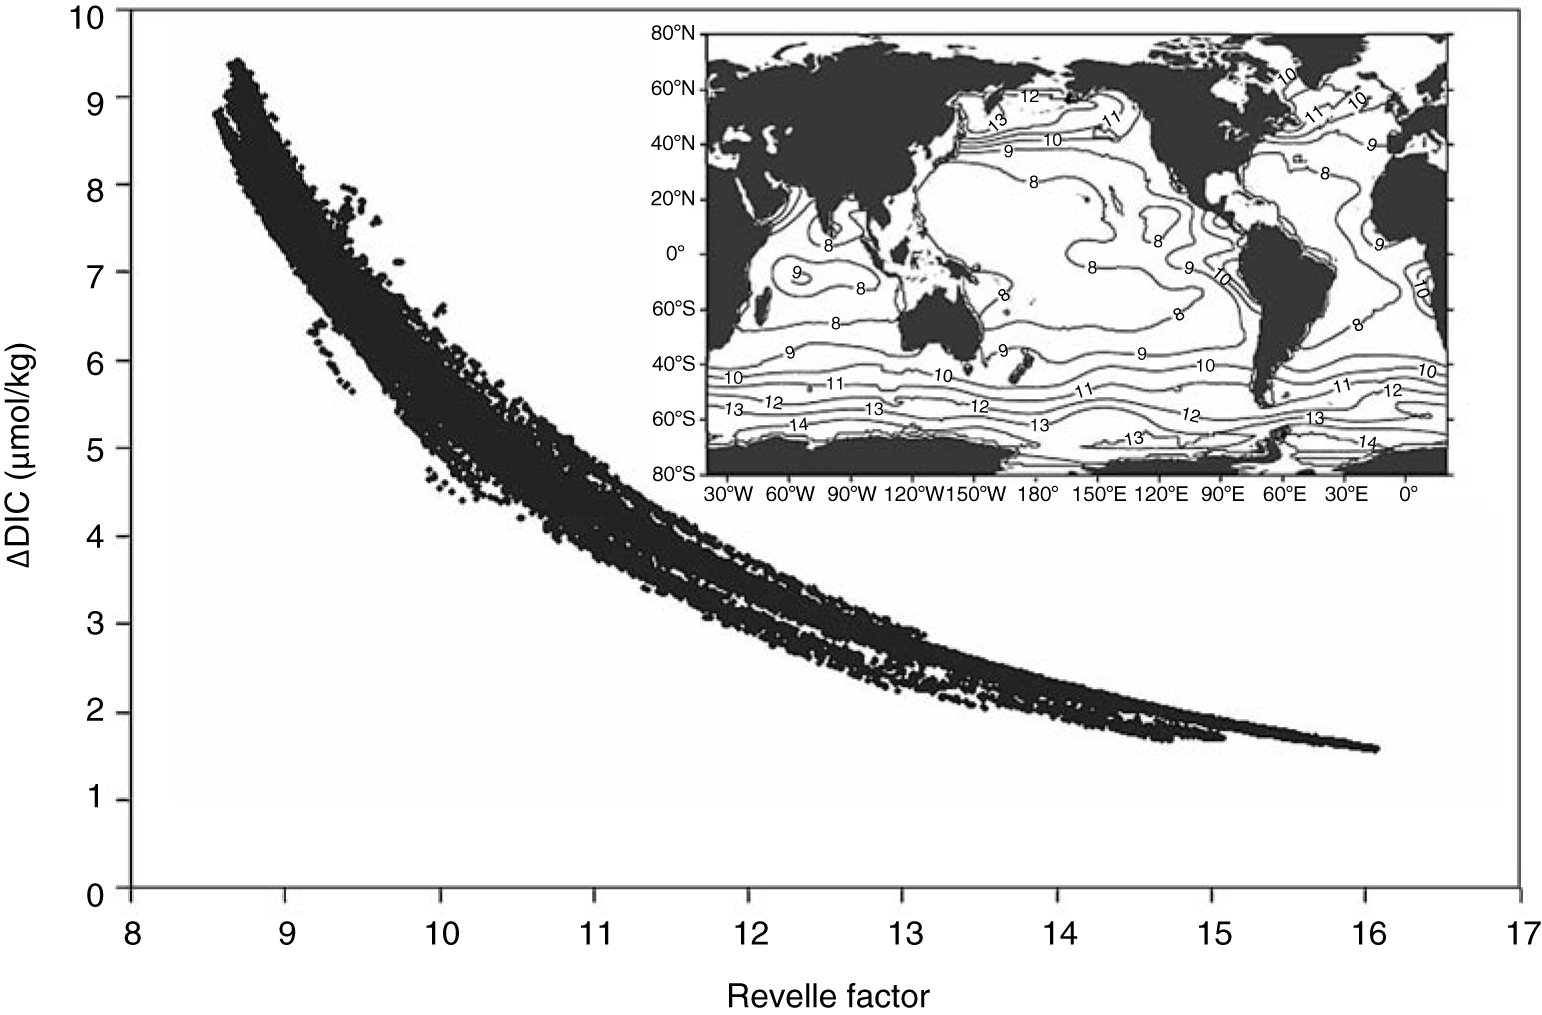
Fig. 3.7. Plot of the change in dissolved inorganic carbon for a 10 ppm change in pCO2 as a function of Revelle factor for surface waters (<60 m) from the GLODAP bottle data-set. Inset shows a map of surface Revelle factor from the same data-set.
As the ocean takes up anthropogenic CO2, the pH of the water decreases and the RF increases. With the anthropogenic CO2 estimates of Sabine et al. (2004b), the global average RF of surface waters today appears about one unit higher than the pre-industrial values. Thus, the surface ocean today is less efficient at taking up CO2 than the preindustrial ocean providing a positive feedback. According to Fig. 3.7, the significance of this effect will vary depending on locations. Changing the RF by one in the high latitudes will have less effect than changes in the subtropics with relatively low RF. A further insight of these processes and their proper representation in ocean carbon models is important for understanding the ultimate long-term storage of anthropogenic CO2 in the ocean.
Inorganic carbon thermodynamics are reasonably well understood, but some carbon cycle feedbacks, particularly those involving biological processes, are not well understood. One example of this is the effect of anthropogenic CO2 on organisms that produce calcium carbonate (CaCO3) shells. Shallow water environments, primarily coral reefs and carbonate shelves, produce ~0.3 Pg C/year, largely as metastable aragonite and high-magnesian calcite. Open-ocean plankton produces an estimated 0.7–1.4 Pg C/year (Milliman, 1993; Lee, 2001), mostly as calcite but also some aragonite. These open-ocean calcifiers include phototrophic coccolithophorids and heterotrophic foraminifera as well as pteropods. Using Eq. 3.3, 1 mol of CaCO3 produced releases 1 mol of CO2:
Ca+2 +2HCO−3 ↔ CaCO3+CO2+H2O (3.3)
Numerous studies have suggested that the rate of calcification in a wide variety of organisms is reduced when they are exposed to elevated CO2 levels (see summary in Feely et al., 2004). As atmospheric CO2 levels increase, one might expect calcification to decrease, which would lead to a lower natural release of CO2 from the ocean, providing a negative feedback.
The situation, however, is not that straightforward. A decrease in carbonate precipitation in the upper ocean would also lower the RF, increasing the capacity of the ocean to thermodynamically take up CO2 from the atmosphere. A complete shutdown of surface ocean calcification would decrease surface ocean pCO2 by ~20 ppm (Wolf-Gladrow et al., 1999). On the other hand, if these organisms are primary producers, the decrease in organic matter production could result in a positive feedback. Furthermore, a decrease in CaCO3 production would affect the ratio of organic/inorganic carbon delivery to the deep sea. If processes regulating this ‘rain’ of organic and inorganic carbon to deep-sea sediments are uncoupled, a decrease in CaCO3 production would lead to increased dissolution of CaCO3 in deep-sea sediments, which would raise the ocean pH and its capacity to store CO2 (Archer and Maier-Reimer, 1994). However, if these two processes are coupled and the denser carbonate particles are necessary for transporting the organic matter into the deep ocean quickly (Armstrong et al., 2002), reducing the carbonate production could result in shallower remineralization of organic carbon, producing a positive feedback (Klaas and Archer, 2002; Ridgwell, 2003), and a diminished role of sediments in the buffering of atmospheric CO2 increases. It is also not clear how elevated CO2 selection against a certain species (e.g., calcifying organisms) will affect the overall ecosystem structure and net CO2 uptake by ocean biology in the future. Clearly, there is a need for more research on these mechanistic controls of the long-term changes in the carbonate system.
In addition to the direct impacts of elevated CO2 on the ocean carbon system, there are many possible indirect effects related to the climate changes associated with the atmospheric CO2 increase. These feedback mechanisms include: (i) reduced CO2 solubility due to the increase in sea water temperature; (ii) enhanced stabilization of the upper water masses of the water column that will lead to decreased exchange of DIC and nutrients from the ocean interior; and (iii) enhanced productivity in high-latitude regions (Table 3.5). The potential magnitude of these carbon–climate feedbacks has been examined in several modelling studies (Sarmiento and Le Quéré, 1996; Sarmiento et al., 1998; Joos et al., 1999; Matear and Hirst, 1999; Greenblatt and Sarmiento, 2004).
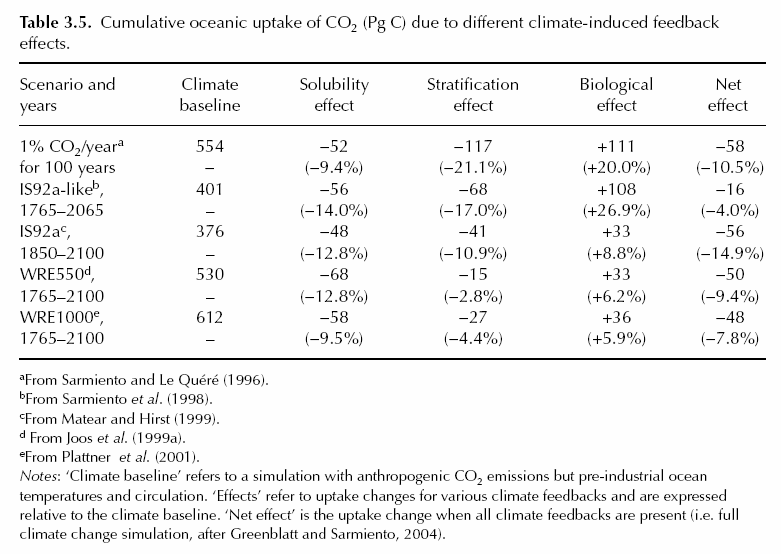
Table 3.5.
CO2 solubility has a strong inverse relationship with temperature. Greenblatt and Sarmiento (2004) estimate that, as the surface ocean warms over this century, ~9–14% of the CO2 that would have been stored in the ocean will be retained in the atmosphere by 2100 (a positive climate feedback). The thermodynamics of this process are well known and, consequently, the uncertainties are reasonably low.
However, there are other processes that are not fully understood. For example, increased stratification of the water column due to warming and changes in the hydrological cycle is expected to cause a decrease in the exchange of carbon and nutrients between water masses, particularly in high latitudes. The decreased carbon exchange makes it more difficult to move the anthropogenic CO2 into the ocean interior, thus decreasing the oceanic uptake efficiency and providing a positive feedback (Table 3.5). This increased stratification, however, also increases CO2 drawdown by biological activity in the Southern Ocean (negative feedback) where there is an excess of surface nutrients and the organisms are generally light-limited. The different model studies disagree on the magnitude of these two competing effects and, in some cases, do not even agree on whether the combination of these two effects will provide a positive or negative feedback (Table 3.5).
Modelling studies have suggested that the ocean will ultimately absorb up to 70–85% of the CO2 released by human activity (Le Quéré and Metzl, 2004). Including a carbon system feedback where carbonate sediments in the ocean are dissolved by the lowered pH of the waters suggests that the ocean may be the ultimate storage place for as much as 90% of the anthropogenic CO2 (Archer et al., 1997). The dissolution of carbonate sediments reverses Eq. 3.3 and increases the carbon storage capacity of the ocean. However, because of the slow mixing time to get the anthropogenic CO2 into the deep ocean, this capacity may not be realized for hundreds or thousands of years. When considering the role of carbon system and carbon–climate feedbacks, it is important to understand the timescale of these processes. With typical lifetimes ranging from weeks to months, biological processes have the potential to respond very quickly to carbon system or climate changes. Large-scale circulation changes are likely to be relevant on annual to decadal timescales, and sediment dissolution processes are presumed to be relevant on centennial to millennial timescales.
As long as atmospheric CO2 continues to rise, the ocean will continue to take up CO2. Long-term feedbacks like dissolution of carbonate sediments may enhance the oceanic uptake but most indications are that the shorter-term feedbacks may reduce the rate of CO2 uptake on the decadal to centennial timescales. Although there are considerable differences in the relative magnitudes of each of the individual feedback processes described in Table 3.5, all the models showed a net decrease in the overall uptake of CO2 by the ocean over time (Greenblatt and Sarmiento, 2004). In the OCMIP-2 models, which utilized a constant biological activity and circulation, the estimated oceanic uptake of anthropogenic CO2 by 2100 ranged from 4 to 8 Pg C/year, depending on the CO2 emission scenario used in the model (Watson and Orr, 2003). This estimate has a factor of 2–4 times higher than the current value of 2 ± 0.5 Pg C/year but still lags behind the projected rate of CO2 emissions. This means that a larger fraction of the CO2 emissions will be retained by the atmosphere in the future, thus enhancing the overall climate change impact.Of the ocean–atmosphere–land three-component system, ocean contains by far the most natural carbon. There is no realizable physical limit to the uptake capacity of the ocean and it is estimated that on millennial timescales the ocean will ultimately store up to 90% of the CO2 released by human activity. However, on timescales more relevant to human society, the uptake rate of CO2 is controlled by a complicated matrix of physical, chemical and biological processes. Studies suggest that the ocean has been the primary sink for excess CO2 released to the atmosphere over the last 200 years, but the ocean’s role may be changing over the next few decades to centuries.
Because the anthropogenic signal in the ocean is relatively small compared to the natural background concentrations and relative to the observed seasonal to interannual variations, it has been difficult to directly quantify the uptake and storage of anthropogenic CO2 in the ocean. This has been further hampered by a paucity of data. The current estimates have been based primarily on indirect approaches or on a number of simplified assumptions, ignoring a number of potential carbon cycle and carbon–climate feedbacks. The potential role of these feedback processes in the ocean carbon cycle is just beginning to be understood and fully appreciated. As we obtain more data on processes and improve their representation in models, we will be better equipped to estimate the long-term role of the ocean in the global carbon cycle and its impact on future climate change.
Return to Abstract