
U.S. Dept. of Commerce / NOAA / OAR / PMEL / Publications
Fig. 3.1. Schematic representation of the pre-industrial ocean carbon cycle. Fluxes (arrows) are in Pg C/year and reservoir sizes (numbers in square brackets) are in Pg C. (Modified from Sabine et al., 2004a.) Abbreviations: PIC, particulate inorganic carbon; DOC, dissolved organic carbon; DIC, dissolved inorganic carbon.
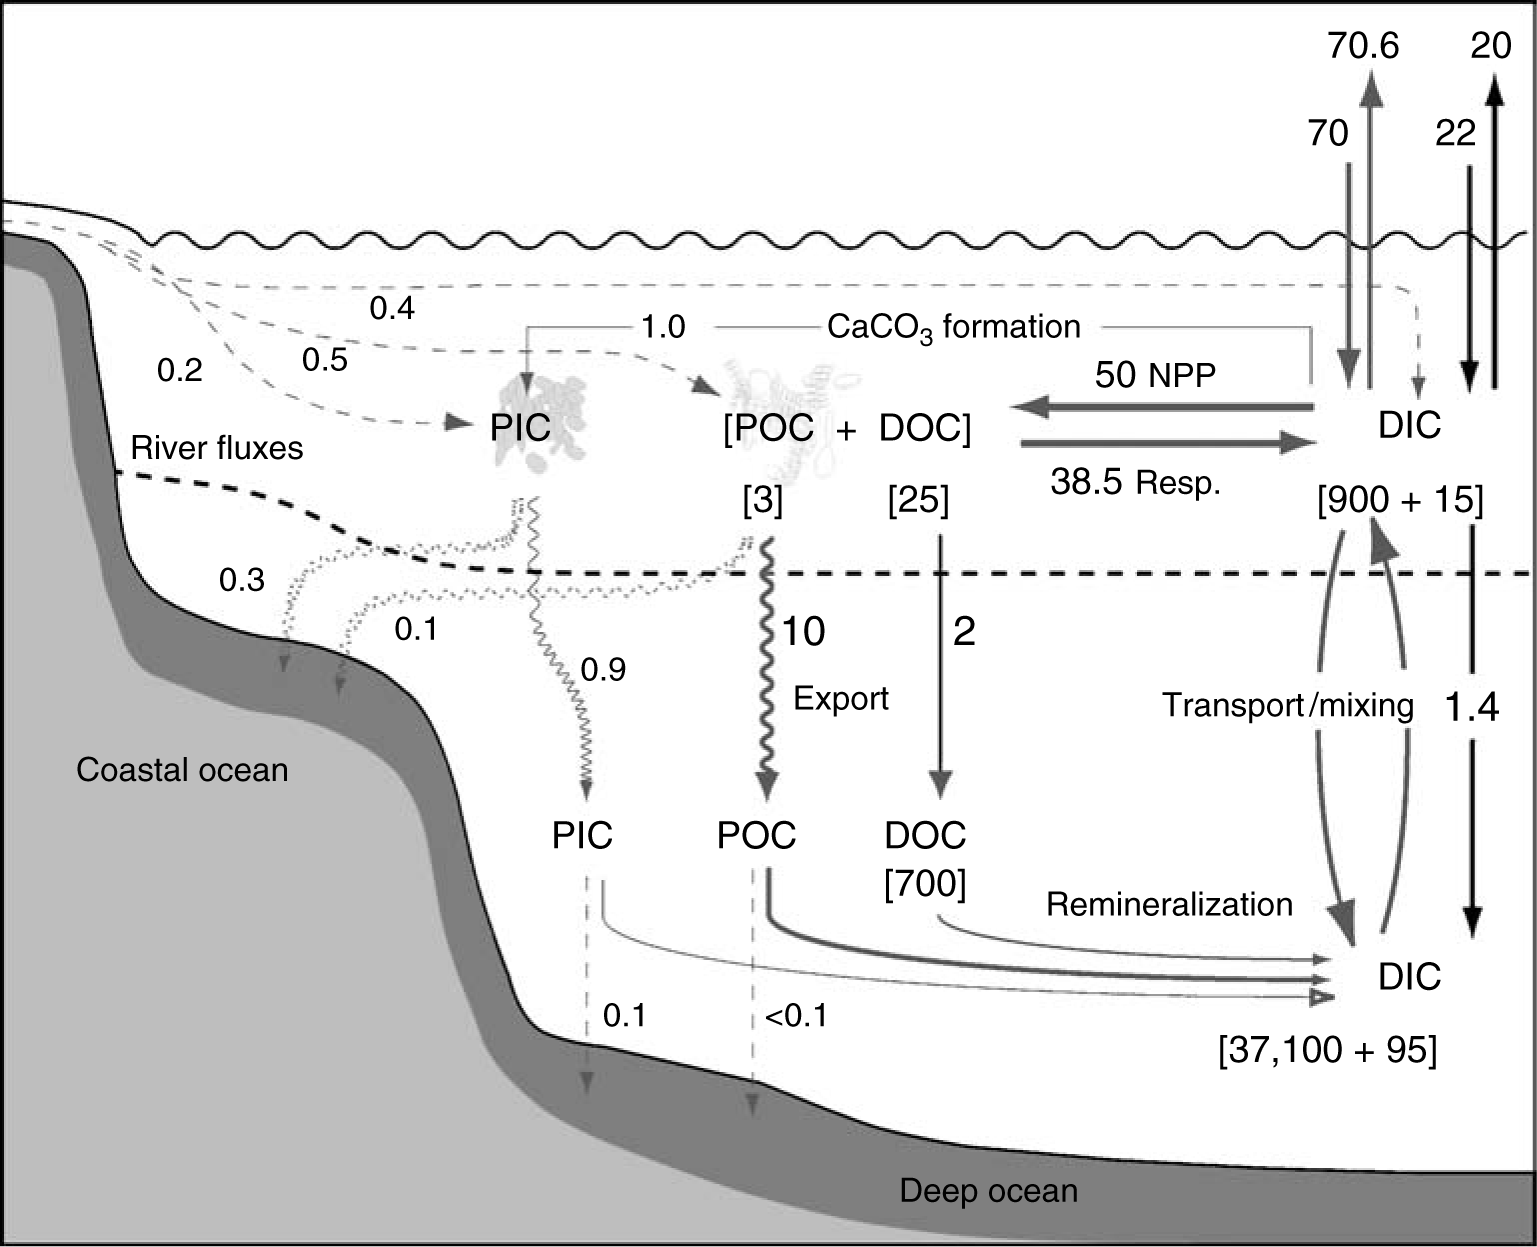
Fig. 3.2. Schematic representation of the ocean carbon cycle with pre-industrial fluxes and reservoir sizes (upright) and average values for the 1980s and 1990s (italic). Fluxes (arrows) are in Pg C/year and reservoir sizes (numbers in square brackets) are in Pg C. (Modified from Sabine et al., 2004a.)
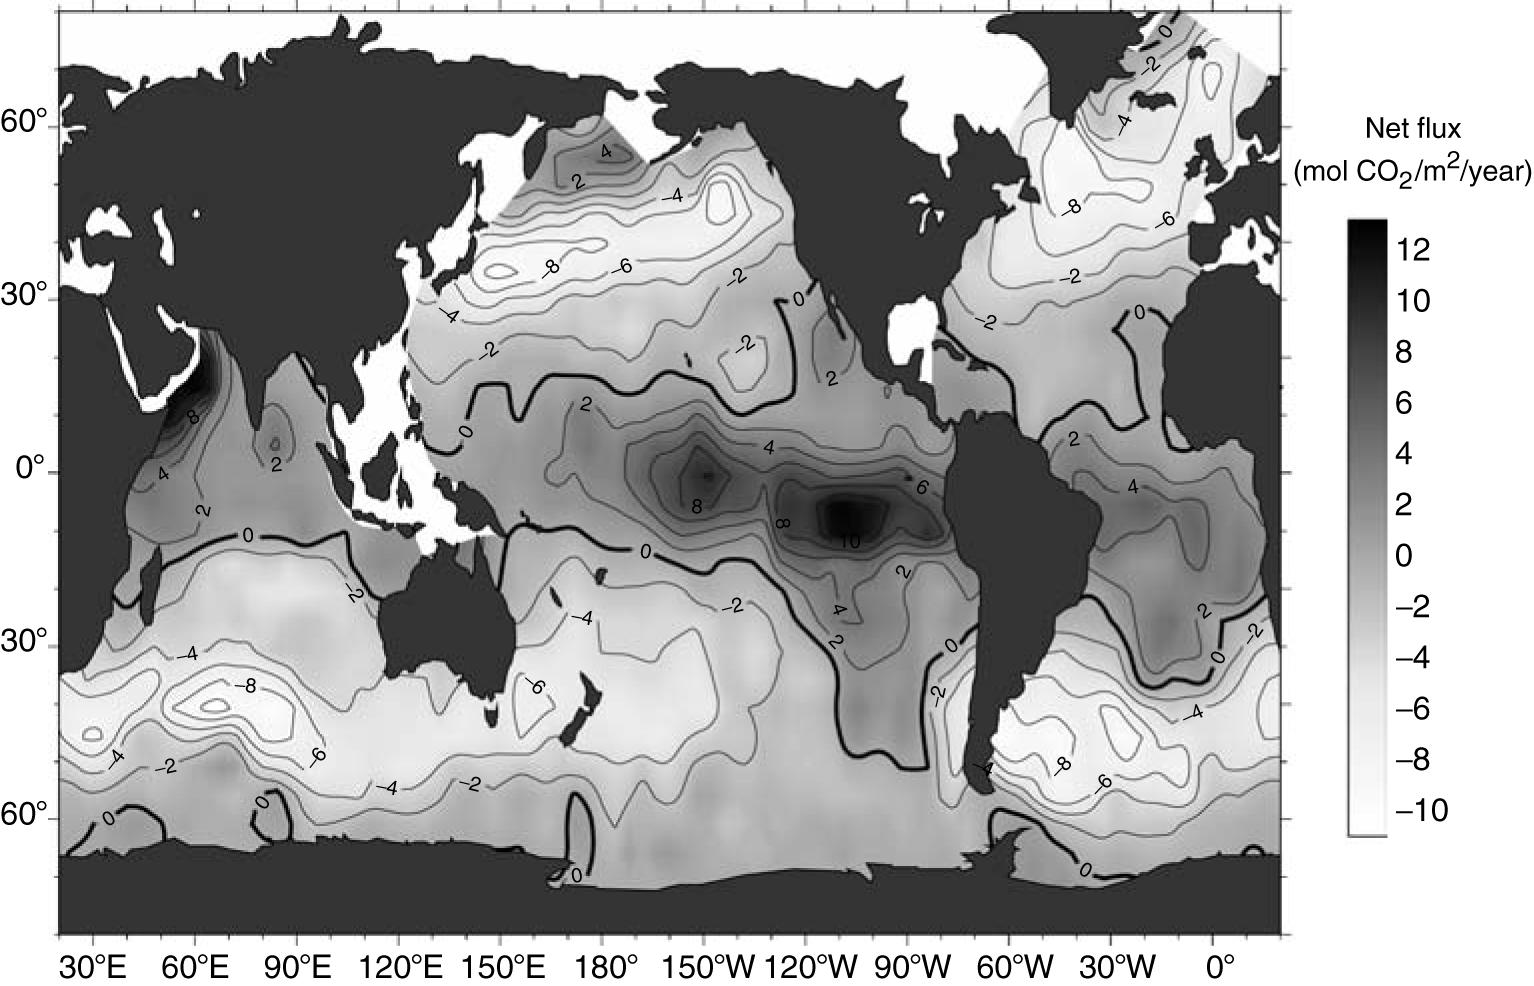
Fig. 3.3. Global climatology of the annual net sea–air CO2 flux (mol CO2/m2/year) based on interpolation of sea–air pCO2 differences as in 1995. (From Takahashi et al., 2002.)
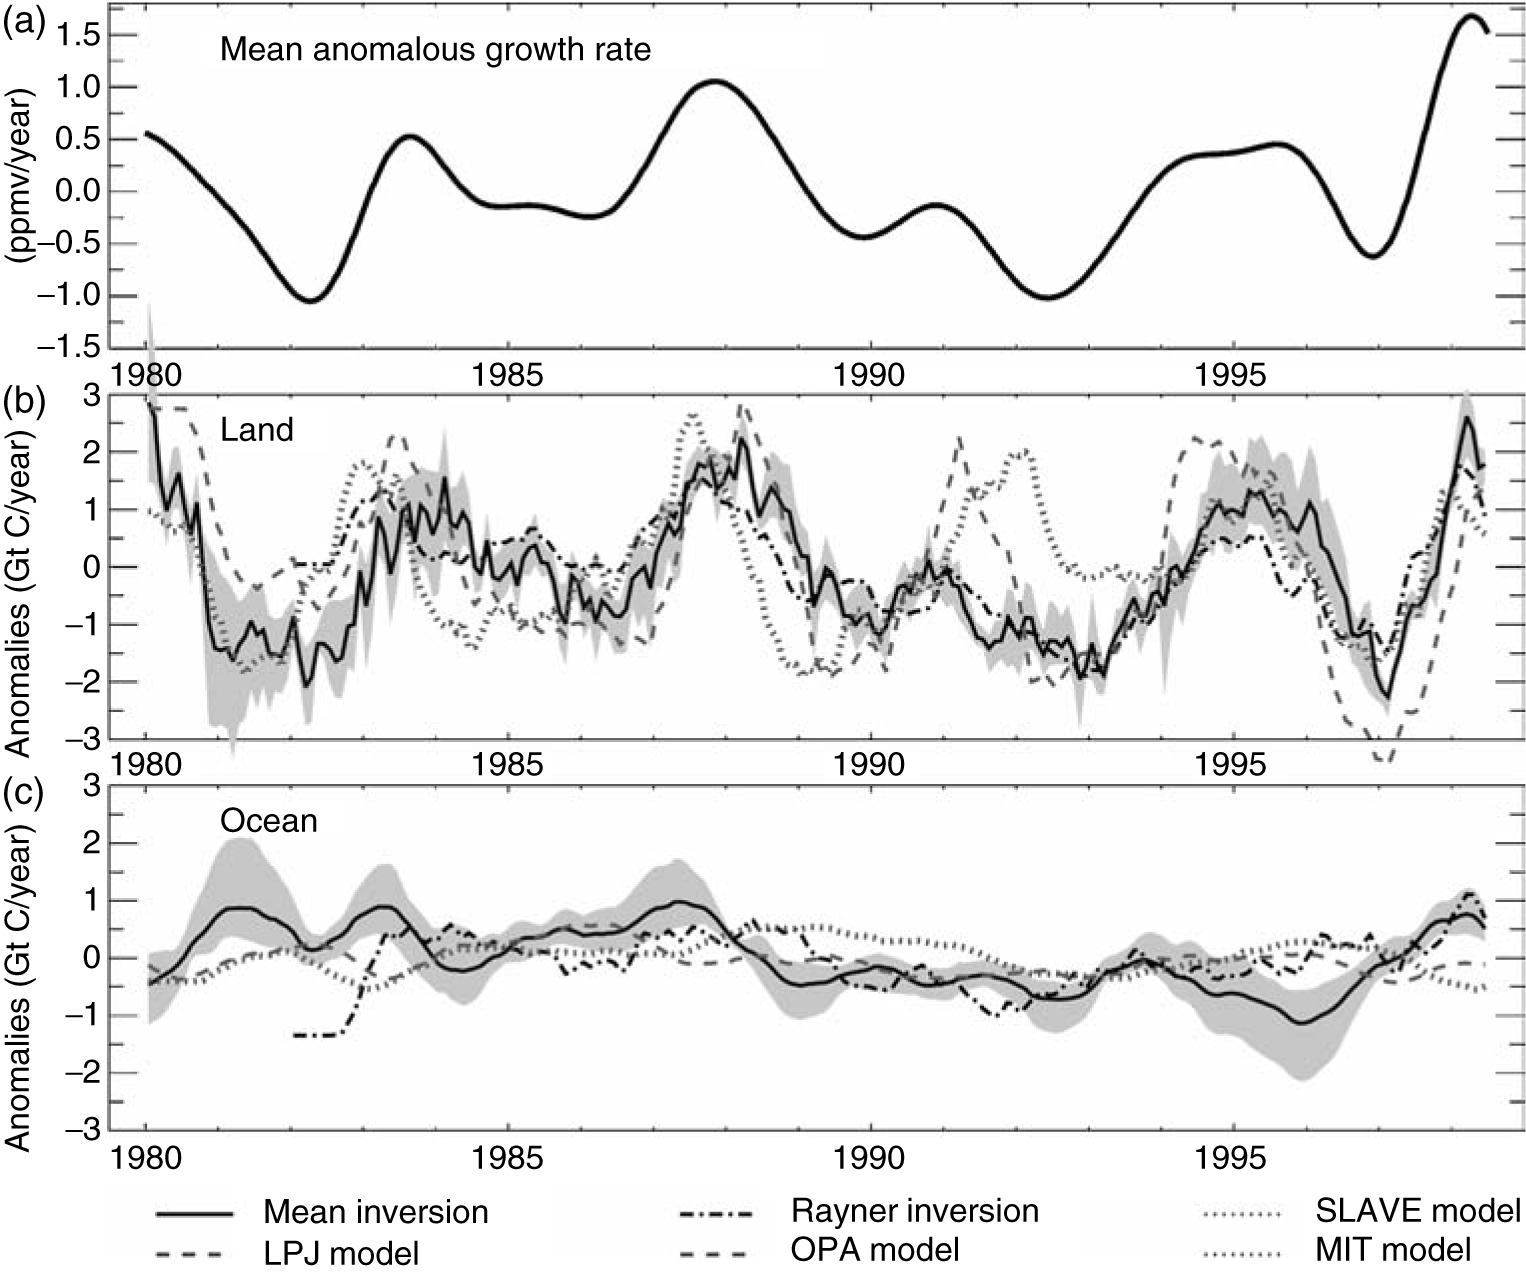
Fig. 3.4. Comparison of (a) atmospheric mean annual growth rate, (b) land CO2 flux anomalies and (c) ocean CO2 flux anomalies between 1980 and 1995 (in Gt C/year). The grey zone denotes the range of the inversion models, and the dark line denotes the mean. The coloured lines show the ocean models. (After Peylin et al., 2005.)
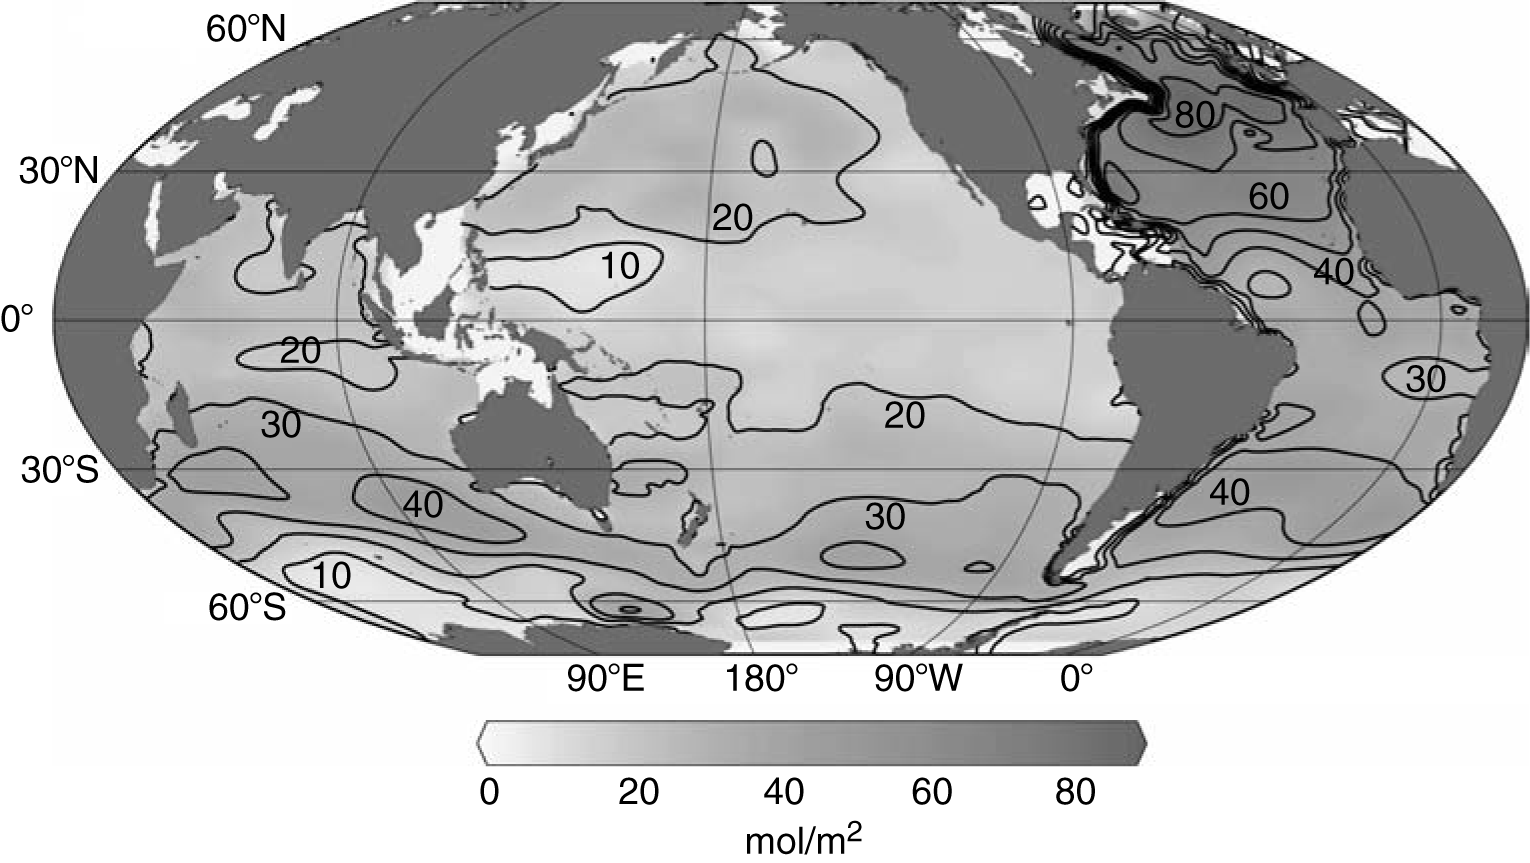
Fig. 3.5. Global map of anthropogenic CO2 column inventory in mol/m2. (From Sabine et al., 2004b.)

Fig. 3.6. Representative sections of anthropogenic CO2 (µmol/kg) from the (a) Atlantic, (b) Pacific and (c) Indian oceans. Insets show maps of the station locations used to generate the sections.
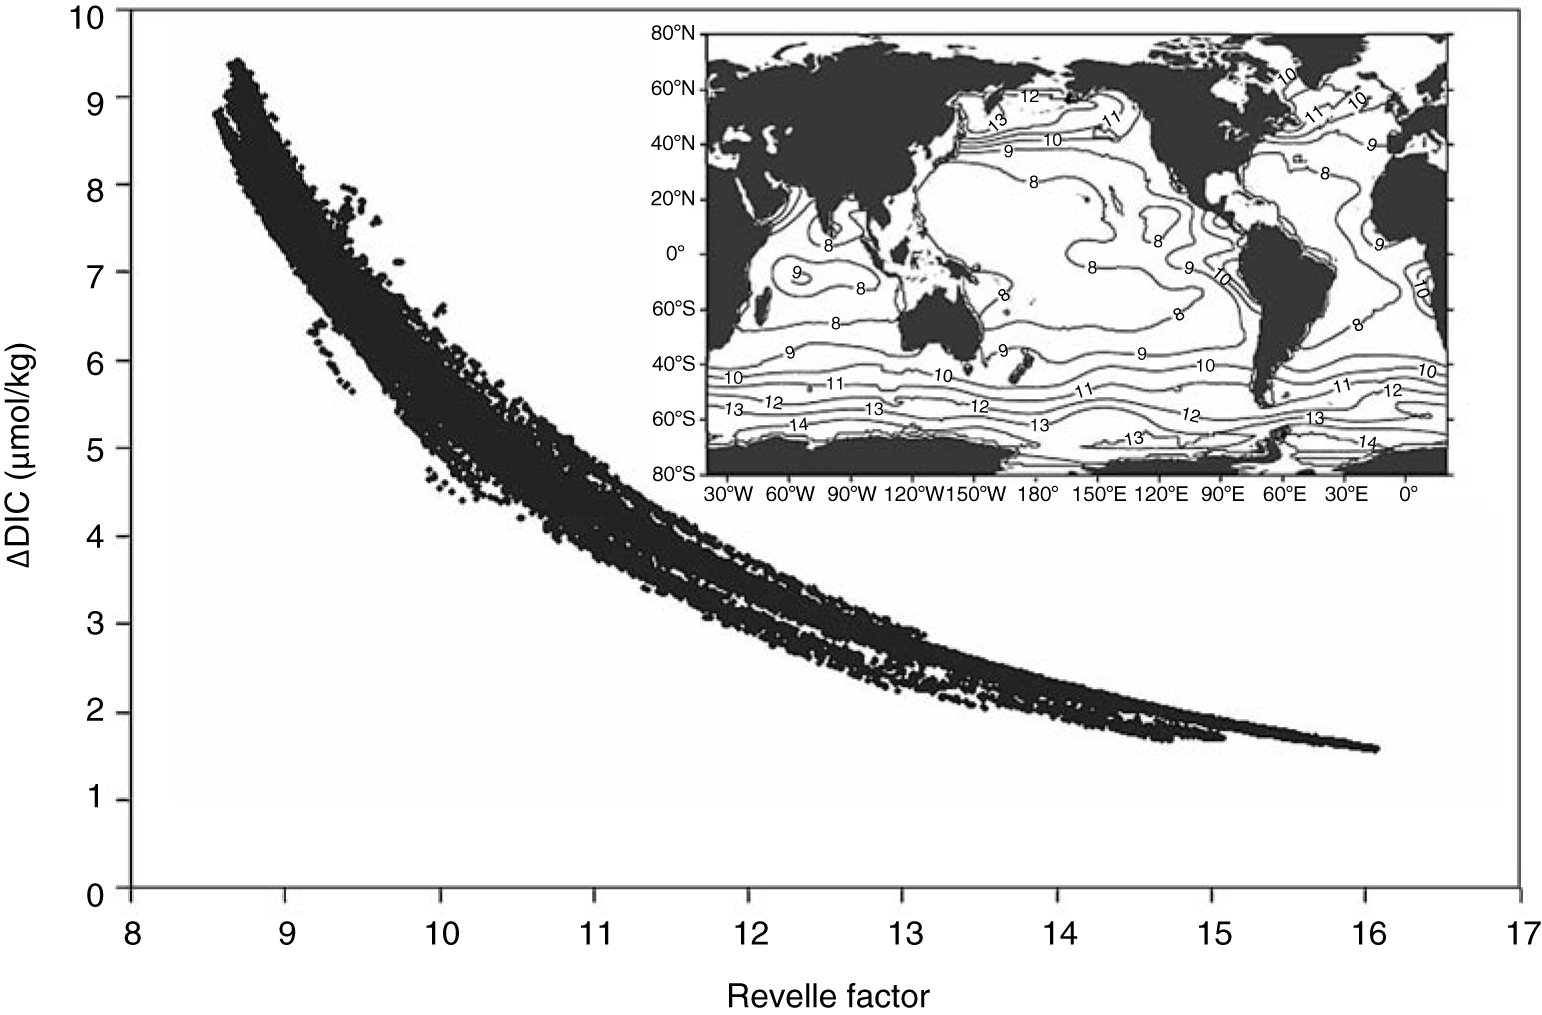
Fig. 3.7. Plot of the change in dissolved inorganic carbon for a 10 ppm change in pCO2 as a function of Revelle factor for surface waters (<60 m) from the GLODAP bottle data-set. Inset shows a map of surface Revelle factor from the same data-set.
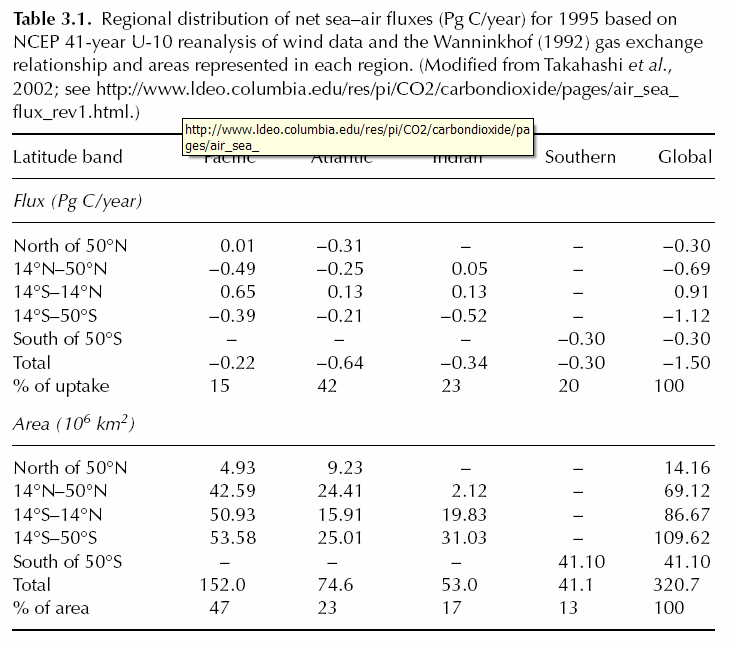
Table 3.1.
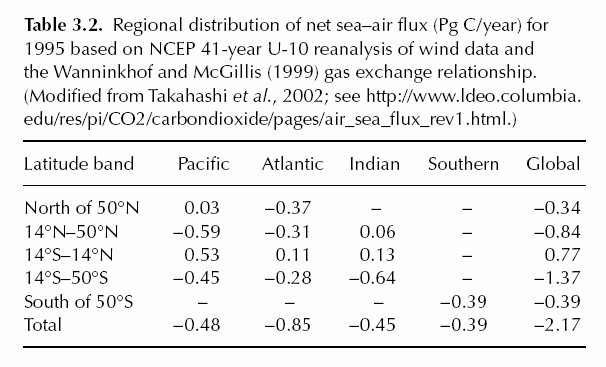
Table 3.2.
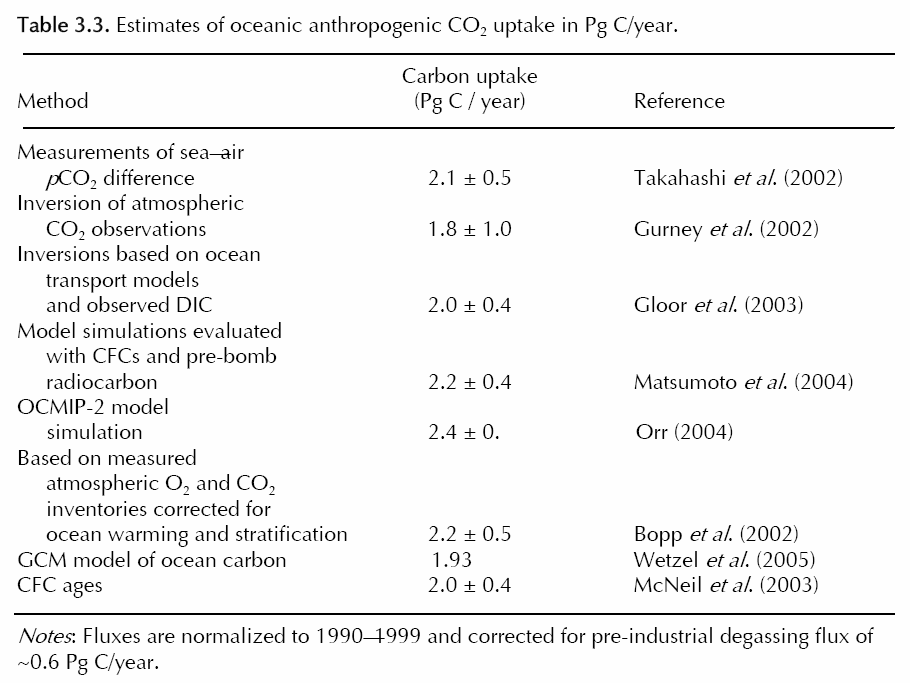
Table 3.3.
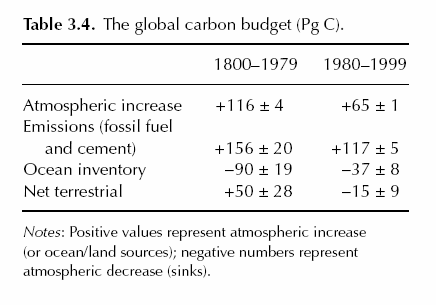
Table 3.4.
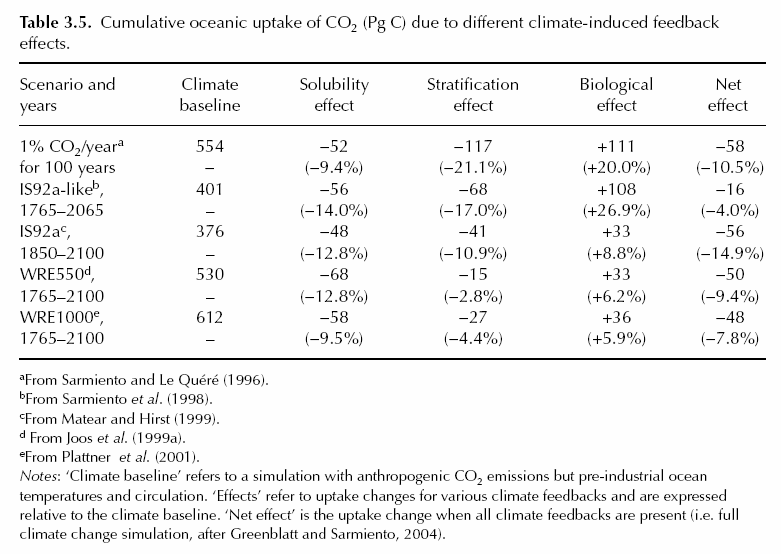
Table 3.5.
Return to References or go back to Abstract