U.S. Dept. of Commerce / NOAA / OAR / PMEL / Publications
The Oceanic Sink for Anthropogenic CO2
Christopher L. Sabine,1* Richard A. Feely,1 Nicolas Gruber,2 Robert M. Key,3 Kitack Lee,4 John L. Bullister,1 Rik Wanninkhof,5 C. S. Wong,6 Douglas W. R. Wallace,7 Bronte Tilbrook,8 Frank J. Millero,9 Tsung-Hung Peng,5 Alexander Kozyr,10 Tsueno Ono,11 Aida F. Rios12
1National Oceanic and Atmospheric Administration (NOAA) Pacific Marine Environmental Laboratory, 7600 Sand Point Way NE, Seattle, WA 98115, USA.
2University of California–Los Angeles, Institute of Geophysics and Planetary Physics and Department of Atmospheric and Oceanic Sciences, Los Angeles, CA 90095, USA.
3Princeton University, Program in Atmospheric and Oceanic Science, Forrestal Campus/Sayre Hall, Princeton, NJ 08544, USA.
4Pohang University of Science and Technology, San 31, Nam-gu, Hyoja-dong, Pohang 790-784, South Korea.
5NOAA Atlantic Oceanographic and Meteorological Laboratory, 4301 Rickenbacker Causeway, Miami, FL 33149, USA.
6Institute of Ocean Sciences, Climate Chemistry Laboratory, Post Office Box 6000, Sidney, BC V8L 4B2, Canada.
7Forschungsbereich Marine Biogeochemie, Leibniz Institut für Meereswissenschafte, an der Universität Kiel, (IFM-GEOMAR), Düsternbrooker Weg 20, D-24105 Kiel, Germany.
8Commonwealth Scientific and Industrial Research Organisation (CSIRO) Marine Research and Antarctic Climate and Ecosystem Cooperative Research Center, Hobart, Tasmania 7001, Australia.
9University of Miami, Rosenstiel School of Marine and Atmospheric Science, Division of Marine and Atmospheric Sciences, 4600 Rickenbacker Causeway, Miami, FL 33149, USA.
10Carbon Dioxide Information Analysis Center, Oak Ridge National Laboratory, U.S. Department of Energy, Mail Stop 6335, Oak Ridge, TN 37831–6335, USA.
11Frontier Research System for Global Change/Institute for Global Change Research, Sumitomo Hamamatsu-cho, Building 4F, 1-18-16 Hamamatsutyo, Minato-ku, 105-0013, Japan.
12Instituto de Investigaciones Marinas, Consejo Superior de Investigationes Cientificas, c/Eduardo Cabello, 6, 36208 Vigo, Spain.
Science, 305(5682),
367–371 (2004)
Copyright ©2004 by The American Association for the Advancement of Science. Further electronic
distribution is not allowed.
Gallery of Figures
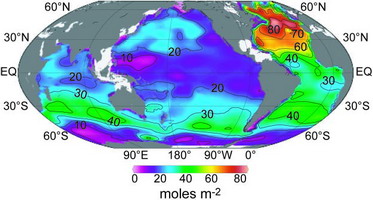
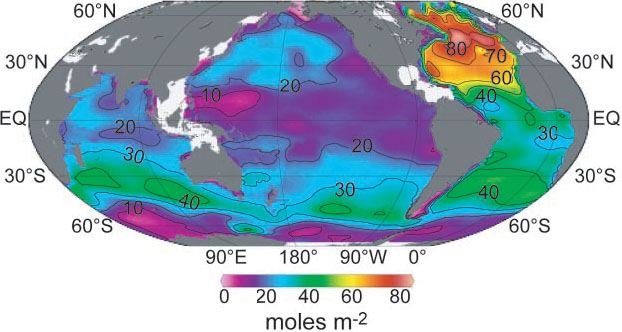
Fig. 1. Column inventory of anthropogenic CO in the ocean (mol m
 ). High inventories are associated with deep water formation in the North Atlantic and intermediate and mode water formation between 30° and 50°S. Total inventory of shaded regions is 106 ± 17 Pg C.
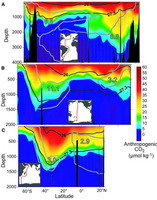
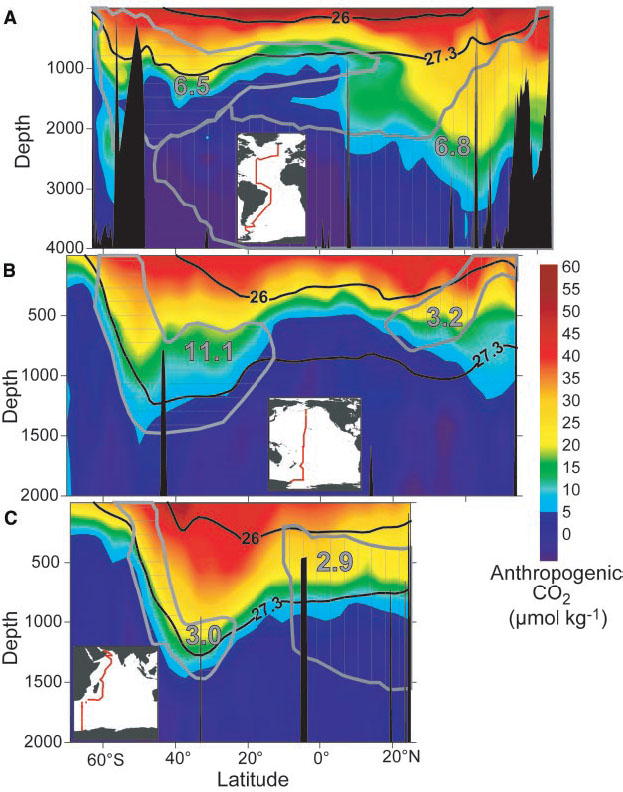
Fig. 2. Representative sections of anthropogenic CO ( mol kg
 ) from (A) the Atlantic, (B) Pacific, and Indian (C) oceans. Gray hatched regions and numbers indicate distribution of intermediate water masses (and North Atlantic Deep Water) on the given section and the total inventory of anthropogenic CO (Pg C) within these water masses. The southern water masses in each ocean represent Antarctic Intermediate Water. The northern water masses represent the North Atlantic Deep Water (A), North Pacific Intermediate Water (B), and Red Sea/Persian Gulf Intermediate Water (C). The two bold lines in each panel give the potential density [
 = (density – 1) × 1000] contours for the surfaces shown in Fig. 4. Insets show maps of the cruise tracks used. Note that the depth scale for (A) is twice that of the other figures, reflecting the deeper penetration in the North Atlantic.
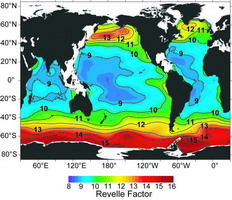
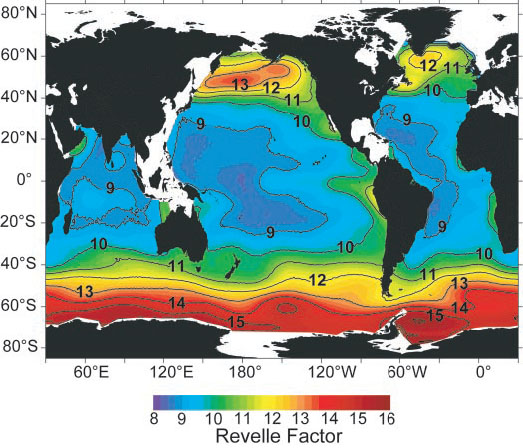
Fig. 3. Map of the 1994 distribution of Revelle factor, ( PCO/DIC)/ (PCO/DIC), averaged for the upper 50 m of the water column. A high Revelle factor indicates that, for a given atmospheric CO perturbation, the oceanic equilibrium concentration of anthropogenic CO will be lower than that for low–Revelle factor waters. The current Revelle factors are about one unit higher than they were in the preindustrial ocean.
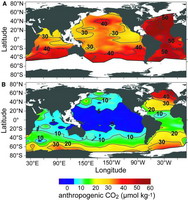
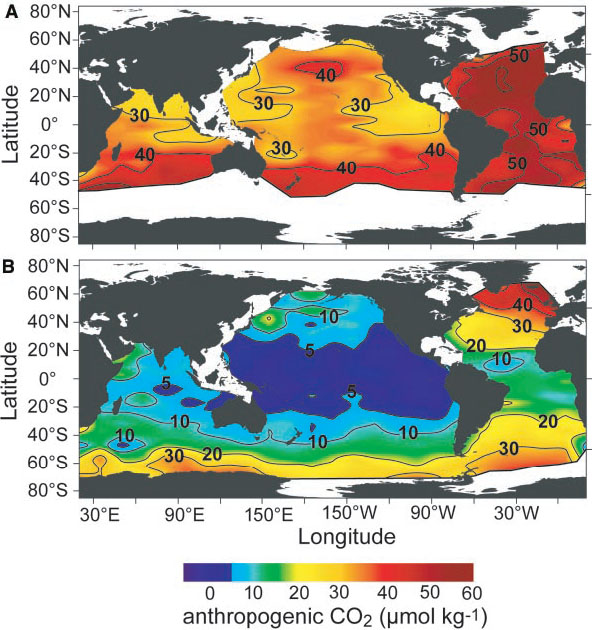
Fig. 4. Maps of anthropogenic CO on the (A) 26.0 and (B) 27.3 potential density surfaces. Bold lines at the edge of the colored region indicate areas where the density surface outcrops. The highest values are generally observed closest to the outcrop and decrease toward the equator.
Table 1. Anthropogenic CO budget for the anthropocene (1800 to 1994) and for the decades of the 1980s and 1990s.
Return to Abstract
PMEL Outstanding Papers
PMEL Publications Search
PMEL Homepage