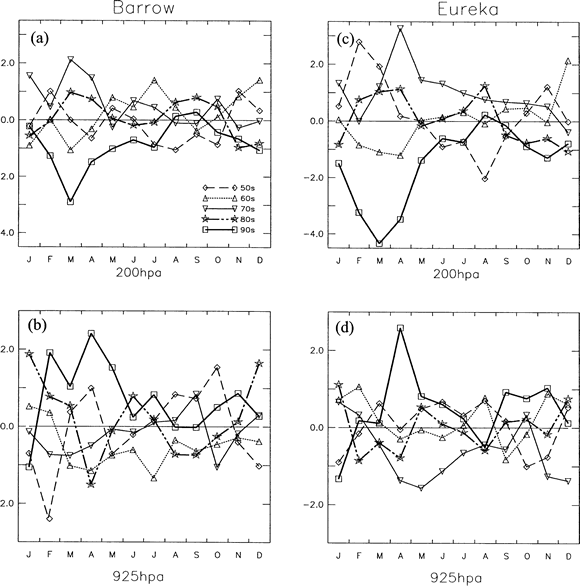
FIG. 1. The monthly temperature anomaly averaged over each decade from the 1950s to 1990s at the closest grid point from (a), (b) Barrow, Alaska, and (c), (d) Eureka, Canada based on NCEP-NCAR reanalysis at (a), (c) 200 and (b), (d) 925 hPa.
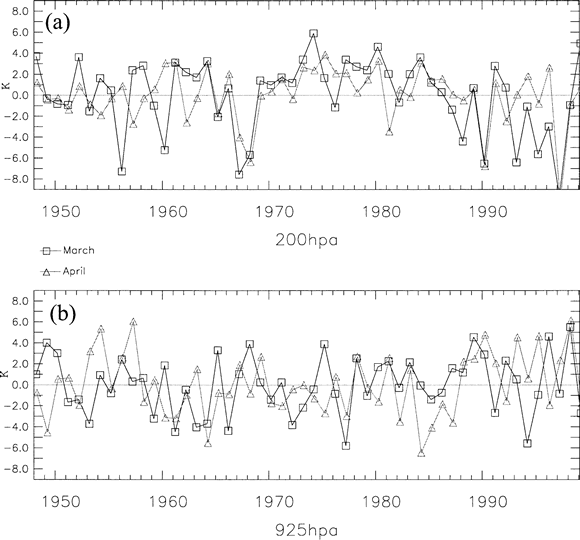
FIG. 2. The monthly temperature anomaly at Barrow for Mar (solid line with square) and Apr (gray line with triangle) at (a) 200 and (b) 925 hPa.
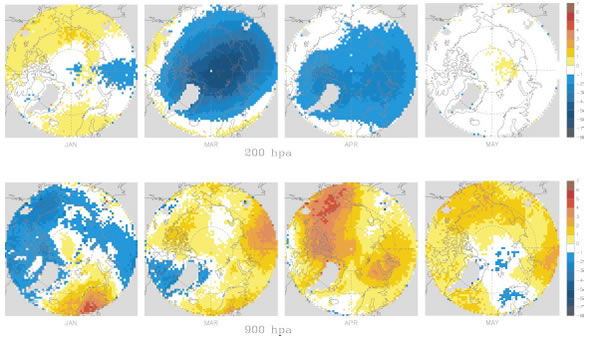
FIG. 3. The decadal monthly mean temperature change between 1990s (1989–98) and 1980s (1980–88) at (top) 200 and (bottom) 900 hPa based on TOVS Path-P gridded satellite dataset. From left to right, the panels are for Jan, Mar, Apr, and May. Greenland is a data void.
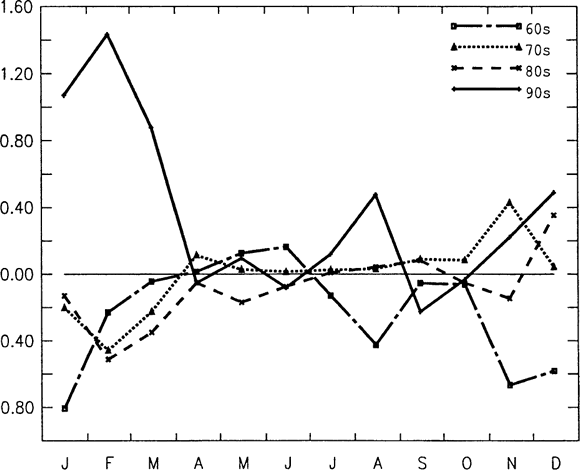
FIG. 4. Decadal-averaged monthly AO index based on data provided by D. Thompson from his AO Web site (see text for address) for the 1960s–1990s.
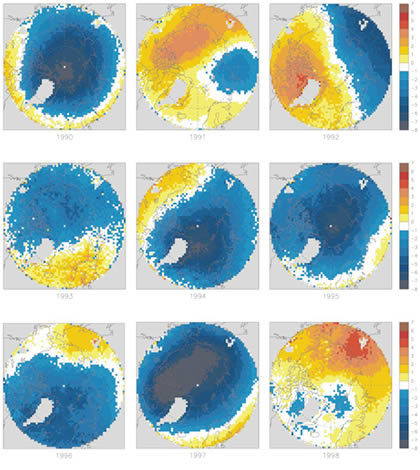
FIG. 5. Mean temperature anomalies at 200 hPa in Mar for the 1990s, derived from gridded TOVS Path-P satellite temperature data.
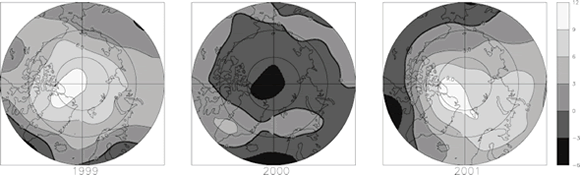
FIG. 6. Mean temperature anomalies at 200 hPa in Mar for (left) 1999, (middle) 2000, and (right) 2001 based on the NCEP-NCAR reanalysis. The climatology is based on 1948–99, as in Figs. 1 and 2.
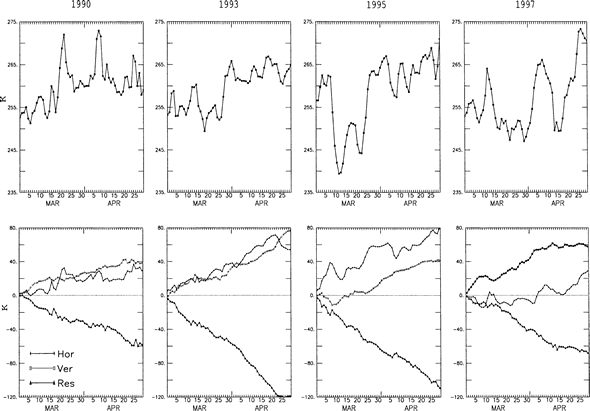
FIG. 7. The heating terms at 850 hPa based on Eq. (1). (top) The daily temperature from 1 Mar to 30 Apr. (bottom) The time accumulated horizontal heat flux divergence (solid line with *), the time accumulated vertical heat flux divergence (solid line with square), and the residual term (solid line with triangle) that include diabatic heating due to radiation, sensible, and latent heat. From left to right, the years are 1990, 1993, 1995, and 1997.
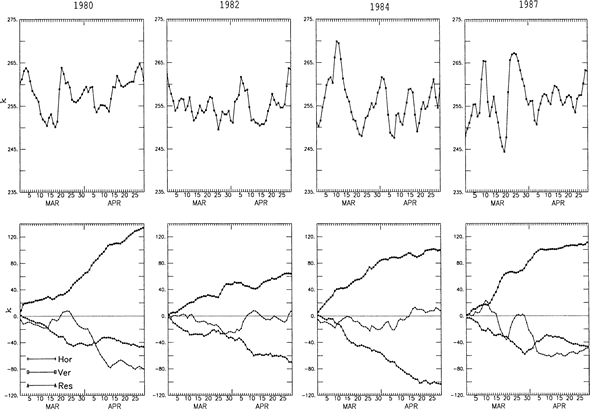
FIG. 8. As in Fig. 7, but for the "cold" years in the 1980s. From left to right, the years are 1980, 1982, 1984, and 1987.
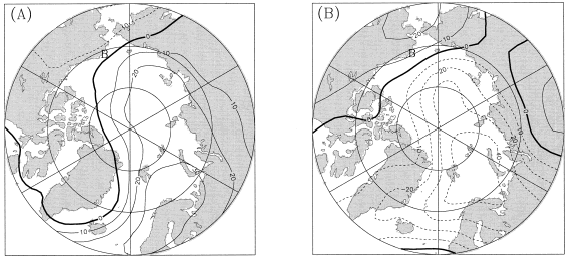
FIG. 9. Geopotential height anomalies at 925 hPa averaged over Mar and Apr for the four cold years in the 1980s: (a) 1980, 1982, 1984, and 1987; and the four warm years in the 1990s: (b) 1990, 1993, 1995, and 1997. The data are from the NCEP-NCAR reanalysis. The "B" indicates the location of Barrow, Alaska.
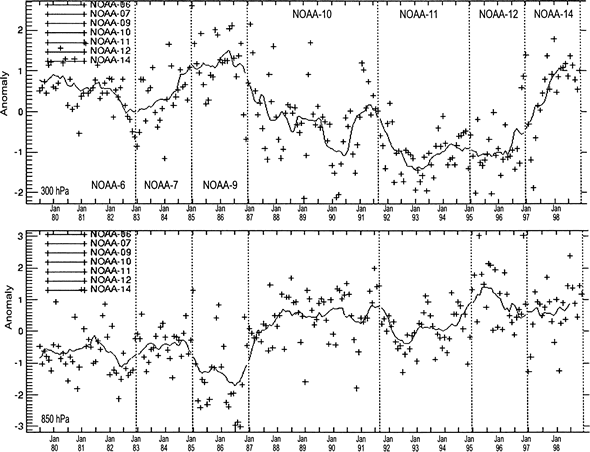
FIG. A1. Arctic basin average monthly mean temperature anomalies for the TOVS Path-P dataset at (top) 300 and (bottom) 850 hPa. The crosses in the figure are the monthly anomalies, while the curves are the 1-yr running mean. Each satellite period is separated by dashed vertical line. Figure is from http://psc.apl.washington.edu/pathp/html.
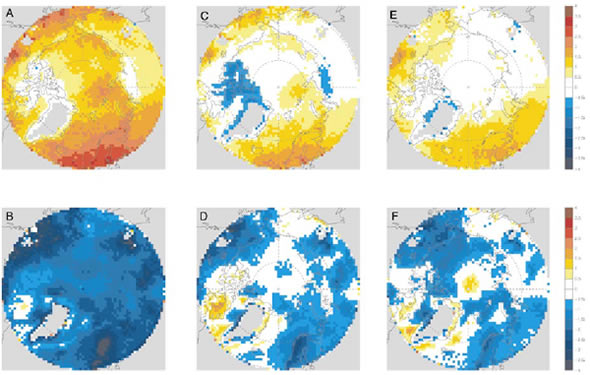
FIG. A2. (a), (c), (e) Mar 300-hPa and (b), (d), (f ) Apr 850-hPa monthly mean temperature differences between (a), (b) original TOVS Path-P data and NCEP-NCAR reanalysis for the period of 1980–86 and (c), (d) between the corrected TOVS Path-P and NCEP-NCAR reanalysis for the same period. (e), (f ) The differences for the period of 1987–96 using the original TOVS Path-P data.
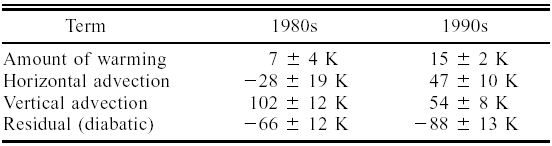
TABLE 1. Means and standard errors of the means for the heat budgets at 850 hPa for four notable years in the 1980s and 1990s.
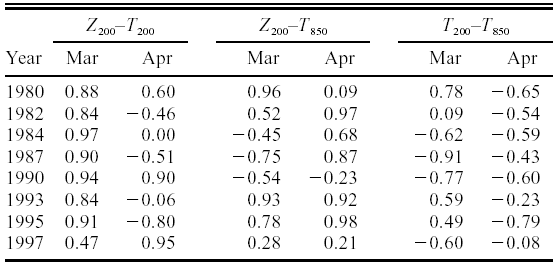
TABLE 2. Spatial correlations between selected anomalies for geopotential height (Z) and temperature (T) for Mar and Apr.
Return to previous section or go to Abstract