The Correction of the TOVS Path-P Temperature Fields before 1987
The TOVS Polar Pathfinder (Path-P) satellite dataset (Francis
and Schweiger 2000) consists of gridded daily Arctic atmospheric data
derived from various National Oceanic and Atmospheric Administration (NOAA)
satellites. It covers the region north of 60° latitude on a 100 × 100
km![]() horizontal
resolution. This dataset is the first of its kind that can diagnose atmospheric
characteristics across the Arctic basin in a consistent manner and with good
horizontal resolution. Designed to address the particular need of the polar
research community, the dataset is centered on the North Pole, and available
from July 1979 to December 1998. To our knowledge, the only published work
regarding the accuracy of TOVS Path-P dataset is by Schweiger
et al. (2002). They compared the TOVS Path-P data with the Surface Heat
Budget of the Arctic (SHEBA) measurement, and concluded that uncertainties
in temperature retrieval are below "within-season" variability
during all times of the year.
horizontal
resolution. This dataset is the first of its kind that can diagnose atmospheric
characteristics across the Arctic basin in a consistent manner and with good
horizontal resolution. Designed to address the particular need of the polar
research community, the dataset is centered on the North Pole, and available
from July 1979 to December 1998. To our knowledge, the only published work
regarding the accuracy of TOVS Path-P dataset is by Schweiger
et al. (2002). They compared the TOVS Path-P data with the Surface Heat
Budget of the Arctic (SHEBA) measurement, and concluded that uncertainties
in temperature retrieval are below "within-season" variability
during all times of the year.
Figure A1 shows the monthly temperature anomalies for the TOVS Path-P dataset for each satellite period. The top panel shows the anomaly at 300 hPa, and the bottom one is at 850 hPa. These curves are obtained from the Applied Physics Laboratory, University of Washington (available online at http://psc.apl.washington.edu/pathp/html/validation/calibration_frames.html). The crosses in the figure show the monthly departure from the entire period, while the curves are the 1-yr running mean. It is obvious from the figure that in the early 1980s at 300 hPa the temperature was dominated by positive anomalies, while at 850 hPa it was dominated by negative anomalies. However, we suspect that part of these anomalies shown in Fig. A1 are artificially introduced due to the application of incorrect calibrations.
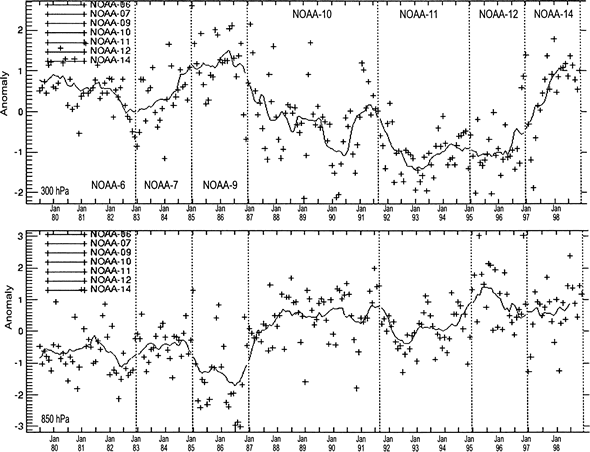
FIG. A1. Arctic basin average monthly mean temperature anomalies for the TOVS Path-P dataset at (top) 300 and (bottom) 850 hPa. The crosses in the figure are the monthly anomalies, while the curves are the 1-yr running mean. Each satellite period is separated by dashed vertical line. Figure is from http://psc.apl.washington.edu/pathp/html.
It is known that for any satellite data, changes in the instrumentation may introduce time-varying biases in time series. Consequently, corrections used in the calibration procedure need to be computed; they are termed "deltas" in the TOVS Path-P dataset. Deltas were specifically calculated only for NOAA-10, -11, and -12, which is valid for the period from 1 January 1987 to 31 December 1996. Before that period, the deltas from NOAA-10 were used for NOAA-6–NOAA-9(12 July 1979–31 December 1986). To remove the possible unrealistic trend in the 1980s as shown in Fig. A1, which might be introduced due to the improper deltas, we adjusted the TOVS temperature data at each level in a conservative manner. We first determined the averages of temperature anomaly at each level for each satellite period before 1986 relative to the NOAA-10 period. Then we subtracted these averages from the original TOVS temperature field to generate a new temperature called TOVS-corrected [TOVS(cor)]. Figure A2 shows the differences in the mean March–April temperature between TOVS and NCEP-NCAR reanalysis during the 1980s. Figures A2a,c,e show the differences for March at 300 hPa, and Figs. A2b,d,f show the differences for April at 850 hPa. Figures A2a,b show the differences between the original TOVS data and the reanalysis for the period 1980–86, while Figs. A2c,d show the differences between the corrected TOVS data and the reanalysis for the same period. At 300 hPa (Fig. A2a) it can be seen that the TOVS analysis is warmer than reanalysis by 1.5 K over the Arctic Ocean, and more than 2 K over land. At 850 hPa (Fig. A2b), the TOVS data are colder by more than 2 K over most of the area, with maximum around 4 K over the Norway, Sweden, and Alaska areas. With our correction, the differences at 300 hPa have been reduced to less than 0.5 K over most of the Arctic Ocean, and less than 1 K over most of the land area with exception of the western Scandinavian region (Fig. A2c). At 850 hPa, the differences have been reduced to less than 1 K over most of the polar region, and less than 2 K over North America and the Scandinavian region (Fig. A2d). Figures A2e,f show the differences for the period 1987–96 when the deltas are specifically calculated for each satellite period. It can be seen that after the correction, the pattern and magnitude of the differences are similar (Figs. A2c,e and Figs. A2d,f) to the period when the deltas are valid.
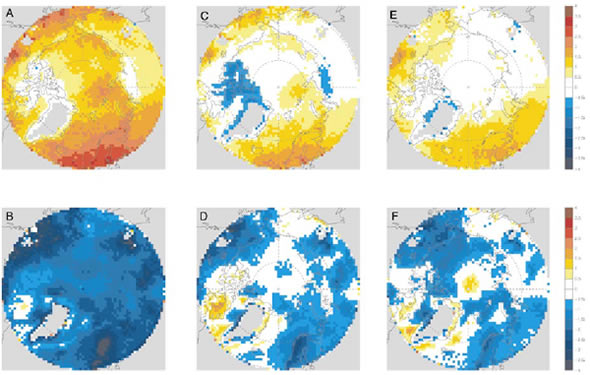
FIG. A2. (a), (c), (e) Mar 300-hPa and (b), (d), (f ) Apr 850-hPa monthly mean temperature differences between (a), (b) original TOVS Path-P data and NCEP-NCAR reanalysis for the period of 1980–86 and (c), (d) between the corrected TOVS Path-P and NCEP-NCAR reanalysis for the same period. (e), (f ) The differences for the period of 1987–96 using the original TOVS Path-P data.
We also compared the monthly mean temperatures from TOVS with the reanalysis for the 1990s, and for the period of the NOAA-10, -11, and -12 satellites. For both periods, the differences in temperature between the two datasets are less than 2 K at 850 hPa and less than 2.5 K at 300 hPa over land areas, and less than 1 K at both levels over the central Arctic Ocean. These differences are similar to those found for the 1979–86 period using our corrected TOVS dataset.
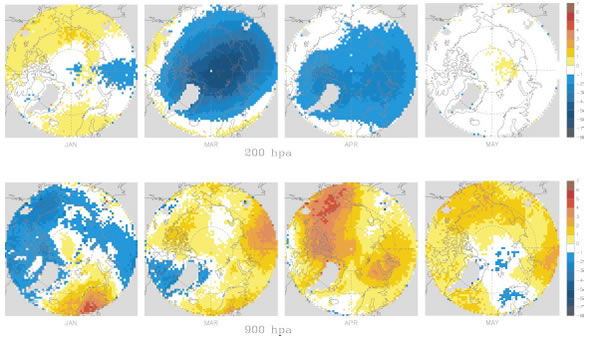
The decadal change in the temperature field in Fig. 3 shows a warming greater than 3 K over a large area at 900 hPa, and a cooling of more than 5 K at 200 hPa; both of these values are larger than the maximum 2 K differences we found between TOVS and the reanalysis. Because of our conservative approach to TOVS correction, the decadal differences we estimate using the corrected TOVS data are actually less than those based on the NCEP reanalysis alone. Since deltas are presently unavailable for the period of NOAA-6, -7, and -9, our simple adjustment appears to represent a reasonable correction. Other users of TOVS data need to keep in mind the impact of deltas for periods outside of 1987–96; updating these deltas should be a priority for Arctic research.
Return to previous section or go to next section