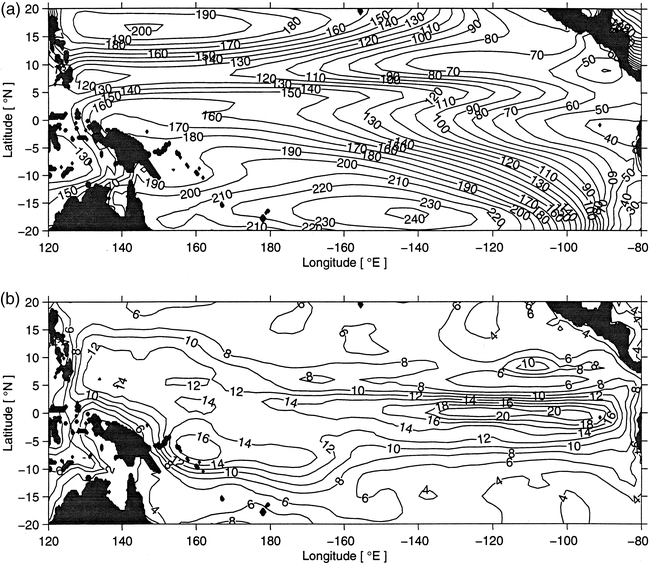
The mean (Fig. 2a) and standard deviation of monthly anomalies about the mean seasonal cycle (Fig. 2b) for Z20 were calculated over the time interval of Jan 1980-May 1999. The basic structure along the equator is as expected, with a deep thermocline beneath the western Pacific warm pool and a shallow thermocline in the eastern Pacific. A mean meridional ridge-trough system, analogous to the ridge-trough system in sea level (Wyrtki 1975b), is also apparent. The largest variability in Z20 is centered along the equator in the eastern Pacific, with a peak standard deviation of over 20 m near 110°W. Off-equatorial maxima are found in the western Pacific between 5°-10°N and S. Values greater than 12 m span the basin along the equator. The variability drops off at higher latitudes.
FIG. 2. (a) Temporal mean and (b) standard deviation about the mean seasonal cycle of Z20 over the interval Jan 1980-May 1999. Contour values are in meters. Shaded areas represent land.
To look at the structure of the variations in Z20 over time, an empirical orthogonal function (EOF) analysis (Emery and Thomson 1997) was performed on the 20-yr time series of Z20 in the equatorial region. Figure 3 shows the spatial structures and amplitudes of the first two EOF modes of Z20. These two modes represent 28% and 21%, respectively, of the total variance in Z20; higher modes each represent less than 7% of the total variance. The first mode can be viewed as an E-W tilting mode, with the axis near 150°W. This mode is similar to the "standing mode" suggested by Wang et al. (1999) on the basis of the National Centers for Environmental Prediction (NCEP) ocean model reanalysis results. The second mode, which explains nearly as much variance as the first mode, involves more of an N-S tilting along an axis centered near 5°N and a maximum variance on the equator in the eastern and central Pacific. This second EOF mode involves a discharge and recharge of warm water in the near-equatorial Pacific. The southern extent of this recharge mode is not well defined in these data, but the northern node is aligned with the mean pathway of the North Equatorial Counter-Current (NECC). The peak correlation (r = 0.77) between the two modes occurs with the first mode lagging the second mode by nine months. The peak is broad, with statistically significant correlations at the 95% level for lag/leads of 6-15 months.
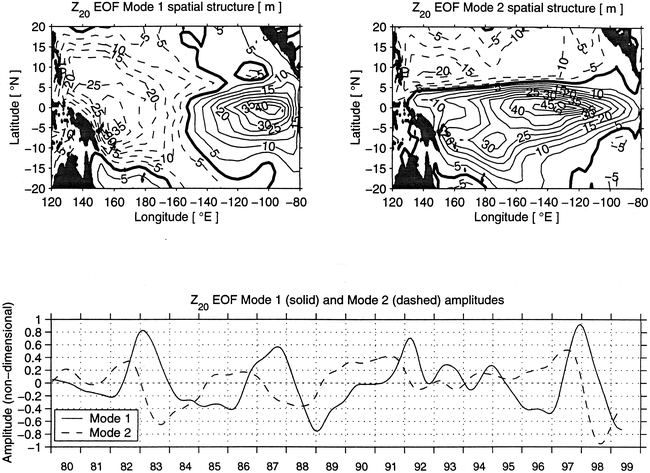
FIG. 3. First two empirical orthogonal functions (EOFs) fit to Z20. Upper panels denote spatial structure of the modes with contours (m); bold contour denotes zero. Shaded areas represent land. Lower panel shows mode amplitudes, which are nondimensional, as a function of time.
Water above the 20°C isotherm is defined as "warm water" in this study, and WWV is determined by spatial integration of Z20 over the region 5°S-5°N, 120°E-80°W. Figure 4 (near bottom) shows a time series of the WWV along with the zonal wind stress averaged over the same area (near top) and the SST in the Niño-3 region (top). The Niño-3 region is defined as 5°S-5°N, 150°-90°W, and the SST in this region is a commonly used indicator for the ENSO cycle (Trenberth 1997). The zonal winds show the expected westerly anomalies coincident with the warm Niño-3 SST events (warm SST occurring in 1982-83, 1986-87, 1991-92, 1993, 1994-95, and 1997-98). Figure 4 also indicates that with each El Niño during this time interval, there is first a buildup of WWV beginning before the event onset, then a significant decrease in the WWV in the near-equatorial band during the event. The decrease in WWV during El Niño is much larger during the 1982-83, 1986-87, and 1997-98 events than in the events of the early 1990s. During the 1997-98 event, nearly 25% of the total WWV is lost from the Pacific near-equatorial region. The net transport required to explain these WWV changes (Fig. 4, bottom) ranges between 5-15 Sverdrups (Sv, 1 Sv = 106 m3 s-1) inflow and 10-28 Sv outflow, with the largest outflow occurring during the 1997-98 El Niño event. The rate of change of WWV is strongly correlated (in a negative sense) with the Niño-3 SST.
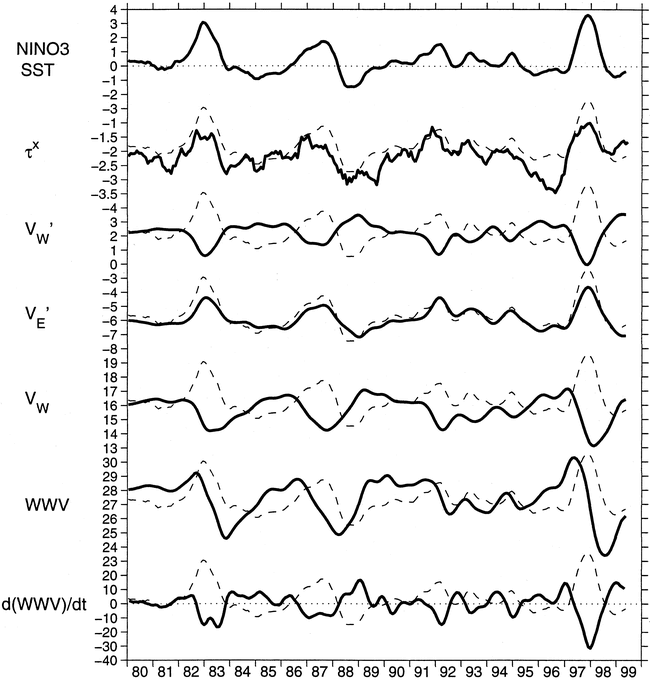
FIG. 4. Bold lines indicate, from top to bottom, Niño-3 SST in units
of °C; the zonal wind stress averaged across the Pacific within 5°S-5°N
in units of 10-2 N m-2; WWV determined from the Z20
anomaly about the zonal average Z20 integrated over the basin
west of 155°W (V W),
in units of 1014 m3; the warm water anomaly integrated
over the basin east of 155°W (VE)
(1014 m3), the total warm water volume west of 155°W
(VW) (1014 m3), the total WWV basinwide
within 5°S-5°N (1014 m3); and the observed rate
of change of WWV [d(WWV)/dt] (Sv). Dashed lines are the Niño-3 SST repeated
alongside each of the other time series to illustrate the phasing relationships
between the different quantities.
W),
in units of 1014 m3; the warm water anomaly integrated
over the basin east of 155°W (VE)
(1014 m3), the total warm water volume west of 155°W
(VW) (1014 m3), the total WWV basinwide
within 5°S-5°N (1014 m3); and the observed rate
of change of WWV [d(WWV)/dt] (Sv). Dashed lines are the Niño-3 SST repeated
alongside each of the other time series to illustrate the phasing relationships
between the different quantities.
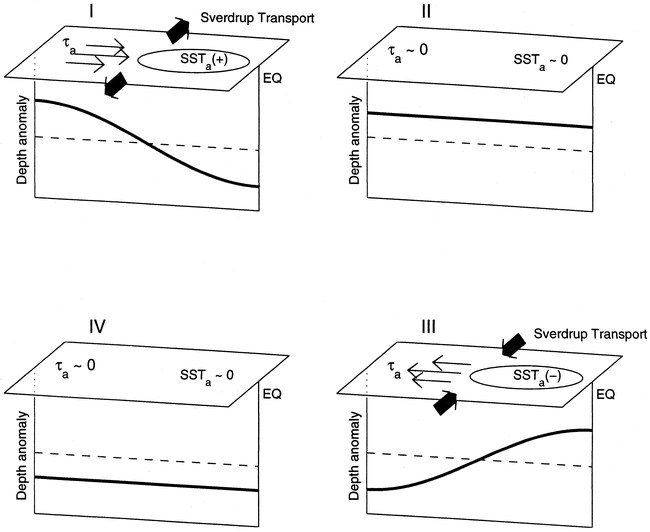
It can also be noted that extrema in WWV precede extrema in Niño-3 SST by several months. Correlation analysis indicates that the peak correlation (r = 0.70) occurs with SST lagging WWV by seven months (Fig. 5). This analysis was repeated by replacing WWV with the total warm water volume west of 155°W, VW, which is a test of Wyrtki's (1975b) hypothesis that heat content buildup in the western Pacific is precursor to ENSO. We note that VW is significantly correlated with Niño-3 SST at a longer lead than is WWV (Fig. 5), which is to be expected given the progression of events illustrated in Fig. 1. However, the maximum cross correlation between time series of VW and Niño-3 SST (r = 0.57) is lower than that for WWV and Niño-3 SST (r = 0.70), implying that WWV is a more reliable predictor of Niño-3 SST. The reduction in correlation at longer leads reflects the irregularity of the ENSO cycle, which is possibly due to nonlinear chaotic tendencies and/or stochastic forcing in the system (Jin 1997a)
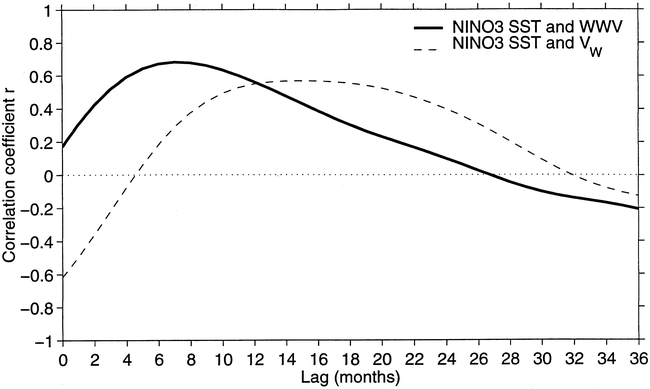
FIG. 5. Lagged cross correlations between the Niño-3 SST anomaly and
either the WWV (bold line) or the WWV "tilting" mode integrated west
of 155°W ( VW,
thin line). Correlations are for Niño-3 SST lagging both WWV quantities.
Peak correlation with WWV occurs at 7 months with a peak value of r =
0.70, the correlation with VW
peaks at 15 months with r = 0.57.
The Z20 anomaly about the zonal mean is a measure of the
anomalous slope of the main thermocline. It is calculated by spatially integrating
the residual Z20, after the removal of the zonal average Z20,
in two separate regions; west of 155°W (VW)
and east of 155°W (VE),
both within 5°S-5°N. The two time series have the identical shape
but opposite signs (Fig. 4). As predicted by
J97, the peaks in WWV occur at about the same time as VW
and VE go to zero;
the peak correlation (r = 0.68) between WWV and VE
occurs for a lag of about seven months. The lag between WWV and VE
is nearly the same as the observed lag between the two Z20
EOF modal amplitudes shown earlier (Fig. 3);
in fact, time series of the two EOF modes are well approximated by VE
and VW (similar
to EOF mode 1) and WWV (similar to EOF mode 2). The thermocline slope estimated
from VE and VW
is approximately in phase with the zonal winds and SST, as predicted in J97.
SST lags the winds by 1-2 months (r = 0.85), which for interannual variations,
is nearly in phase and is consistent with J97. WWV, on the other hand, leads
 x, the thermocline slope,
and Niño-3 SST by about seven months. It is this phase difference that
leads to the transitions between El Niño and La Niña events in the
J97 theory. These results are also consistent with delayed oscillator theory
(e.g., Schopf
and Suarez 1990) and the general circulation model results of Schneider
et al. (1995).
x, the thermocline slope,
and Niño-3 SST by about seven months. It is this phase difference that
leads to the transitions between El Niño and La Niña events in the
J97 theory. These results are also consistent with delayed oscillator theory
(e.g., Schopf
and Suarez 1990) and the general circulation model results of Schneider
et al. (1995).
Phase ellipses (Fig. 6) compare the Niño-3
SST against VW (Fig. 6a),
VW (Fig.
6b), and WWV (Fig. 6c). Figure
6a shows a phase ellipse similar to those shown in J97 using model output
and sea level data. It demonstrates that the variation of the main thermocline
in the western Pacific is indeed correlated with the Niño-3 SST and that
there is a phase lag of several months between the peak in SST and the peak
in thermocline depth. Figure 6b further demonstrates
that the adjustment between SST variations and the "tilting" component
of the main thermocline, VW,
is very fast, with a tight negative correlation and a 1-2 month lag. Figure
6c shows a nearly circular phase ellipse for WWV and Niño-3 SST, which
results from a relationship between these two variables that is close to quadrature.
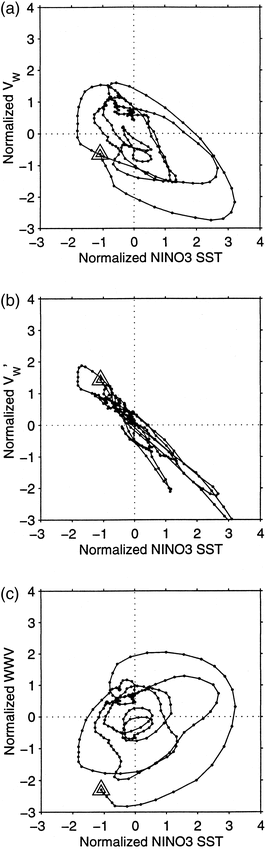
FIG. 6. Phase ellipses detailing the relationship between the Niño-3
SST and the main thermocline depth, and hence WWV, west of 155°W within
5°S-5°N: (a) relates Niño-3 SST to the total WWV west of 155°W
(VW), (b) shows the relationship between SST and the
WWV west of 155°W calculated after the zonal average Z20
is removed (VW), (c) shows
the relationship between the SST and WWV. All quantities have been normalized
by removing the mean seasonal cycle and dividing by the interannual standard
deviation. Dots denote each monthly value, triangles denote the end of the time
series.
In addition to these phase relationships, our analysis also indicates that there is a direct relationship between the magnitude of WWV changes along the equator and the magnitude of subsequent SST anomalies in the Niño-3 region. This is illustrated in Fig. 7, in which seasonal averages of these two quantities are regressed against one another. The time mean has been removed from each time series, and the Niño-3 SST record has been shifted backwards seven months to maximize the cross correlation. It is apparent that in general, the larger magnitude anomalies of WWV along the equator correspond to larger SST anomalies. There is an interesting asymmetry, however, in this relationship. For a given magnitude of WWV anomaly, positive values are associated with subsequent warm El Niño SST anomalies while negative values are associated with subsequent cold La Niña SST anomalies that are not as large as their warm counterparts. The slope of the regression curve is a factor of 3-4 larger on the positive side, and the difference is statistically significant at the 95% confidence level. A comparison was made for VW and SST as well, in which we found similar differences in slope for the positive and negative VW anomalies. Such asymmetries were not predicted by J97, and they warrant further investigation.
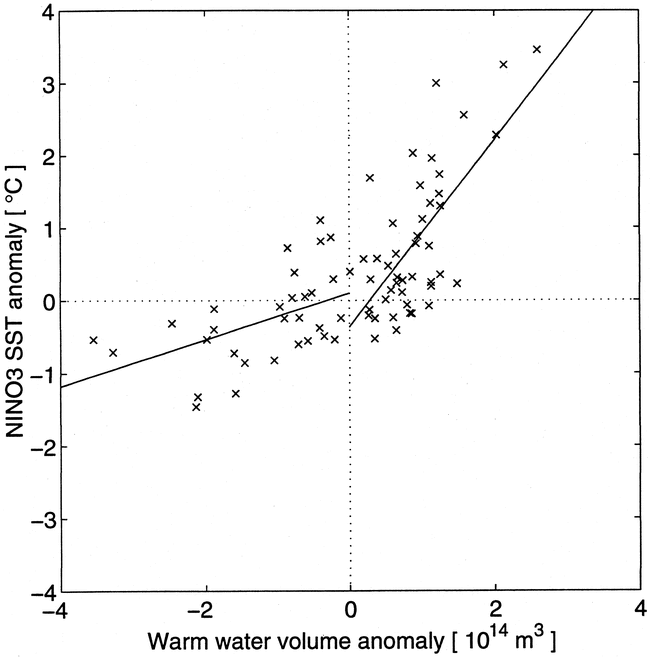
FIG. 7. Comparison of Niño-3 SST and WWV anomalies. Both time series have been seasonally averaged (i.e., Jan-Mar, Apr-Jun, etc.) to reduce the scatter. SST time series has been shifted backward by 7 months to maximize the cross correlation between WWV and SST. Lines represent least square fits to the values, separated into seasons with a negative WWV anomaly and those with a positive WWV anomaly. Slopes of the fitted lines are 0.32°C (1014 m3)-1 and 1.29°C (1014 m3)-1 for the negative and positive sides, respectively.
Return to previous section or go to next section