The El Niño-Southern Oscillation (ENSO) cycle dominates interannual variability in the equatorial Pacific and has been the subject of a great deal of study over the past several decades. Philander (1990) provides a review of many of the results of these studies; some of the more recent studies can be found in Barnett et al. (1991), Schneider et al. (1994, 1995), and Wang et al. (1999). Several studies have indicated that variability in the volume of warm water (WWV), and hence heat content, in the tropical Pacific is related to the ENSO cycle (Wyrtki 1985; Cane and Zebiak 1985; Zebiak 1989; Springer et al. 1990; Jin 1997a). At the simplest level, warm water builds up in the equatorial Pacific prior to El Niño and then is transported to higher latitudes during El Niño. WWV at the equator then slowly builds up again before the cycle repeats. It has been suggested, based on proxy measurements and modeling results, that this buildup of the WWV in the equatorial Pacific is a necessary precondition for the development of an El Niño (Wyrtki 1985; Cane et al. 1986).
Recently, Jin [1997a (hereafter J97)] and Jin (1997b) have produced a theoretical "recharge oscillator" paradigm to describe how changes in WWV are related to the timing of El Niño and La Niña events. In this theory, the depth of the main thermocline, and hence the WWV above it, plays an important dynamical role in the oscillation of the ENSO cycle by controlling the temperature of the waters upwelled in the eastern equatorial Pacific (i.e., deeper main thermocline results in the upwelling of warmer waters, and vice versa). Changes in the temperature of the upwelled waters in turn control the sea surface temperature (SST) anomalies in the eastern equatorial Pacific, which then impact the zonal winds via changes in the patterns of deep atmospheric convection and sea level pressure gradients. The result is a positive feedback (SST gradients create anomalous winds and winds amplify SST gradient) in either the El Niño or La Niña phases of the ENSO cycle until enough water has been discharged from or recharged into the equatorial region to end the event. Furthermore, J97 shows that this oscillator hypothesis is consistent with the "delayed oscillator" (Schopf and Suarez 1988; Suarez and Schopf 1988; Battisti and Hirst 1989), which is currently viewed as a leading paradigm to explain the ENSO cycle. The essential features of the delayed oscillator and the recent proposed refinements of it (e.g., Picaut et al. 1997; Weisberg and Wang 1997; Boulanger and Menkes 1999; McPhaden and Yu 1999) include equatorial wave processes, which affect thermocline depth and SST, and ocean-atmosphere feedbacks mediated by wind and SST variability.
Historical studies, which have endeavored to quantify the recharge and discharge of warm water from the equatorial Pacific, have been limited by the lack of available subsurface temperature measurements. Wyrtki (1985) estimated changes in the main thermocline depth using widely scattered island-based sea level measurements as a proxy. Zebiak (1989) looked at the problem using a dynamical model but had limited observational data with which to confirm his results. J97 attempted to demonstrate the validity of his theoretical oscillator by using widely scattered sea level measurements from island stations and, alternatively, using the output of the Zebiak and Cane model (Zebiak and Cane 1987). While these and other studies (e.g., Li and Clarke 1994; Mantua and Battisti 1994) have advanced the understanding of how the WWV changes during the ENSO cycle, there has, as of present, been no systematic test of the relevant concepts using subsurface ocean data. Also, no study to date has addressed the question of whether WWV variations during the very strong 1997-98 El Niño (McPhaden 1999) are similar to those of other events or whether they are consistent with the recharge oscillator theory of J97.
The theoretical oscillator proposed by J97 involves a number of testable hypotheses. Thus, the purpose of this paper is to determine to what extent available subsurface temperature observations confirm or refute this theoretical recharge oscillator and what further information these observations can provide regarding the El Niño-La Niña cycle. Our study utilizes a dataset of monthly gridded ocean temperatures developed using an optimal interpolation technique, which incorporates hydrographic and moored temperature data over the interval of 1980 to the present. These data span several large El Niño events, including the very strong 1997-98 event, and they represent the best available observational information with which to study the changes in WWV in the equatorial Pacific.
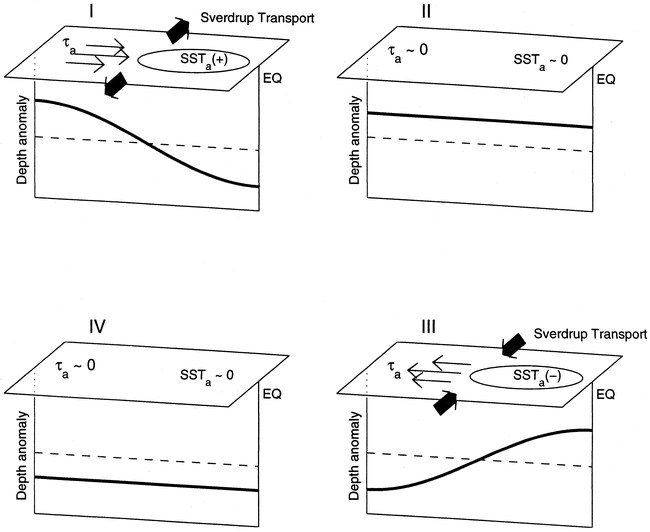
The recharge oscillator theory of J97 is schematically illustrated in Fig. 1. All quantities in the figure are anomalies relative to the climatological mean seasonal cycle. The mean structure involves a thermocline shoaling to the east; westward winds throughout the basin, causing upwelling due to Ekman divergence; and higher SST in the western Pacific warm pool.
FIG. 1. Idealized schematic of the El Niño-La Niña oscillation
(modified from Jin 1997a). All quantities shown are anomalies relative to the
climatological mean. Depth anomaly is relative to the time mean structure along
the equator. Dashed line indicates zero anomaly; shallow anomalies are above
the dashed line and deep anomalies are below the dashed line. Thin arrows and
symbol  a represent the anomalous
zonal wind stress; bold thick arrows represent the corresponding anomalous Sverdrup
transports. SSTa is the sea surface temperature anomaly. Oscillation
progresses clockwise around the panels following the roman numerals; panel I
represents El Niño conditions, panel III indicates La Niña conditions.
a represent the anomalous
zonal wind stress; bold thick arrows represent the corresponding anomalous Sverdrup
transports. SSTa is the sea surface temperature anomaly. Oscillation
progresses clockwise around the panels following the roman numerals; panel I
represents El Niño conditions, panel III indicates La Niña conditions.
The oscillation proposed by J97 results from phase lags between changes in the zonally averaged main thermocline depth and changes in the eastern Pacific SST, central Pacific zonal wind stress, and zonal thermocline tilt, the latter three being in phase with one another. In this theory, the discharge (recharge) of the warm water to (from) higher latitudes is affected by the meridional transports resulting from the anomalous eastward (westward) zonal winds near the equator. In particular, meridional transports in the ocean interior (i.e., away from the western boundary currents) are close to being in Sverdrup balance with the wind stress curl (Philander 1990). These transports are incompletely balanced by western boundary current transports on interannual time scales (e.g., Springer et al. 1990), which leads to low frequency changes in the WWV near the equator associated with the ENSO cycle.
The transition to El Niño (La Niña) results from the wind-driven upwelling of warmer (colder) waters due to the deeper (shallower)-than-normal main thermocline. Since the climatological thermocline is deeper in the western Pacific than in the eastern, changes in the temperature of upwelled water are smaller in the west than in the east. These E-W contrasts lead to changes in the zonal gradient of SST and in zonal wind stress. The oscillatory nature of ENSO in this scenario results from the disequilibrium between equatorial zonal winds and zonal mean thermocline depth, the latter of which is associated with meridionally converging and diverging Sverdrup transports.
J97 documented aspects of these variations using observations. However, the ocean data available to him was limited to SST and scattered-island sea level measurements. The datasets used in this study are better suited to testing the hypothesized relationships.
The gridded subsurface temperature dataset, prepared by Neville Smith's group at the Australian Bureau of Meteorology Research Centre (BMRC), provides subsurface temperature at 14 depth levels between the surface and 500 m on a 1° lat × 2° long grid at monthly intervals. It was created by an optimal interpolation technique, which combined hydrographic measurements with moored temperature measurements from the Tropical Atmosphere and Ocean (TAO) Array (McPhaden et al. 1998). The development and preparation of the BMRC dataset are discussed in Smith et al. (1991), Smith (1991), Meyers et al. (1991), and Smith (1995a,b). The time series spans from 1980 to the present. The depth of the main thermocline is estimated using the depth of the 20°C isotherm, Z20, which is found in the middle of the main thermocline throughout the region (Kessler 1990). The depth of Z20 is determined by interpolation of the gridded subsurface temperatures.
Two other measured quantities are used in this study: SST and zonal wind stress
(x). The SST data used in
this study come from Reynolds and Smith (1994, 1995). The gridded SST values
represent a blending of satellite-based and in situ SST measurements on a 1°
lat × 1° long grid at a weekly time interval. The x
used here is derived from The Florida State University (FSU) pseudostress fields,
which are gridded on a 2° lat × 2° long grid at a monthly time
interval (Stricherz et al. 1992; Stricherz et al. 1997). The gridded winds represent
a blending of ship measurements and data from moored buoys, such as the aforementioned
TAO array. Pseudostress was converted to stress using a constant air density
of 1.2 kg m-3 and a constant drag coefficient of 1.4 × 10⁻³.
Anomaly time series (Z20, x
, SST) shown in this paper have had the mean seasonal cycle removed. They have
also been filtered with a five-month running mean to emphasize interannual variability.
The mean (Fig. 2a) and standard deviation of monthly anomalies about the mean seasonal cycle (Fig. 2b) for Z20 were calculated over the time interval of Jan 1980-May 1999. The basic structure along the equator is as expected, with a deep thermocline beneath the western Pacific warm pool and a shallow thermocline in the eastern Pacific. A mean meridional ridge-trough system, analogous to the ridge-trough system in sea level (Wyrtki 1975b), is also apparent. The largest variability in Z20 is centered along the equator in the eastern Pacific, with a peak standard deviation of over 20 m near 110°W. Off-equatorial maxima are found in the western Pacific between 5°-10°N and S. Values greater than 12 m span the basin along the equator. The variability drops off at higher latitudes.
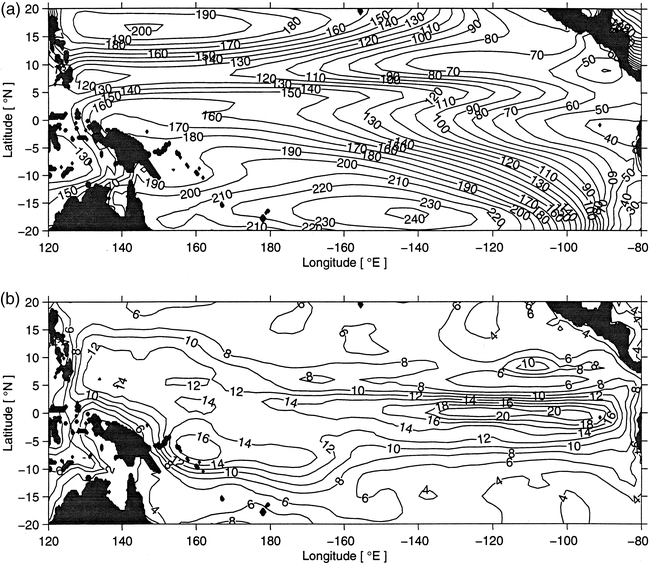
FIG. 2. (a) Temporal mean and (b) standard deviation about the mean seasonal cycle of Z20 over the interval Jan 1980-May 1999. Contour values are in meters. Shaded areas represent land.
To look at the structure of the variations in Z20 over time, an empirical orthogonal function (EOF) analysis (Emery and Thomson 1997) was performed on the 20-yr time series of Z20 in the equatorial region. Figure 3 shows the spatial structures and amplitudes of the first two EOF modes of Z20. These two modes represent 28% and 21%, respectively, of the total variance in Z20; higher modes each represent less than 7% of the total variance. The first mode can be viewed as an E-W tilting mode, with the axis near 150°W. This mode is similar to the "standing mode" suggested by Wang et al. (1999) on the basis of the National Centers for Environmental Prediction (NCEP) ocean model reanalysis results. The second mode, which explains nearly as much variance as the first mode, involves more of an N-S tilting along an axis centered near 5°N and a maximum variance on the equator in the eastern and central Pacific. This second EOF mode involves a discharge and recharge of warm water in the near-equatorial Pacific. The southern extent of this recharge mode is not well defined in these data, but the northern node is aligned with the mean pathway of the North Equatorial Counter-Current (NECC). The peak correlation (r = 0.77) between the two modes occurs with the first mode lagging the second mode by nine months. The peak is broad, with statistically significant correlations at the 95% level for lag/leads of 6-15 months.
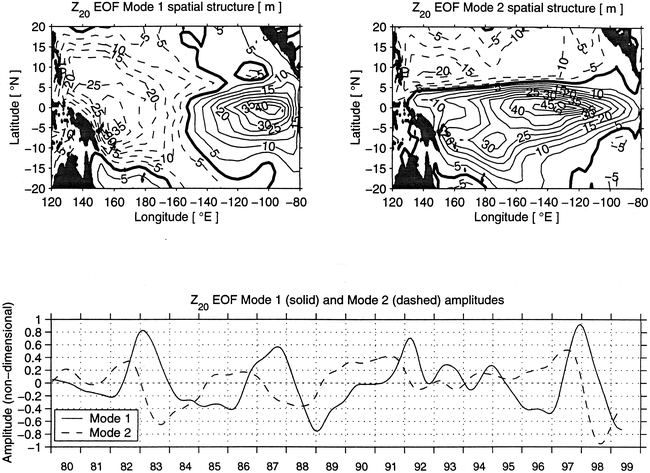
FIG. 3. First two empirical orthogonal functions (EOFs) fit to Z20. Upper panels denote spatial structure of the modes with contours (m); bold contour denotes zero. Shaded areas represent land. Lower panel shows mode amplitudes, which are nondimensional, as a function of time.
Water above the 20°C isotherm is defined as "warm water" in this study, and WWV is determined by spatial integration of Z20 over the region 5°S-5°N, 120°E-80°W. Figure 4 (near bottom) shows a time series of the WWV along with the zonal wind stress averaged over the same area (near top) and the SST in the Niño-3 region (top). The Niño-3 region is defined as 5°S-5°N, 150°-90°W, and the SST in this region is a commonly used indicator for the ENSO cycle (Trenberth 1997). The zonal winds show the expected westerly anomalies coincident with the warm Niño-3 SST events (warm SST occurring in 1982-83, 1986-87, 1991-92, 1993, 1994-95, and 1997-98). Figure 4 also indicates that with each El Niño during this time interval, there is first a buildup of WWV beginning before the event onset, then a significant decrease in the WWV in the near-equatorial band during the event. The decrease in WWV during El Niño is much larger during the 1982-83, 1986-87, and 1997-98 events than in the events of the early 1990s. During the 1997-98 event, nearly 25% of the total WWV is lost from the Pacific near-equatorial region. The net transport required to explain these WWV changes (Fig. 4, bottom) ranges between 5-15 Sverdrups (Sv, 1 Sv = 106 m3 s-1) inflow and 10-28 Sv outflow, with the largest outflow occurring during the 1997-98 El Niño event. The rate of change of WWV is strongly correlated (in a negative sense) with the Niño-3 SST.
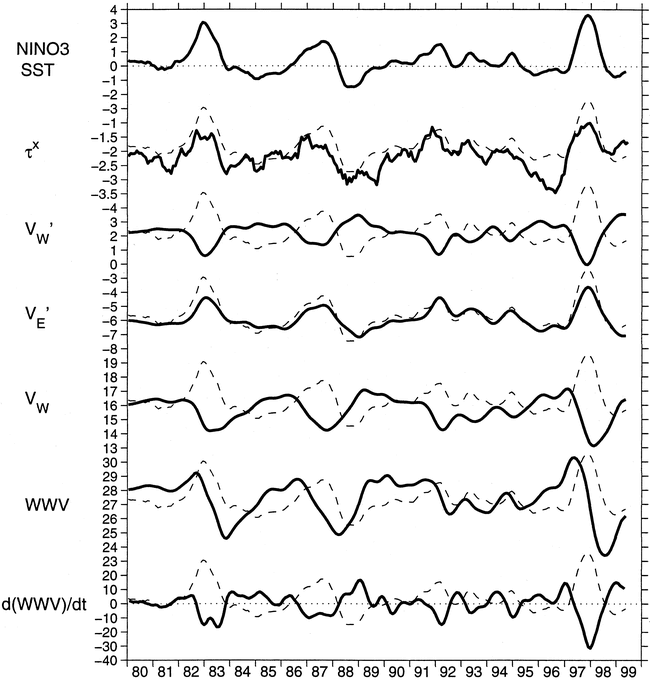
FIG. 4. Bold lines indicate, from top to bottom, Niño-3 SST in units
of °C; the zonal wind stress averaged across the Pacific within 5°S-5°N
in units of 10-2 N m-2; WWV determined from the Z20
anomaly about the zonal average Z20 integrated over the basin
west of 155°W (V W),
in units of 1014 m3; the warm water anomaly integrated
over the basin east of 155°W (VE)
(1014 m3), the total warm water volume west of 155°W
(VW) (1014 m3), the total WWV basinwide
within 5°S-5°N (1014 m3); and the observed rate
of change of WWV [d(WWV)/dt] (Sv). Dashed lines are the Niño-3 SST repeated
alongside each of the other time series to illustrate the phasing relationships
between the different quantities.
W),
in units of 1014 m3; the warm water anomaly integrated
over the basin east of 155°W (VE)
(1014 m3), the total warm water volume west of 155°W
(VW) (1014 m3), the total WWV basinwide
within 5°S-5°N (1014 m3); and the observed rate
of change of WWV [d(WWV)/dt] (Sv). Dashed lines are the Niño-3 SST repeated
alongside each of the other time series to illustrate the phasing relationships
between the different quantities.
It can also be noted that extrema in WWV precede extrema in Niño-3 SST by several months. Correlation analysis indicates that the peak correlation (r = 0.70) occurs with SST lagging WWV by seven months (Fig. 5). This analysis was repeated by replacing WWV with the total warm water volume west of 155°W, VW, which is a test of Wyrtki's (1975b) hypothesis that heat content buildup in the western Pacific is precursor to ENSO. We note that VW is significantly correlated with Niño-3 SST at a longer lead than is WWV (Fig. 5), which is to be expected given the progression of events illustrated in Fig. 1. However, the maximum cross correlation between time series of VW and Niño-3 SST (r = 0.57) is lower than that for WWV and Niño-3 SST (r = 0.70), implying that WWV is a more reliable predictor of Niño-3 SST. The reduction in correlation at longer leads reflects the irregularity of the ENSO cycle, which is possibly due to nonlinear chaotic tendencies and/or stochastic forcing in the system (Jin 1997a)
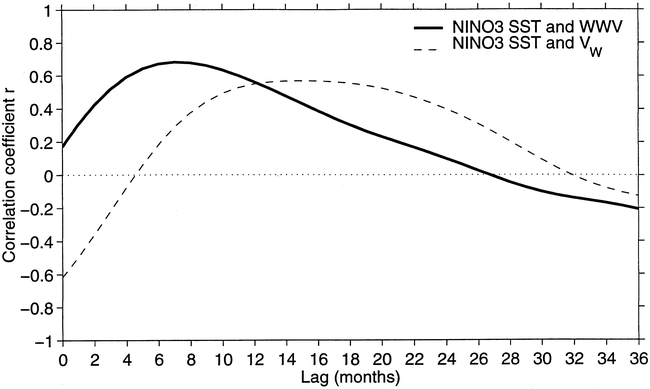
FIG. 5. Lagged cross correlations between the Niño-3 SST anomaly and
either the WWV (bold line) or the WWV "tilting" mode integrated west
of 155°W ( VW,
thin line). Correlations are for Niño-3 SST lagging both WWV quantities.
Peak correlation with WWV occurs at 7 months with a peak value of r =
0.70, the correlation with VW
peaks at 15 months with r = 0.57.
The Z20 anomaly about the zonal mean is a measure of the
anomalous slope of the main thermocline. It is calculated by spatially integrating
the residual Z20, after the removal of the zonal average Z20,
in two separate regions; west of 155°W (VW)
and east of 155°W (VE),
both within 5°S-5°N. The two time series have the identical shape
but opposite signs (Fig. 4). As predicted by
J97, the peaks in WWV occur at about the same time as VW
and VE go to zero;
the peak correlation (r = 0.68) between WWV and VE
occurs for a lag of about seven months. The lag between WWV and VE
is nearly the same as the observed lag between the two Z20
EOF modal amplitudes shown earlier (Fig. 3);
in fact, time series of the two EOF modes are well approximated by VE
and VW (similar
to EOF mode 1) and WWV (similar to EOF mode 2). The thermocline slope estimated
from VE and VW
is approximately in phase with the zonal winds and SST, as predicted in J97.
SST lags the winds by 1-2 months (r = 0.85), which for interannual variations,
is nearly in phase and is consistent with J97. WWV, on the other hand, leads
x, the thermocline slope,
and Niño-3 SST by about seven months. It is this phase difference that
leads to the transitions between El Niño and La Niña events in the
J97 theory. These results are also consistent with delayed oscillator theory
(e.g., Schopf and Suarez 1990) and the general circulation model results of
Schneider et al. (1995).
Phase ellipses (Fig. 6) compare the Niño-3
SST against VW (Fig. 6a),
VW (Fig.
6b), and WWV (Fig. 6c). Figure
6a shows a phase ellipse similar to those shown in J97 using model output
and sea level data. It demonstrates that the variation of the main thermocline
in the western Pacific is indeed correlated with the Niño-3 SST and that
there is a phase lag of several months between the peak in SST and the peak
in thermocline depth. Figure 6b further demonstrates
that the adjustment between SST variations and the "tilting" component
of the main thermocline, VW,
is very fast, with a tight negative correlation and a 1-2 month lag. Figure
6c shows a nearly circular phase ellipse for WWV and Niño-3 SST, which
results from a relationship between these two variables that is close to quadrature.
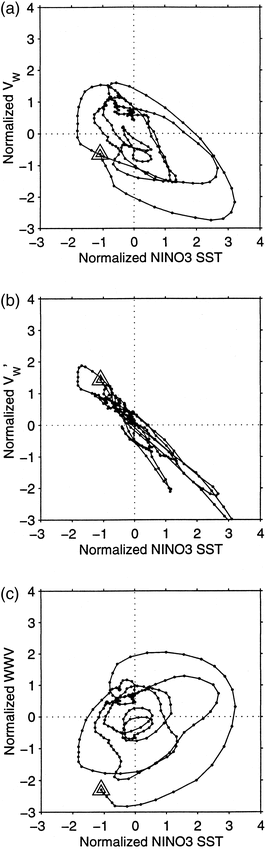
FIG. 6. Phase ellipses detailing the relationship between the Niño-3
SST and the main thermocline depth, and hence WWV, west of 155°W within
5°S-5°N: (a) relates Niño-3 SST to the total WWV west of 155°W
(VW), (b) shows the relationship between SST and the
WWV west of 155°W calculated after the zonal average Z20
is removed (VW), (c) shows
the relationship between the SST and WWV. All quantities have been normalized
by removing the mean seasonal cycle and dividing by the interannual standard
deviation. Dots denote each monthly value, triangles denote the end of the time
series.
In addition to these phase relationships, our analysis also indicates that there is a direct relationship between the magnitude of WWV changes along the equator and the magnitude of subsequent SST anomalies in the Niño-3 region. This is illustrated in Fig. 7, in which seasonal averages of these two quantities are regressed against one another. The time mean has been removed from each time series, and the Niño-3 SST record has been shifted backwards seven months to maximize the cross correlation. It is apparent that in general, the larger magnitude anomalies of WWV along the equator correspond to larger SST anomalies. There is an interesting asymmetry, however, in this relationship. For a given magnitude of WWV anomaly, positive values are associated with subsequent warm El Niño SST anomalies while negative values are associated with subsequent cold La Niña SST anomalies that are not as large as their warm counterparts. The slope of the regression curve is a factor of 3-4 larger on the positive side, and the difference is statistically significant at the 95% confidence level. A comparison was made for VW and SST as well, in which we found similar differences in slope for the positive and negative VW anomalies. Such asymmetries were not predicted by J97, and they warrant further investigation.
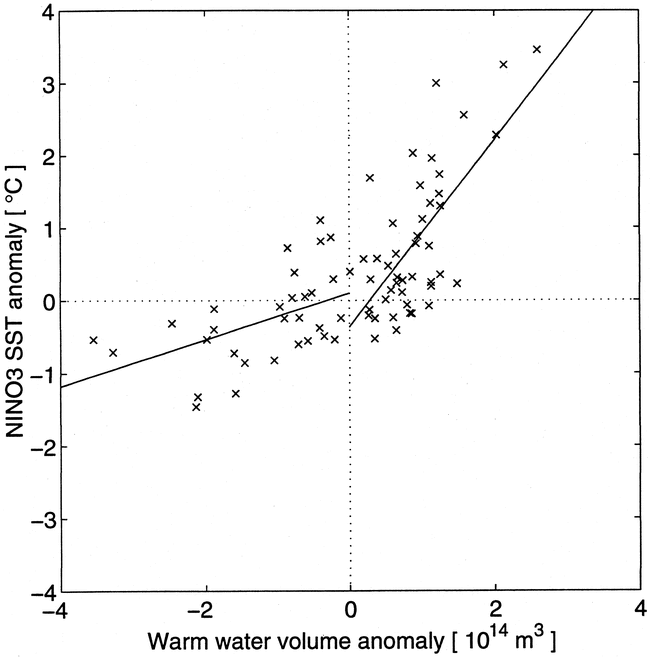
FIG. 7. Comparison of Niño-3 SST and WWV anomalies. Both time series have been seasonally averaged (i.e., Jan-Mar, Apr-Jun, etc.) to reduce the scatter. SST time series has been shifted backward by 7 months to maximize the cross correlation between WWV and SST. Lines represent least square fits to the values, separated into seasons with a negative WWV anomaly and those with a positive WWV anomaly. Slopes of the fitted lines are 0.32°C (1014 m3)-1 and 1.29°C (1014 m3)-1 for the negative and positive sides, respectively.
This study utilized gridded datasets of subsurface temperature, SST, and zonal winds to test how well the "recharge oscillator," proposed by J97, agreed with observations over the time interval of 1980-99. The variation in the depth of the 20°C isotherm, Z20, was observed to consist of two main modes, which can be characterized as an "east-west tilting" mode and an "equatorial discharge-recharge" mode. The Niño-3 SST, zonal winds, and the tilting mode are all nearly in phase with one another while the recharge mode leads the tilting mode, zonal winds, and SST by about 7 months on average. The character of the ENSO cycle observed during 1980-99, especially the warm events with large WWV expressions in 1982-83, 1986-87, and 1997-98, is consistent with the recharge oscillator, as postulated in J97.
We found that the amplitudes of WWV anomalies are linearly related to the amplitudes of the Niño-3 SST anomalies, with larger anomalies in WWV preceding larger anomalies in SST. However, for a given magnitude of WWV anomaly, positive values are associated with larger-magnitude SST anomalies than negative values. This asymmetry implies differences in the relative importance of physical processes controlling SST during El Niño and La Niña events. It may be, for example, that air-sea fluxes, which are a negative feedback on SST anomaly growth in the equatorial cold tongue (Wang and McPhaden 2000), are more effective at heating the ocean during cold phases of ENSO than they are at cooling the ocean during warm phases of ENSO. Alternately, the ability of upwelling and vertical mixing to cool the surface may saturate at some threshold beyond which further thermocline shoaling does not lead to further SST cooling. In any case, more study is needed to determine the limiting mechanisms for SST anomalies during La Niña versus El Niño events.
Our study confirms that warm water volume changes in the western Pacific (Wyrtki 1975a) and zonally averaged along the equator (Wyrtki 1985; Cane et al. 1986) are useful predictors of ENSO timescale SST variations. The physical mechanisms responsible for these warm water changes involve wind-forced equatorial wave processes, as described by the delayed oscillator. Clearly, ocean models used for predicting ENSO variations should reproduce these changes. Furthermore, because measurements of upper-ocean thermal structure are now routinely available from the TAO array and from regular expendable bathythermograph (XBT) sections, models that assimilate these data can expect to see improvements in forecast skill for ENSO events (e.g., Ji and Leetmaa 1997). Changes in western Pacific warm water volume (VW) precede basinwide WWV changes, however they are less well correlated with subsequent Niño-3 SSTs. This implies a reduction in predictability at longer lead times, which reflects the irregularity of the ENSO cycle.
Description of the actual pathways by which the warm water moves between the Tropics and the higher latitudes are beyond the scope of this paper. A subsequent article will present a WWV balance for the equatorial Pacific and will discuss the mechanisms for WWV changes during 1993-99, when observations are the most plentiful (Meinen and McPhaden 1999, manuscript submitted to J. Phys. Oceanogr.). This study has provided the first step, however, by quantifying how the volume of warm water greater than 20°C changes on interannual timescales.
Acknowledgments. The authors would like to thank Dr. Neville Smith of the Australian BMRC for providing the subsurface temperature dataset. They would also like to thank Dr. James O’Brien and his group at The Florida State University for the wind dataset and Dr. Richard Reynolds at NCEP for the SST dataset. Funding for this project was provided by NOAA’s Office of Global Programs and Environmental Research Laboratories. This paper is PMEL contribution number 2119. This publication was also supported by the Joint Institute for the Study of the Atmosphere and Ocean (JISAO) under NOAA Cooperative Agreement #NA67RJO155, contribution number 713.
Barnett, T. P., M. Latif, E. Kirk, and E. Roeckner, 1991: On ENSO physics. J. Climate, 4, 487-515.
Battisti, D. S., and A. C. Hirst, 1989: Interannual variability in a tropical atmosphere-ocean model: Influence of the basic state, ocean geometry, and nonlinearity. J. Atmos. Sci., 46, 1687-1712.
Boulanger, J.-P., and C. Menkes, 1999: Long equatorial wave reflection in the Pacific Ocean from TOPEX/POSEIDON data during the 1992-1998 period. Climate Dyn., 15, 205-226.
Cane, M. A., and S. E. Zebiak, 1985: A theory for El Niño and the Southern Oscillation. Science, 228, 1085-1087.
Cane, M. A., S. E. Zebiak, and S. C. Dolan, 1986: Experimental forecasts of El Niño. Nature, 321, 827-832.
Emery, W. J., and R. E. Thomson, 1997. Data Analysis Methods in Physical Oceanography. Pergamon Press, 634 pp.
Ji, M., and A. Leetmaa, 1997: Impact of data assimilation on ocean initialization and El Niño prediction. Mon. Wea. Rev., 125, 742- 753.
Jin, F.-F., 1997a: An equatorial ocean recharge paradigm for ENSO. Part I: Conceptual model. J. Atmos. Sci., 54, 811-829.
Jin, F.-F., 1997b: An equatorial ocean recharge paradigm for ENSO. Part II: A stripped-down coupled model. J. Atmos. Sci., 54, 830-847.
Kessler, W. S., 1990: Observations of long Rossby waves in the northern tropical Pacific. J. Geophys. Res., 95, 5183-5217.
Li, B., and A. J. Clarke, 1994: An examination of some ENSO mechanisms using interannual sea level at the eastern and western equatorial boundaries and the zonally averaged equatorial wind. J. Phys. Oceanogr., 24, 681-690.
Mantua, N. J., and D. S. Battisti, 1994: Evidence for the delayed oscillator mechanism for ENSO: The "observed" oceanic Kelvin mode in the far western Pacific. J. Phys. Oceanogr., 24, 691-699.
McPhaden, M. J., 1999: Genesis and evolution of the 1997-1998 El Niño. Science, 283, 950-954.
McPhaden, M. J., and X. Yu, 1999: Equatorial waves and the 1997-98 El Niño. Geophys. Res. Lett., 26, 2961-2964.
McPhaden, M. J., and Coauthors, 1998: The Tropical Ocean Global Atmosphere (TOGA) observing system: A decade of progress. J. Geophys. Res., 103, 14,169-14,240.
Meyers, G., H. Phillips, N. R. Smith, and J. Sprintall, 1991: Space and time scales for optimum interpolation of temperature—tropical Pacific Ocean. Progress in Oceanography, Vol. 28, Pergamon, 189-218.
Philander, S. G. H., 1990: El Niño, La Niña, and the Southern Oscillation. Academic Press, 289 pp.
Picaut, J., F. Masia, and Y. du Penhoat, 1997: An advective–reflective conceptual model for the oscillatory nature of the ENSO. Science, 277, 663-666.
Reynolds, R. W., and T. M. Smith, 1994: Improved global sea surface temperature analyses using optimum interpolation. J. Climate, 7, 929-948.
Reynolds, R. W., and T. M. Smith, 1995: A high resolution global sea surface temperature climatology. J. Climate, 8, 1571-1583.
Schneider, E. K., B. Huang, and J. Shukla, 1994: Ocean wave dynamics and El Niño. Center for Ocean-Land-Atmosphere Studies, Rep. 1, 46 pp.
Schneider, E. K., B. Huang, and J. Shukla, 1995: Ocean wave dynamics and El Niño. J. Climate, 8, 2415-2439.
Schopf, P. S., and M. J. Suarez, 1988: Vacillations in a coupled ocean-atmosphere model. J. Atmos. Sci., 45, 549-566.
Schopf, P. S., and M. J. Suarez, 1990: Ocean wave dynamics and the time scale of ENSO. J. Phys. Oceanogr., 20, 629-645.
Smith, N. R., 1991: Objective quality controls and performance diagnostics of an oceanic subsurface thermal analysis scheme. J. Geophys. Res., 96, 3279-3287.
Smith, N. R., 1995a: The BMRC ocean thermal analysis system. Aust. Meteor. Mag., 44, 93-110.
Smith, N. R., 1995b: An improved system for tropical ocean sub-surface temperature analyses. J. Atmos. Oceanic Technol., 12, 850-870.
Smith, N. R., J. E. Blomley, and G. Meyers, 1991: A univariate statistical interpolation scheme for subsurface thermal analyses in the tropical oceans. Progress in Oceanography, Vol. 28, Pergamon, 219-256.
Springer, S. R., M. J. McPhaden, and A. J. Busalacchi, 1990: Oceanic heat content variability in the tropical Pacific during the 1982-1983 El Niño. J. Geophys. Res., 95, 22,089-22,101.
Stricherz, J. N., J. J. O'Brien, and D. M. Legler, 1992: Atlas of Florida State University Tropical Pacific Winds for TOGA 1966-1985. The Florida State University, 275 pp.
Stricherz, J. N., D. M. Legler, and J. J. O'Brien, 1997: Pacific Ocean. Vol. 2, TOGA Pseudo-stress Atlas 1985-1994. The Florida State University, 163 pp.
Suarez, M. J., and P. S. Schopf, 1988: A delayed action oscillator for ENSO. J. Atmos. Sci., 45, 3283-3287.
Trenberth, K. E., 1997: The definition of El Niño. Bull. Amer. Meteor. Soc., 78, 2771-2777.
Wang, B., R. Wu, and R. Lukas, 1999: Roles of the western north Pacific wind variation in thermocline adjustment and ENSO phase transition. J. Meteor. Soc. Japan, 77, 1-16.
Wang, W., and M. J. McPhaden, 2000: The surface-layer heat balance in the equatorial Pacific Ocean, Part II: Interannual variability. J. Phys. Oceanogr., in press.
Weisberg, R. H., and C. Wang, 1997: Slow variability in the equatorial west-central Pacific in relation to ENSO. J. Climate, 10, 1998-2017.
Wyrtki, K., 1975a: El Niño—the dynamic response of the equatorial Pacific ocean to atmospheric forcing. J. Phys. Oceanogr., 5, 572-584.
Wyrtki, K., 1975b: Fluctuations in the dynamic topography in the Pacific Ocean. J. Phys. Oceanogr., 5, 450-459.
Wyrtki, K., 1985: Water displacements in the Pacific and the genesis of El Niño cycles. J. Geophys. Res., 90, 7129-7132.
Zebiak, S. E., 1989: Oceanic heat content variability and El Niño cycles. J. Phys. Oceanogr., 19, 475-486.
Zebiak, S. E., and M. A. Cane, 1987: A model El Niño-Southern Oscillation. Mon. Wea. Rev., 115, 2262-2278.
Return to Abstract