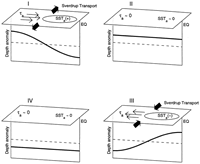
FIG. 1. Idealized schematic of the El Niño-La Niña oscillation
(modified from Jin
1997a). All quantities shown are anomalies relative to the climatological
mean. Depth anomaly is relative to the time mean structure along the equator.
Dashed line indicates zero anomaly; shallow anomalies are above the dashed line
and deep anomalies are below the dashed line. Thin arrows and symbol  a
represent the anomalous zonal wind stress; bold thick arrows represent the corresponding
anomalous Sverdrup transports. SSTa is the sea surface temperature
anomaly. Oscillation progresses clockwise around the panels following the roman
numerals; panel I represents El Niño conditions, panel III indicates La
Niña conditions.
a
represent the anomalous zonal wind stress; bold thick arrows represent the corresponding
anomalous Sverdrup transports. SSTa is the sea surface temperature
anomaly. Oscillation progresses clockwise around the panels following the roman
numerals; panel I represents El Niño conditions, panel III indicates La
Niña conditions.
FIG. 2. (a) Temporal mean and (b) standard deviation about the mean seasonal cycle of Z20 over the interval Jan 1980-May 1999. Contour values are in meters. Shaded areas represent land.
FIG. 3. First two empirical orthogonal functions (EOFs) fit to Z20. Upper panels denote spatial structure of the modes with contours (m); bold contour denotes zero. Shaded areas represent land. Lower panel shows mode amplitudes, which are nondimensional, as a function of time.
FIG. 4. Bold lines indicate, from top to bottom, Niño-3 SST in units
of °C; the zonal wind stress averaged across the Pacific within 5°S-5°N
in units of 10-2 N m-2; WWV determined from the Z20
anomaly about the zonal average Z20 integrated over the basin
west of 155°W (V W),
in units of 1014 m3; the warm water anomaly integrated
over the basin east of 155°W (V
 E)
(1014 m3), the total warm water volume west of 155°W
(VW) (1014 m3), the total WWV basinwide
within 5°S-5°N (1014 m3); and the observed rate
of change of WWV [d(WWV)/dt] (Sv). Dashed lines are the Niño-3 SST repeated
alongside each of the other time series to illustrate the phasing relationships
between the different quantities.
FIG. 5. Lagged cross correlations between the Niño-3 SST anomaly and
either the WWV (bold line) or the WWV "tilting" mode integrated west
of 155°W ( V W,
thin line). Correlations are for Niño-3 SST lagging both WWV quantities.
Peak correlation with WWV occurs at 7 months with a peak value of r =
0.70, the correlation with V
 W
peaks at 15 months with r = 0.57.
FIG. 6. Phase ellipses detailing the relationship between the Niño-3
SST and the main thermocline depth, and hence WWV, west of 155°W within
5°S-5°N: (a) relates Niño-3 SST to the total WWV west of 155°W
(VW), (b) shows the relationship between SST and the
WWV west of 155°W calculated after the zonal average Z20
is removed (V W), (c) shows
the relationship between the SST and WWV. All quantities have been normalized
by removing the mean seasonal cycle and dividing by the interannual standard
deviation. Dots denote each monthly value, triangles denote the end of the time
series.
FIG. 7. Comparison of Niño-3 SST and WWV anomalies. Both time series have been seasonally averaged (i.e., Jan-Mar, Apr-Jun, etc.) to reduce the scatter. SST time series has been shifted backward by 7 months to maximize the cross correlation between WWV and SST. Lines represent least square fits to the values, separated into seasons with a negative WWV anomaly and those with a positive WWV anomaly. Slopes of the fitted lines are 0.32°C (1014 m3)-1 and 1.29°C (1014 m3)-1 for the negative and positive sides, respectively.
Return to previous section or go to Abstract